By IFCMarkets
Australian Reserve Bank may abandon rate cuts
Today we present you another personal composite instrument (PCI). It is the Australian dollar &AUD_Index. We believe that it reflects to the fullest extent the Australian economic advance and has a low sensitivity to other countries currency fluctuations. Reserve Bank of Australia held a regular meeting on Tuesday. It decided, as was anticipated, to keep the rate at the 2% record low. At the same time the regulator unexpectedly assumed that the national currency has been already adapted to current low commodity prices. Market participants supposed that the bank would not cut the rate in the near future. It did twice this year and largely because of this the Australian dollar fell to its 6-year lowest last week. Today it showed a sharp growth. The June Trade Deficit release provided additional support to the currency. Trade Deficit totaled А2.9bln, slightly outstripping estimated А3.1bln. Australian economy demonstrates a steady growth. In the first quarter 2015 GDP increased 2.3% (YoY). It contacted once as early as in 1991. Quarter-over-quarter GDP retreated in 2008 and 2011 but investors observed a slowdown only in the course of a single quarter. So there was no recession in formal terms. To be noted, the next GDP release is expected only October, 2. Now that the further rate cut has become less likely, the Australian dollar may strengthen. In theory, we can take advantage of it by using carry trade strategies since the current 2% level looks very attractive when comparing it to other countries rates.

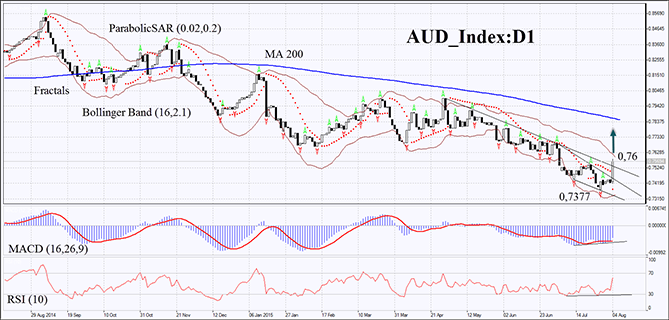
On the daily chart the &AUD_Index showed a sharp growth, crossing two resistance lines of the downtrend and two latest fractals. It moved far enough from the 200-day Moving Average. The Bollinger bands lower boundary has a positive slope. Meanwhile, the bands did not narrow much, indicating rather low volatility. Parabolic shaped a buy signal. MACD bars formed a bullish divergence; they are located below the signal line, confirming our assumptions. RSI-Bars has been growing and has also formed a bullish divergence. It has moved above 50 but has not yet reached the overbought zone. The bullish momentum may continue if another AUD_Index bar closes above the Bollinger upper boundary at 0.76. A stop loss may be placed below the first Parabolic signal, which may now act as a support line. We can also place a stop loss below the latest fractal minimum at 0.7377. This level appears to be a six-year low for this PCI. After pending order activation the stop loss is supposed to be moved every four hours to the next fractal low, following Parabolic and Bollinger signals. Thus, we are changing the probable profit/loss ratio to the breakeven point. The most cautious traders are recommended to switch to the H4 time frame and place a stop loss there, moving it after the trend. If the price reaches the stop loss without triggering the order, we recommend to cancel the position: the market sustains internal changes that were not considered.
| Position | Buy |
| Buy stop | above 0.76 |
| Stop loss | below 0.7377 |
Market Analysis provided by IFCMarkets