By IFCMarkets
Testing and breakout
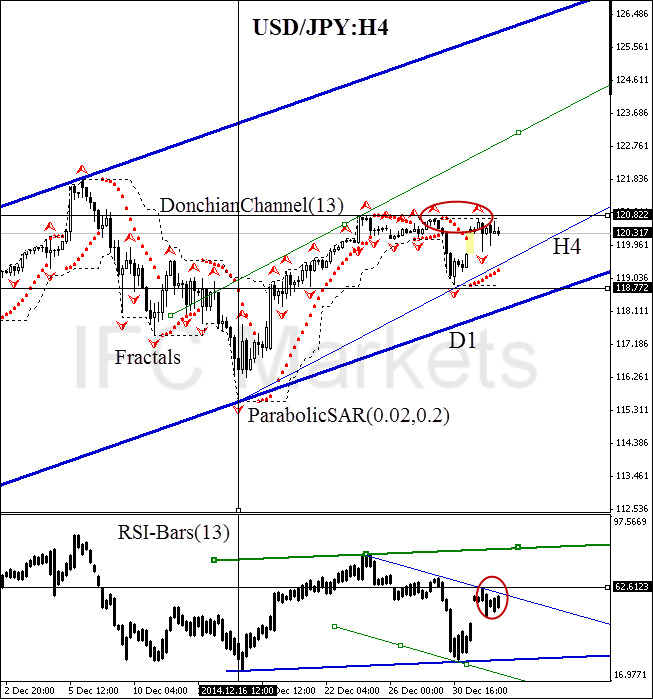
Today we consider USD/JPY currency pair on the H4 chart. Last week the markets reacted to the statement made by the ECB President Mario Draghi, who made it clear that the deflation possibility in the euro zone has increased. It means that the EU financial system is not adapted to new conditions which were settled after the crisis, so the financial recovery leader still remains to be the United States. After that, investors started to hedge risks, converting deposits into USD. This has resulted in greenback strengthening against the most liquid currencies, including the Japanese yen. However, the growth potential is not yet fully exposed: last week the yen tested the resistance for three times 120.822, without having a breakout. Along with that, a bullish gap and the ascending triangle appeared. The triangle was formed by the H4 support and resistance. Both signals indicate the bullish investor sentiment. ParabolicSAR historical values are moving along the trend line, confirming the price direction. We will wait for a new volatility momentum after the price crosses the double top pattern (marked in red ellipse). This level can be used for placing a pending buy order.
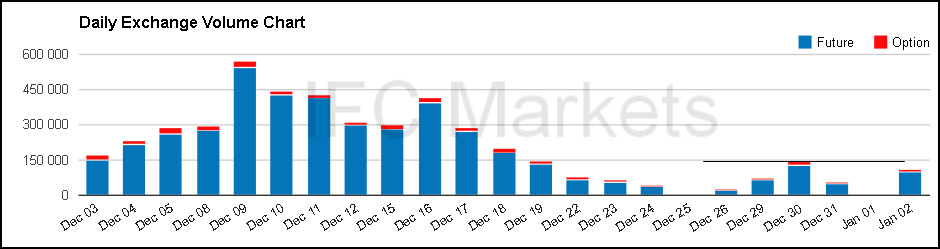
Conservative traders are also recommended to wait for the resistance line breakout of the RSI-Bars oscillator and the trading volume to reach above the local low. At the moment the market is recovering after holidays. The daily volume of contracts traded on the Chicago Mercantile Exchange has not yet outperformed 150000. We will expect this mark to be exceeded to confirm short-term trends on the H4 timeframe. To monitor the volumes click here.
Stop Loss can be placed at the fractal support 118.772. This mark is confirmed by the lower DonchianChannel boundary. In case of the channel breakout, after the position opening, Stop Loss is to be moved after the Parabolic values, near the next fractal low. Updating is enough to be done every day after a new Bill Williams fractal formation (5 candlesticks). Thus, we are changing the probable profit/loss ratio to the breakeven point.
| Buy Stop | above 120.822 |
| Stop Loss | below 118.772 |
Dear traders. For the detailed report of the strategy based on analytical issues of technical analysis click here.
Free Reports:
 Get Our Free Metatrader 4 Indicators - Put Our Free MetaTrader 4 Custom Indicators on your charts when you join our Weekly Newsletter
 Get our Weekly Commitment of Traders Reports - See where the biggest traders (Hedge Funds and Commercial Hedgers) are positioned in the futures markets on a weekly basis.
Market Analysis provided by IFCMarkets