By IFCMarkets
Expecting bullish momentum
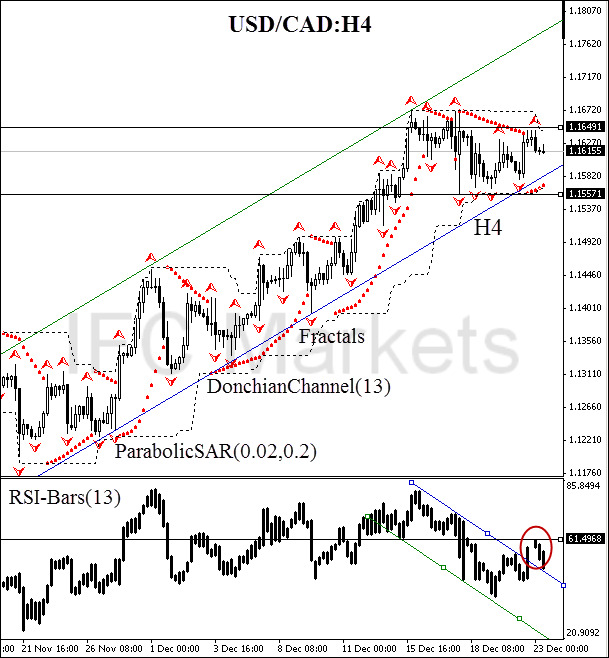
Here we consider the USD/CAD on the H4 chart. The price is consolidated in the sideways and is preparing for a new bullish momentum. ParabolicSAR historical values are moving along the H4 trend line. There was also an important technical signal on the part of the RSI-Bars oscillator: its values indicated a valid reversal and returned back to the bearish resistance line. We expect the next bar would cross the oscillator resistance line at 61.4968% and it will coincide with the price breakout at 1.16491. Note that this mark is confirmed by the Bill Williams fractal and the upper Donchian Channel boundary. The mark can be used for opening a pending buy order with Stop Loss placed below the support line at 1.15571, which crosses the H4 trend line.
After position opening, Stop Loss is to be moved after the Parabolic values, near the next fractal low. Updating is enough to be done every day after a new Bill Williams fractal formation (5 candlesticks). Thus, we are changing the probable profit/loss ratio to the breakeven point.
| Position | Buy |
| Buy stop | above 1.16491 |
| Stop loss | below 1.15571 |
Dear traders. For the detailed report of the strategy based on analytical issues of technical analysis click here.
Market Analysis provided by IFCMarkets
Free Reports:
 Get Our Free Metatrader 4 Indicators - Put Our Free MetaTrader 4 Custom Indicators on your charts when you join our Weekly Newsletter
 Get our Weekly Commitment of Traders Reports - See where the biggest traders (Hedge Funds and Commercial Hedgers) are positioned in the futures markets on a weekly basis.