By IFCMarkets
OPEC: dollar appreciation
The fallen oil futures prices after the OPEC meeting resulted in a significant depreciation of commodity currencies against the US dollar: it was in favour of USD and led to a significant strengthening of the dollar index. Today at 14:00 CET we expect the monthly release of ISM Manufacturing PMI in the United States. This diffusion index is based on a survey of 400 purchasing managers in the manufacturing industry, which evaluate employment, output volume, orders and stockpiles. It is the most important economic indicator as it permits obtaining preliminary information on manufacturing activity which affects the investor optimism. In our opinion, the greatest volatility is expected today from the US currency relative to other liquid instruments of the currency market.

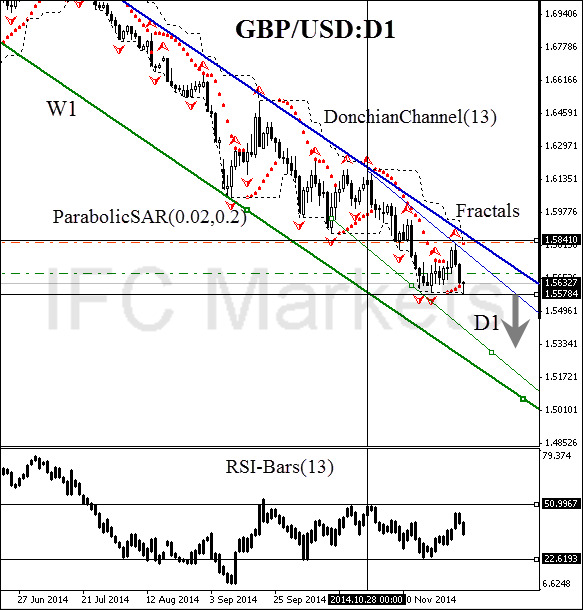
Here we consider the GBP/USD currency pair on the D1 chart. The price is preparing to move in the direction of the red zone, as evidenced by the Parabolic reversal. The fractal resistance level at 1.58410 is crossing the daily bearish trend line, which makes this mark suitable for reliable risk mitigation of a short position. This level is also confirmed by the upper Donchian Channel boundary. A pending sell order can be placed below 1.55784, which is confirmed by Parabolic historical values and the Bill Williams fractal. Conservative traders are recommended to look for the RSI-Bars support level breakout at 22.6194%. This signal must confirm the opening of a pending order. We can see the volume of futures traded on Chicago Mercantile Exchange outperformed the highest level of 125000 contracts: the downtrend is likely to maintain. The trading volume confirms the birth of a new trend.

After position opening, Stop Loss is to be moved after the Parabolic values, near the next fractal high. Updating is enough to be done every day after a new Bill Williams fractal formation (5 candlesticks). Thus, we are changing the probable profit/loss ratio to the breakeven point.
| Position | Sell |
| Sell stop | below 1.55784 |
| Stop loss | above 1.58410 |
Dear traders. For the detailed report of the strategy based on analytical issues of technical analysis click here.
Free Reports:
 Get Our Free Metatrader 4 Indicators - Put Our Free MetaTrader 4 Custom Indicators on your charts when you join our Weekly Newsletter
 Get our Weekly Commitment of Traders Reports - See where the biggest traders (Hedge Funds and Commercial Hedgers) are positioned in the futures markets on a weekly basis.
Market Analysis provided by IFCMarkets