By IFCMarkets
Here we consider the XAUUSD (Gold) futures contract on the H4 price chart. The price was moving in the daily retracement before an unsteady balance of bears and bulls was formed (see the triangle on the chart). The last candlestick breached the H4 trend line downwards. However, there was no confirmatory signal on the part of the RSI-Bars oscillator.
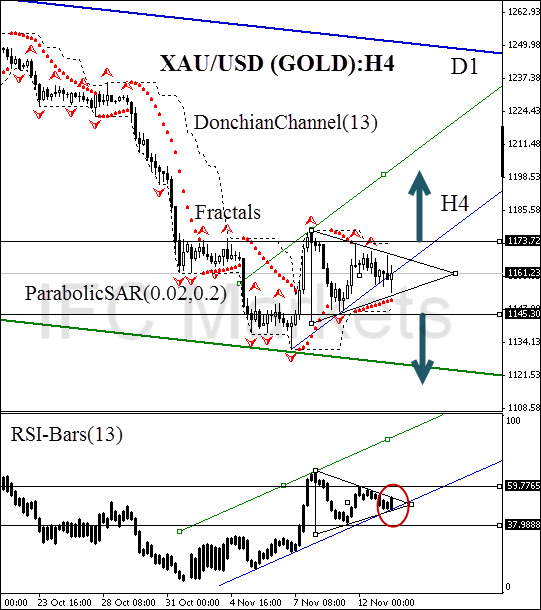
The market is looking for equilibrium. In this case, two opposing orders can be opened on the basis of the resistance level at 1173.72 and the support level at 1145.30. Both marks are confirmed by the DonchianChannel boundaries, Parabolic historical values and Bill Williams fractals. After one of the orders was executed, the second one can be deleted. Let the market choose the price direction.
After position opening, Stop Loss is to be moved after the ParabolicSAR values, near the next fractal high (short position) or fractal low (long position). Thus, we are changing the probable profit/loss ratio to the breakeven point.
| Position | Sell |
| Sell stop | below 1145.30 |
| Stop loss | above 1173.72 |
| Position | Buy |
| Buy stop | above 1173.72 |
| Stop loss | below 1145.30 |
Dear traders. You can see the detailed report of the author’s account by clicking here.
Market Analysis provided by IFCMarkets
Free Reports:
 Get Our Free Metatrader 4 Indicators - Put Our Free MetaTrader 4 Custom Indicators on your charts when you join our Weekly Newsletter
 Get our Weekly Commitment of Traders Reports - See where the biggest traders (Hedge Funds and Commercial Hedgers) are positioned in the futures markets on a weekly basis.