By Chris Vermeulen – TheGoldAndOilGuy.com
Since July of 2014 the big cap stocks have continued to make new highs as investors dump more and more money into the stock market. Overall bullishness on the stock market is now at extremely high levels which typically happen before a major stock market correction and sometimes start a full blown bear market.
While the average investor continues to become more and more bullish, the market breadth/health has been rapidly deteriorating. Unless you are market savvy you would not know how weak the market actually is and this always leads to strong losses and drawdowns for the uninformed investor.
What we know and most do not about this rising market, is that the big cap stocks in the SP500 index appear to be holding the overall market up and masking the weakness. So as investors become more bullish at these lofty levels putting more money into generic funds that push the SP500 higher, we see strong selling and unwinding of the more leveraged position like small cap stocks.
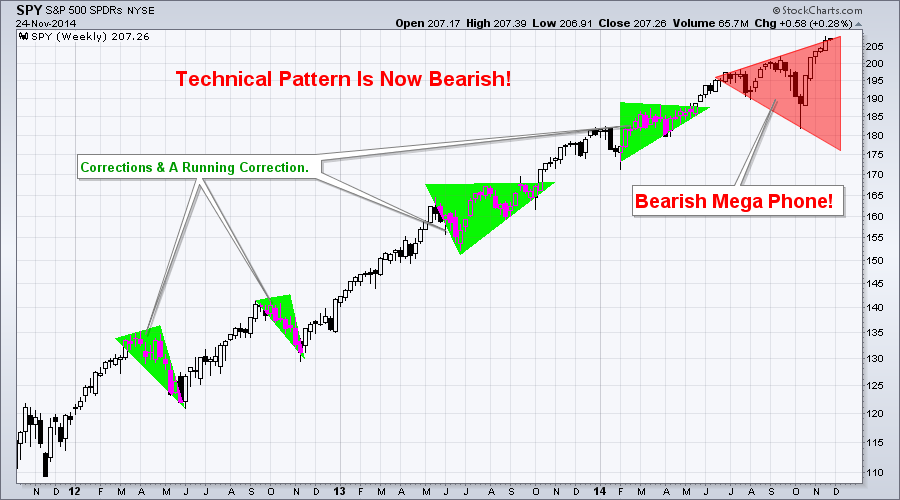
Over the past couple years the SP500 has formed a series of bullish corrections and running corrections. But the current formation is that of a bearish mega phone pattern and these typically point to lower prices.
SP500 BIG CAP STOCKS:
Free Reports:
 Get Our Free Metatrader 4 Indicators - Put Our Free MetaTrader 4 Custom Indicators on your charts when you join our Weekly Newsletter
 Get our Weekly Commitment of Traders Reports - See where the biggest traders (Hedge Funds and Commercial Hedgers) are positioned in the futures markets on a weekly basis.
THE BOLD STOCKS:
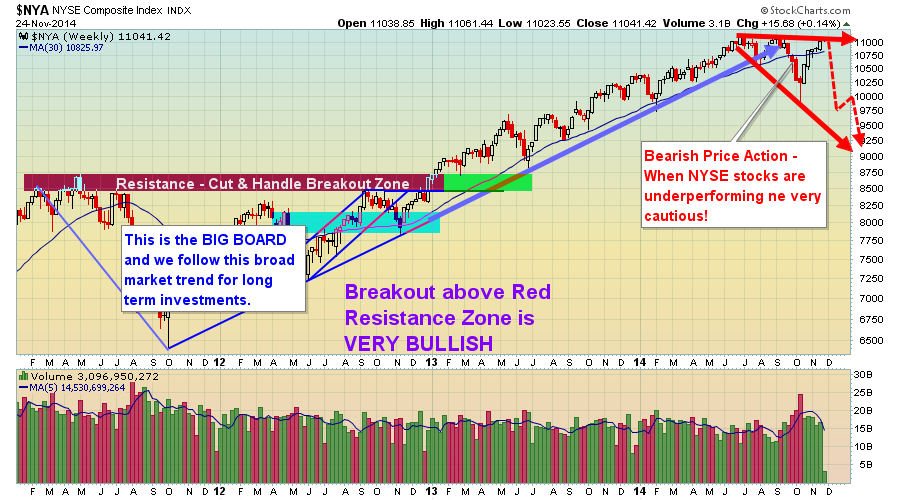
I have always liked to follow the NYSE index because its a basket of 1900 stocks with 1500 of them being U.S companies. Its breadth/strength makes it a much better indicator of the market performance than the more narrow indexes with less stocks.
While this index remains in a bull market, it only looks as though it’s a few months away from a possible reversal and confirmation of a new bear market.
THE UGLY:
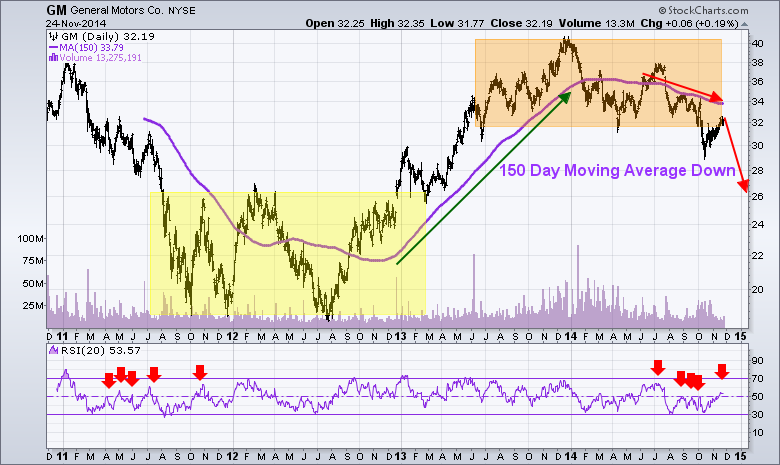
If you have ever read Stan Weinstein’s book then you know he followed GM share price closely. He believed that what GM did, the stock market would follow, to some extent. GM was/is an early leader of the US economy and stock prices in general.
The chart below paints a clear picture of the Stage 1 Accumulation in 2011- 2012, and also of the Stage 3 Distribution phase in 2013 – 2014. GM shares have traded down literally from the first week of the year and have now broken below critical support. Things could get interesting…
MY TRADING CONCLUSION:
In short, I remain bullish on the stock market with both my short term and investing outlook but I am very cautious and have closed out several large positions recently. Cash is king and I plan to protect, rather than invest my nest egg when risk is higher than normal.
Short term trading where trades only last 3-10 days is the way to go at this stage of the game. Some recent winning ETF trades with my ETF newsletter www.TheGoldAndOilGuy.com have been in SCO, a quick bounce trade in UCO, REM, and our current trade as of last week EEM.
The majority of my investment capital is traded with my automated trading system. It trades the S&P500 index directly in my brokerage account catching these 3-10 day swings in the market saving me time while reducing my emotional attachment to the market.
Chris Vermeulen


