By IFCMarkets
Good afternoon, dear traders. Today we consider XAU/USD (Gold) on the daily chart.

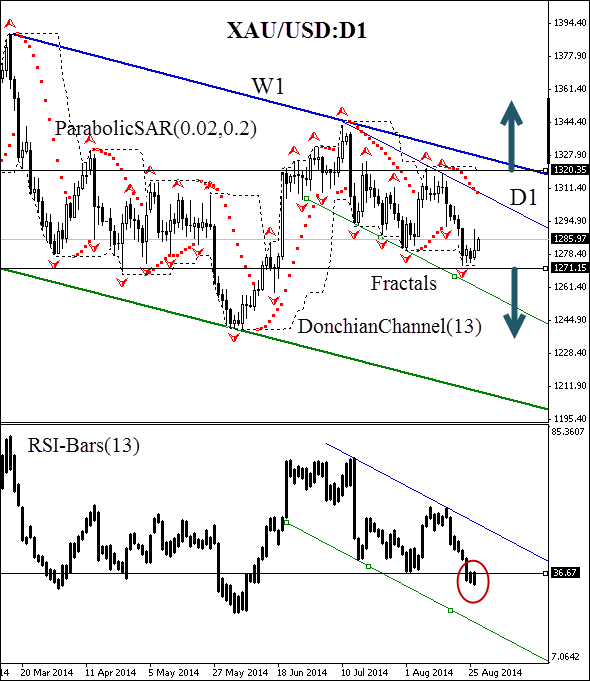
At the moment, the price is moving within the daily and weekly downtrends. Parabolic SAR confirms the bearish direction of the gold market. There is no contradiction on the part of RSI-Bars leading oscillator. There was a support breach of the indicator at 36.67%, and this is why we would expect the price to overcome the mark of 1271.15. This level is confirmed by Parabolic SAR historical values and the lower Donchian Channel boundary. The price support at 1271.15 can be used to open a pending sell order. Risks should be limited at 1320.35, this mark is confirmed by both indicators and the bearish trend line.

The daily volumes of futures and options traded on the Chicago Mercantile Exchange are presented on the chart above. We can see that at the moment the situation is vague. It is necessary to get an additional confirmation to confirm the price trend, for example overcoming the critical level of 200,000 contracts. You can monitor the trading volumes for gold futures by clicking here.
Little probable, but possible the trend to reverse, due to unforeseen fundamental factors, especially the US-EU-Russia conflict aggravation. In this case, a new bearish momentum is possible to happen: a long position is to be opened above the new support at 1320.35. This mark intersection would mean the weekly bearish channel destruction, which gives the first signal of the trend reversal. After position opening, Trailing Stop is to be moved after the ParabolicSAR values, near the next fractal trough (long position), or peak (short position). Thus, we are changing the probable profit/loss ratio to the breakeven point. As soon as the breakeven point is achieved, the opposite order is to be closed.
| Direction | down |
| Sell stop | below 1271.15 |
| Stop loss | above 1320.35 |
| Direction | up |
| Buy stop | above 1320.35 |
| Stop loss | below 1271.15 |
Dear traders. You can see the detailed report of the author’s account by clicking here.
Free Reports:
 Get Our Free Metatrader 4 Indicators - Put Our Free MetaTrader 4 Custom Indicators on your charts when you join our Weekly Newsletter
 Get our Weekly Commitment of Traders Reports - See where the biggest traders (Hedge Funds and Commercial Hedgers) are positioned in the futures markets on a weekly basis.
Market Analysis provided by IFCMarkets