By IFCMarkets
Good day, dear traders. Today in the afternoon we expect the release of two US macroeconomic indicators: Unemployment Claims (14:30, CET) and Pending Home Sales m/m (16:00, CET). The first indicator is calculated on the weekly data basis, which is collected by the U.S. Department of Labor and published in a weekly report. Unemployment Claims indicator allows estimating the domestic demand dynamics, as well as the consumer lending capacity to stimulate the U.S. economy. Pending Home Sales is calculated by the National Association of Realtors and shows changes in the number of contracts, signed but not paid for the month. The indicator is a harbinger of the New Home Sales and has a multiplicative impact on the financial sector (mortgage), secondary consumer goods (industry and trade) and high-tech goods (IT). Both indicators can significantly influence U.S. currency in relation to the other liquid instruments of FX.

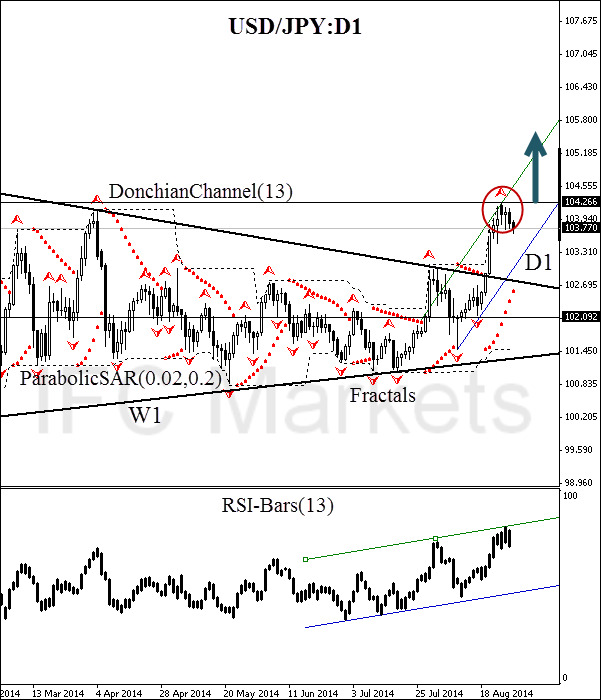
Here we consider the USD/JPY behavior on the D1 chart. The price entered the green zone outside the weekly triangle – the first sign of a new trend birth. ParabolicSAR confirms the trend direction; moreover its current value lies in the region of the triangle upper side. There is no contradiction on the part of RSI-Bars, which signal has already formed the growing channel. At the moment the price fractal resistance has been formed at 104.266. Once this happens, a pending buy order can be placed above this level. Currently, the mark is confirmed by the upper DonchianChannel boundary (13). The preliminary risk limitation is recommended to be placed below the last resistance at 102.092. This level is confirmed by the Bill Williams’s fractal and D1 trend line.
Note that the Japanese Yen trading volumes confirm the new trend formation. The daily volumes of futures and options traded on the Chicago Mercantile Exchange are presented on the chart above. We can see that currently the volumes increase and approach to a new top. We will expect the final trend confirmation after overcoming a new high of 100,000 contracts. You can monitor the trading volumes for this currency pair by clicking here.

After position opening, Trailing Stop is to be moved after the ParabolicSAR values, near the next fractal trough. Thus, we are changing the probable profit/loss ratio to the breakeven point.
| Position | long |
| Buy stop | higher then 104.266 |
| Stop loss | lower then 102.092 |
Dear traders. You can see the detailed report of the author’s account by clicking here.
Free Reports:
 Get Our Free Metatrader 4 Indicators - Put Our Free MetaTrader 4 Custom Indicators on your charts when you join our Weekly Newsletter
 Get our Weekly Commitment of Traders Reports - See where the biggest traders (Hedge Funds and Commercial Hedgers) are positioned in the futures markets on a weekly basis.
Market Analysis provided by IFCMarkets