USDCAD Forex Technical Analysis July 23, 2014
By IFCMarkets
Good afternoon, dear traders. Today, one of the key events of this afternoon is the Core Retail Sales release, published by Statistics Canada. The indicator reveals the volume change of all goods sold by retailers, based on a sample of retail stores. Resulting values do not include sales of such volatile component as cars, which make 20% of total sales. The Core Retail Sales index defines consumer confidence and willingness of investors to invest in the development of retail networks and new productions. That is why the indicator release may lead to considerable momentum of the Canadian relative to the most liquid currencies.


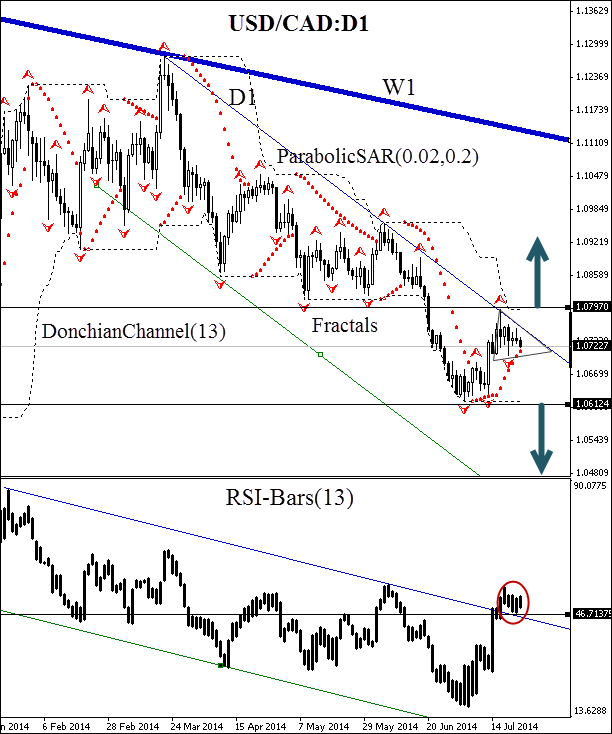
Here we consider the USD/CAD behavior on the daily chart. Large-scale movement direction is determined by the daily and weekly downtrend channels. However, at the moment a local consolidation in the triangle area is observed (marked on the chart), which is confirmed by the price intersection with the ParabolicSAR trend indicator signal. You should pay attention to the upward intersection of RSI-Bars oscillator trendline. This signal is a warning of a possible bearish price reversal, as the most correct leading signals are received from the oscillators in the consolidation area.
Thereby, a bearish sentiment continuation signal will only come out after the downward oscillator support breach at 46.71375. It is expected that the event onset coincides with the fractal price mark intersection at 1.06124, which is considered to be the beginning of selling. This level is confirmed by ParabolicSAR historical values, as well as the PivotPoints channel support. It is reasonable to place risk limitation at the resistance fractal level of 1.07970, which is also confirmed by historical values of both indicators.
This mark may be considered as a position for opening a pending buy order. An order execution will lead to further RSI-Bars signal growth. Stop Loss can be placed at the opposite key level of 1.06124. After position opening, Trailing Stop is to be moved after the ParabolicSAR values, or near the next fractal peak (short position) or trough (long position). Thus, we are changing the probable profit/loss ratio to the breakeven point.
| Direction | down |
| Sell stop | below 1.06124 |
| Stop loss | above 1.07970 |
| Direction | up |
| Buy stop | above 1.07970 |
| Stop loss | below 1.06124 |
Market Analysis provided by IFCMarkets
Free Reports:

