Could the Gold Standard Be Making a Comeback?

By MoneyMorning.com.au

We’ve been fans of gold for a long time. And in the current climate of fear over defaults and money printing, we expect to be fans for a while.

Even although its value has soared in the past decade or so, it still lacks status as a ‘mainstream’ asset. Talk to a banker or a money manager about it even now, and they might still regard you as a crank.


The fact remains that one of the biggest drivers of gold demand has been retail investors in Asia – not Wall Street. And central banks, as a group, have been net sellers of gold over the past ten years.

However, this may be set to change. The FT recently pointed out that bankers have been quietly lobbying to be allowed to treat gold holdings as core capital. And JP Morgan has accepted gold as collateral since last year.

This has led some to claim that gold is about to enter the investment mainstream. There is even renewed talk about a return to a new gold standard. Is this justified, or likely? Or is it a sign that gold is getting too popular?

Basel Could Be the Tipping Point

Let’s go back to the financial crisis for a moment. After the 2008-9 crash, there were concerns that banks had too little capital. This meant that even small losses, or even a need to raise funds quickly, could threaten them with going bust.

As a result, rules – the so-called Basel III framework – have been agreed that require the banks to hold safer, more liquid assets. These rules, agreed globally, will be phased in between 2015 and 2018.

However, there has been disagreement over what type of asset should be considered ‘safe’. Some assets, such as cash, and US Treasury bills (T-bills), are obvious. However, others are less clear.

Currently gold is not on the list, which means that banks will have to set aside more capital if they want to hold it. However, this may change. If it does, banks will be able to hold more gold. It will also be a seal of approval for it as an asset. This should boost demand for gold – and lead to an increase in prices.

Could This Be the Start of a New Gold Standard?

Some argue that this process may also turn gold into the main global currency. Professor Lew Spellman of the University of Texas at Austin thinks that China is trying to boost the status of the yuan, for example, by backing it with gold. His view is that this will force other countries and banks to follow suit.

Over time, he predicts that all major international transactions will be with – or backed by – gold. This will create a new standard where all currencies are fixed to each other through their link with gold.

This is certainly a bold view. I’ve also just read John Butler’s, The Golden Revolution: How to Prepare for the Coming Gold Standard, where he sets out some ways that this could take place.

However, even if gold does become the global reserve currency there is no reason why national governments would have to link to it. After all, the pound floats free of the dollar. If there is one thing that we’ve learned from the euro crisis (and the failures of the Exchange-Rate Mechanism and Bretton Woods), it is that independent national currencies are an important safety valve for economies.

If you are cynical, you might think that all this coverage means it is time to sell. Certainly, the last serious attempt to look at a new gold standard, the 1981 Gold Commission, coincided with historic peaks in gold prices.

However, we are nowhere close to this stage as yet. Gold may not be the outcast that it was in the early part of this decade, but it is only now entering the mainstream. For now, the fact that more banks might be tempted to buy it can only be good news for investors in gold.

Matthew Partridge
Contributing Writer, MoneyWeek (UK)

Publisher’s Note: This article originally appeared in MoneyWeek (UK)

From the Archives…

Small Caps – A Way to Bet on Developing Markets…Without Investing Overseas
2012-04-013 – Kris Sayce

All Transactions to be Conducted in the Presence of a Tax Collector
2012-04-12 – Simon Black

How You Can Use Government Intervention to Profit on the Stock Market
2012-04-11 – Kris Sayce

Australia – The Pacific Pawn in USA Versus China
2012-04-10 – Dr. Alex Cowie

If Ron Paul Were US President…
2012-04-09 – Mark Tier


Could the Gold Standard Be Making a Comeback?

Military Spending by Country

By The Sizemore Letter

With outstanding U.S. debt fast approaching 100% of GDP and budget deficits continuing to yawn stubbornly wide, the next president and congress will have some unpleasant decisions to make.  Spending will have to be cut.  But from where?

Social Security and Medicare will come under debate, as will most discretionary spending.  But the elephant in the room that no one wants to acknowledge is the U.S. military (see figure).

Top 10 Countries by Military Spending, 2011

Country

Spending, $bn

World Share, %

United States

739.3

45.7

China

89.8

5.5

Britain

62.7

3.9

France

58.8

3.6

Japan

58.4

3.6

Russia

52.7

3.3

Saudi Arabia

46.2

2.9

Germany

44.2

2.7

India

37.3

2.3

Brazil

36.6

2.3

Source: The Economist, April 7, 2012

The United States currently accounts for nearly half of all world military spending. Its military budget is more than eight times that of China and fourteen that of Russia.

The United States requires a large, muscular military to defend its economic and diplomatic  interests abroad.  Having a powerful army and (more importantly) navy is essential to maintaining credibility.  But during times of economic austerity, unpopular questions of “how big is enough” will start to be asked.

The automatic spending cuts that were part of the grand bargain between Barack Obama’s White House and the Republican-controlled House hit the military budget hard.  In an election year, neither party will want to see them implemented.

But once the election is over, even the most hawkish of republicans will have to accept that sacred cows like the military will have to be touched if the United States is to get its finances under control.  And with a smaller military, expect a more modest foreign policy.  It’s a whole new world, dear reader.


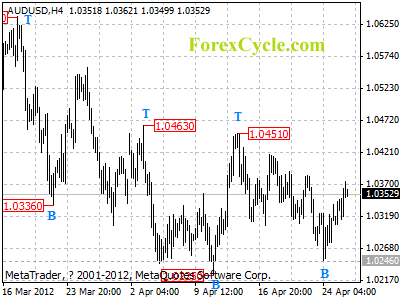
AUDUSD rebounded from 1.0246

Being contained by 1.0225 support, AUDUSD rebounded from 1.0246, suggesting that a cycle bottom has been formed on 4-hour chart. Further rise to test 1.0463 key resistance would likely be seen, a break above this level will signal completion of the downtrend from 1.0855. However, as long as 1.0463 level holds, the price action from 1.0225 is treated as consolidation of the downtrend, and one more fall to 1.0000 is still possible after consolidation.

audusd

Forex Signals

Crude Oil Climbs To 1-Week High

Source: ForexYard

printprofile

Crude oil climbed to a one-week high after policy makers at the Federal Reserve mentioned that they speculate growth to move ahead at an accelerated pace. The rise comes after the commodity dropped as supplies in the U.S gained as well as a comment made by Iran’s envoy in Moscow claiming that the nation is discussing a proposal to delay the expansion of its nuclear program.

Crude for June Contract apppreciated 0.5 percent to $104.11 per barrel around approximately 2pm New York time. The commodity reached its highest level since April 17 after touching 104.57 a barrel. So far for the year, Crude Oil prices have appreciated 5.3 percent.

Wednesday saw the release of the weekly Crude Oil Inventories report which produced higher figures than expected. Crude Inventories climbed 3.98 million barrels to reach 373 million in the previous week as output appreciated to a 12-year high.

Forex Market Analysis provided by ForexYard.

© 2006 by FxYard Ltd

Disclaimer: Trading Foreign Exchange carries a high level of risk and may not be suitable for all investors. There is a possibility that you could sustain a loss of all of your investment and therefore you should not invest money that you cannot afford to lose. You should be aware of all the risks associated with Foreign Exchange trading.

Pound Drops As U.K Falls Into New Recession

Source: ForexYard

printprofile

The British Pound saw its biggest decline in two months against the Euro as statistics indicate the UK has officially gone into another recession. The sterling also slid from a seven-month high versus the U.S dollar after GBP Gross Domestic Product Figures showed 0.2 percent drop for the first three months of 2012.

Despite the sharp slide of the Sterling, according to Bloomberg Correlation-Weighted Indexes,the British currency has grown 1.5 percent in the past month, which indicates the currency to be the best performer among the 10 developed nation currencies.Elsewhere the 17-nation currency fell 0.8 percent whilst the greenback showed a 0.2 percent decline in the past month.

In order for a nation to fall into a recession,Gross Domestic Product figures need to be on the decline for two consecutive quarters. Prior to the 0.2 percent drop for the first quarter of the year, the previous GDP figures also indicated a 0.3  percent drop.

Forex Market Analysis provided by ForexYard.

© 2006 by FxYard Ltd

Disclaimer: Trading Foreign Exchange carries a high level of risk and may not be suitable for all investors. There is a possibility that you could sustain a loss of all of your investment and therefore you should not invest money that you cannot afford to lose. You should be aware of all the risks associated with Foreign Exchange trading.

Two Long-Term Investing Strategies That Work (and one that doesn’t)

Article by Investment U

Two Long-Term Investing Strategies That Work (and one that doesn't)

Don’t be lazy and hand your hard-earned money over to a mutual fund manager who will likely not do as good a job as you or a passive index fund will.

This weekend, as I was driving back from picking up groceries, I was listening to a financial radio talk show. I wasn’t particularly impressed with the host to start with, but then he offered some advice that was so horrible it nearly caused me to veer off the road and into a ditch. He suggested that a caller not invest in stocks because when you buy a stock, someone smarter than you is the person who is selling it.

Instead, he suggested only investing in mutual funds. Keep in mind, he’s a financial advisor who specializes in mutual funds, so we know where his bias is.

After a few minutes more of listening to the program, I had to turn it off in favor of my daughter’s insipid Kidz Bop CDs. Anyone who followed the host’s advice might as well just flush their money down the toilet.

Here’s why.

Most mutual funds underperform the market. In 2011, 84% of stock mutual funds did not beat the broad market or their benchmark index (if a fund is focused on a particular sector like technology or a region like Europe, it will have a different index that it’s expected to beat other than the S&P 500).

Last year was a particularly bad one for mutual fund managers. Normally, the results aren’t quite as dismal. Over the past 10 years, 57% of funds underperformed their benchmark.

To make the radio host’s argument even more laughable, he said those “smart” traders on the other side of the stock trades included many mutual fund managers who did this for a living.

So you should be scared of buying stock from people who are bad at their jobs? Forget that. Where do I sign up to buy from them?

The weak performance of mutual funds doesn’t mean you should avoid all mutual funds. They’re appropriate for investors who don’t like to pick their own stocks and don’t want to put much effort into their portfolio other than asset allocation. But be sure you don’t chase a hot mutual fund because it posted strong performance numbers or has a popular manager.

Instead, invest in index funds with low expense ratios. If you’re investing in index funds, you’re basically just trying to match the market averages. There’s nothing wrong with that. The market goes up over the long haul and if you’re matching the market’s performance, you’ll make money.

If you’re investing in mutual funds, consider the funds in Alexander Green’s Gone Fishin’ Portfolio. These are funds like the Vanguard Emerging Markets Index Fund (VEIEX). The fund has a very low 0.33% expense ratio and has returned an average of 13.11% per year over the past 10 years.

The key to the funds in The Gone Fishin’ Portfolio are the very low fees. Many actively managed funds have significantly higher costs. Usually at least 1% and sometimes much more. That means each year 1% or more of your money is going to the mutual fund company to pay for salaries, toner and Christmas parties. That money is better off in your pocket and the lower fees will improve your returns over the years.

This doesn’t mean that there are no quality mutual funds or managers who will generate solid returns for you – but with six out of 10 fund managers underperforming the market every year, are you really good enough to pick the right one every year? I’m not. That’s why most of my mutual fund holdings are in the funds recommended in The Gone Fishin’ Portfolio – inexpensive funds that are designed to simply match the market returns.

But I don’t put all of my money in those funds. I pick stocks, too. And I’ll match wits with those fund managers any day of the week. It’s not that I’m so smart and they’re so dumb. But as an individual investor, I have opportunities that they don’t.

Individual Investor Advantages

For example, a stock I like that’s currently in The Oxford Club’s Perpetual Income Portfolio is Community Bank System (NYSE: CBU). It’s a small bank located in upstate New York and Pennsylvania. It has a market cap of just over $1 billion and trades an average of 244,000 shares a day.

I like it because it never took a dime of TARP money, pays a 3.6% dividend yield (4.7% based on our entry price in September) and has raised the dividend every year for 19 years.

With just 244,000 shares traded per day, a large mutual fund would have difficulty buying large blocks of stock without moving the share price significantly. As an individual investor, you would have no problem picking up a few thousand shares on any given day.

Also, as an individual investor, you don’t have to worry about marketing. You’re not trying to impress anyone with which stocks you own or trying hard to beat a benchmark. However, a mutual fund, particularly one that isn’t outperforming, better have some of the hottest stocks in its portfolio at the end of the quarter, when its portfolio is revealed, otherwise, as Ricky Ricardo used to say, they’ll have some “’splainin’ to do.”

Additionally, they’ll get rid of their dogs. The fund companies don’t want investors pulling their money (which reduces fees collected) because investors think the fund managers are asleep on the job. But buying hot stocks and dumping beaten up ones is usually the wrong thing to do.

If the fund manager has done his homework and likes a stock because of its prospects and/or value, selling it because it sold off and is cheap isn’t going to help investors in the long run. He should be buying. And similarly, if a stock is hot and is a momentum trade, buying it after it’s popular is also misguided, as it may be difficult to sell so many shares from a big fund when the music stops.

Individual investors have more flexibility than the big guys. You don’t have to publish quarterly reports that will be scrutinized and you can get in and out of stocks whenever you want, without fear of moving the price. You can also switch your strategy at any given time.

If you decide small caps look more attractive than large caps, you can move some of your assets between the two groups, whereas a large cap fund manager is stuck in large caps, no matter how the group is performing.

Even if you’re an investor who doesn’t want to actively manage your money, don’t be lazy and hand it over to a mutual fund manager who will likely not do as good a job as you or a passive index fund will. Pick some great stocks that you expect to hold for the long term, or buy the funds mentioned in The Gone Fishin’ Portfolio. You’ll save a ton of money in fees and likely do a better job than the fund managers do. It would be hard to do worse.

Good Investing,

Marc Lichtenfeld

P.S. I mentioned the Vanguard Emerging Markets Index earlier. If you’re planning on investing in emerging markets, be sure to check out Where In the World Should I Invest? by my friend and colleague Karim Rahemtulla. I had the privilege of reading an early draft. I don’t often describe investing books as a page-turner, but this one is so informative and funny, you’ll have a hard time putting it down.

Article by Investment U

Canadian Dollar Rises to 7-Month High Versus U.S Dollar

Source: ForexYard

printprofile

The Canadian Dollar appreciated to a seven-month high versus its currency counterpart, the U.S dollar.The rise of the “loonie” was a result of speculation that the global growth outlook is on the mend,boosting  prospects for Canada’s exports.

The Canadian currency has strengthened against 15 of its 16 major currency counterparts, except for the Japanese Yen.The CAD is heading towards a 1.6 percent climb against the ’safe haven’ U.S dollar for the month of April.

The Canadian dollar reached the strongest level since September after hitting 98.23 cents per U.S dollar before climbing to 98.34 which was a 0.4 percent rise.

Governor of the Bank of Canada Mark Carney is expected to deliver a speech on Friday. The Governor has the biggest influence on the nations currency value and therefore the outcome of the speech could result in a short term positive or negative trend.

Forex Market Analysis provided by ForexYard.

© 2006 by FxYard Ltd

Disclaimer: Trading Foreign Exchange carries a high level of risk and may not be suitable for all investors. There is a possibility that you could sustain a loss of all of your investment and therefore you should not invest money that you cannot afford to lose. You should be aware of all the risks associated with Foreign Exchange trading.

J-Charts: The Next Evolution of Technical Analysis

Article by Investment U

J-Charts: The Next Evolution of Technical Analysis

An investor armed with some serious mathematical and scientific ammo has an edge over the competition. Which is why I’m sharing J-charts with you…

It shouldn’t surprise anyone that the analysis itself is becoming more mathematical and/or scientific. But that doesn’t make it more attractive to average investors. People are still going to prefer the easier methods of “going with the gut” or simply hiring an advisor.

But an investor armed with some serious mathematical and scientific ammo has an edge over the competition. Which is why I’m sharing J-charts with you…

Although technical analysis has been around since the nineteenth century, economists and most fundamentalists are lukewarm to the “science.” The fact is, with the human emotional element involved, much of the science available is inexact.

So just like the scientist working on his or her hypothesis, technicians have been attempting to tweak aspects of charting in order to successfully predict price.

It was this chartists’ reliance in placing price action into specific time slots that John Chen took exception to. He was looking for a model that would express the dynamic nature of markets, which he likens to the thermodynamic process.

What the Heck is a Thermodynamic System?

While researching another subject, I came across two articles by Matt Blackman, the host of TradeSystemGuru.com. In these pieces, separated by eight years, he goes into detail of Mr. Chen’s epiphany by means of the software he created. I’m going to try to give you the highlights.

John Chen believed that alternating between periods of equilibrium and chaos, price seeks to find a new balance point after each trend, similar to going up (or down) sets of stairs separated by landings. When more buyers enter, prices move out of equilibrium and trend higher until a new equilibrium point is reached (the next landing of the stairs). This isn’t governed by time, but is totally price dependent.

What’s driving all this action?

Investor behavior.

Chen’s program, called J-Chart, plots price as a five-part Chinese “Jeng” or JE character
(Chinese “Jeng” or JE character). One part of the character plots each time a transaction occurs at a specific price, allowing the user of the program to determine the level of equilibrium at any given time.

Depending on your preference, any time period may be set and periods may be combined. Opening prices are plotted in yellow and closing prices for the period are plotted in cyan (I just call it turquoise because I don’t know better).

As price plots in a given frame, a triangle begins to form. If it’s top-heavy, like Figure 1 below, the part of the plot with indentations (or caves) will generally be filled in following sessions, unless the market is trending strongly in the opposite direction.

Figure 1 - Price plots in a J-Chart showing triangular formation from high (point of origin) to low (image point) with open (yellow) and close (cyan) and balance point (solid red line).

Figure 1 – Price plots in a J-Chart showing triangular formation from high (point of origin) to low (image point) with open (yellow) and close (cyan) and balance point (solid red line). Chart provided by J-Chart.com.

The point of origin is either the high or low where price plots occur. The image point in Figure 1 contains no price plots, making this formation top heavy and out of balance. If we were looking at the equilibrium, the high and low would be the same distance from the balance point (center), where the greatest number of price plots occur and the little characters would symmetrically fill the triangle outlined by the gray lines.

Equilibrium

This system is trying to let us see when the market is or is not in equilibrium. A market in perfect equilibrium would appear as an isosceles triangle turned vertical. But the assumption has to be made that efficient markets make sense. If you’ve looked over the market for just the past six months, you know that’s far from the truth. Prices respond by moving up too far in a bull run and then back down again when emotion ebbs.

Yet, even when they’re driven by strong investor sentiment, markets must obey certain energetic laws. Prices moving too quickly upward must at some point come back and fill the areas that have been missed. These show up on the J-Chart display as gaps (caves), narrow price activity, or unbalanced triangles (see Figure 2).

Figure 2 - Real price action showing double balance points and price vacuum or “cave” in the middle. The natural tendency is to fill this void in subsequent price action unless there is an overwhelming move either higher or lower. However, sooner or later, this price cave will have to be filled.

Figure 2 – Real price action showing double balance points and price vacuum or “cave” in the middle. The natural tendency is to fill this void in subsequent price action unless there is an overwhelming move either higher or lower. However, sooner or later, this price cave will have to be filled. Chart provided by J-Charts.

Price Forecasting

Price forecasting is achieved by using the J-Chart forecasting tool. Using two balance points, or an image or point of origin and subsequent balance point, a triangle is plotted by the program from which the trader can then draw a horizontal line forward (see Figure 1). And this forecasting ability is pretty cool. The program allows you to set your options as to what you can see depending on your investing objectives.

Stop losses are set using major balance points from prior days, past highs, or lows and at the horizontal blue lines plotted by the program showing significant support/resistance (Figure 1).

The trader also can use the previous day together with overnight price activity before the market opens on the trading day – trying to see if the market is still trending. Once the trading day begins – and with the intraday interval set – the trader watches everything unfold and sets new targets and stop losses as the market moves.

What to Take From This

There’s a lot of indicators and systems being churned out there in the marketplace that claim they are the best way to predict price. What sticks will be an equal combination of what has great marketing pizazz and then what works.

We’re looking at stock picking by means of science that most Americans don’t know about or want to understand. And this seems to be a trend. I think everyone needs to think about what they want from the market (and maybe you have several end games from investing). Either way, this is an available tool that gives you another way to discover trends – and that’s the whole point of technical analysis.

Good Investing,

Jason Jenkins

Article by Investment U

UK Government: Fracking Causes Earthquakes, but It’s Worth the Risk

The process of hydraulic fracturing is a mining technique which uses injected fluid to propagate fractures in a rock layer to release hydrocarbon deposits that would otherwise be uncommercial. Developed in the U.S. and first used in 1947 for stimulating of oil and natural gas wells, the use of “fracking” soared in the past decade as thousands of wells have been drilled into the Marcellus Formation, also referred to as the Marcellus Shale, a deposit of marine sedimentary rock found in eastern North America.

While initial environmental protests of the technique centered around its possibility of polluting underground water aquifers as a number of known carcinogenic substances are used in the procedure, more recently research has focused on an even more ominous byproduct of the technique – the increased possibility of earthquakes. While in the U.S. the U.S. Geological Survey and the state governments are investigating the link, in Britain the Department of Energy and Climate Change on 17 April published an independent expert report recommending measures to mitigate the risks of seismic tremors from hydraulic fracturing and invited public comment on its recommendations.

The report reviewed a series of studies commissioned by Cuadrilla, whose fracking operations in Lancashire aroused public debate, and the document “confirms that minor earthquakes detected in the area of the company’s Preese Hall operations near Blackpool in April and May last year were caused by fracking.” DECC’s Chief Scientific Advisor David MacKay remarked, “If shale gas is to be part of the UK’s energy mix we need to have a good understanding of its potential environmental impacts and what can be done to mitigate those impacts. This comprehensive independent review of Cuadrilla’s evidence suggests a set of robust measures to make sure future seismic risks are minimized – not just at this location but at any other potential sites across the UK.”

The report is certain to reopen debate about the Lancashire tremors, which on 1 April and 27 May 2011 shook the Blackpool area, registering 2.3 and 1.5 on the Richter Scale. On 2 November a report commissioned by Cuadrilla Resources, “The Geo-mechanical Study of Bowland Shale Seismicity,” acknowledged that hydraulic fracturing was responsible for the two tremors and possibly as many as fifty separate earth tremors overall, noting that it was “highly probable” that the hydraulic fracturing of its Preese Hall-1 well did trigger a number of “minor” seismic events.

At the time of the report’s release Cuadrilla Resources CEO Mark Miller said, “We unequivocally accept the findings of this independent report and are pleased that the report concludes that there is no threat to people or property in the local area from our operations. We are ready to put in place the early detection system that has been proposed in the report so that we can provide additional confidence and security to the local community. Cuadrilla Resources is working with the relevant local and national authorities to implement the report’s recommendations so we may safely resume our operations.”

The British Geological Survey also linked smaller quakes in the Blackpool area to fracking. BGS Dr. Brian Baptie said, “It seems quite likely that they are related,” noting, “We had a couple of instruments close to the site and they show that both events occurred near the site and at a shallow depth.”

While the DECC report confirms that Cuadrilla Resources ‘s test-fracking likely caused the 2011 two small tremors last year, it also said that Cuadrilla Resources could proceed with exploring the area if it follows a new set of expensive safety measures.

Cuadrilla Resources clearly sees the report as vindication, with Miller proclaiming, “We are pleased that the experts have come to a clear conclusion that it is safe to allow us to resume hydraulic fracturing, following the procedures outlined in the review. Many of today’s recommendations were contained in the original expert studies we published in November last year, and our supplementary information sent to DECC in January. We have already started to implement a number of the experts’ recommendations in the pursuit of best practice and look forward to the final decision by DECC ministers concerning the resumption of hydraulic fracturing following the six week period for public comment commencing on 17 April.”

And insurers in the City of London clearly believe that the DECC report validates fracking. City insurance brokerage Willis chief operating officer of global energy Neil Smith said, “Shale gas is here to stay… The issues are of a political nature and a lot are born out of ignorance of what the operations are.” Dominick Hoare of Watkins Syndicate at the Lloyd’s of London insurance market was equally bullish, saying, “With a proper assessment it’s a good risk to assume,” as was Matt Yeldham, the head of casualty at Aegis’ marine and offshore liability division, who commented, “Provided fracking is conducted in an appropriate fashion, it would appear on the whole to present a reasonable risk profile” before adding, “Underwriters are not there to cover long-term health hazard and other latent issues.”

It is precisely those “long-term health hazard and other latent issues” that should be at the top of the British government’s concerns, but Westminster has repeatedly proven that its interests more closely align with those investment bankers in the City of London than those forced to live with the consequences if the environmental nay-sayers ultimately prove correct about water pollution and “seismic events.”

Source: http://oilprice.com/Energy/Energy-General/UK-Govt.-Seismic-Fracking-Report-Certain-to-Sharpen-Debate.html

By. John C.K. Daly of Oilprice.com