USDJPY Forex Trading Pivot Point Levels for 2014.03.25

2014.03.25 12:30 6:30AM ET | USDJPY Currency Pair

SC USDJPY 2014.03.25

Here are the Pivot Points Levels with Support (S) and Resistance (R) for the USDJPY currency pair today. Price action is currently trading at the 102.227 price level and under the daily pivot point, according to data at 6:30 AM ET. The USDJPY high for the day has been 102.339 while the low of day has reached to 102.084. The pair earlier today opened the Asian trading session below the daily pivot and has trended sideways so far today with the daily pivot providing overhead resistance.

Daily Pivot Point: 102.325
— S1 – 102.012
— S2 – 101.806
— S3 – 101.493
— R1 – 102.531
— R2 – 102.844
— R3 – 103.050


Weekly Pivot Points: USDJPY

SC USDJPY 2014.03.25

Prices are currently trading over the weekly pivot point (102.06) at time of writing. The USDJPY has been on an overall sideways trend this week after opening the trading week modestly above the weekly pivot.

Weekly Pivot Point: 102.066
— S1 – 101.462
— S2 – 100.661
— S3 – 100.057
— R1 – 102.867
— R2 – 103.471
— R3 – 104.272


By CountingPips.comForex Trading Apps & Currency Trade Tools

Disclaimer: Foreign Currency trading and trading on margin carries a high level of risk and volatility and can result in loss of part or all of your investment. All information and opinions contained do not constitute investment advice and accuracy of prices, charts, calculations cannot be guaranteed.


Wave Analysis 25.03.2014 (DJIA Index, Crude Oil)

Article By RoboForex.com

Analysis for March 25th, 2014

DJIA Index

Index is still being corrected. It looks like wave [2] is taking the form of zigzag pattern. On minor wave level, market completed wave (B). Most likely, in the nearest future market will continue falling inside wave (C) of [2] and break latest minimum.

More detailed wave structure is shown on H1 chart. After finishing zigzag pattern inside wave (B), Index formed initial descending impulse. Probably, right now instrument is extending the third wave. Price may reach new minimum during the day.

Crude Oil

Oil is about to start strong descending movement inside wave 3. Earlier price completed initial impulse inside wave 1 and then formed correction inside the second one. I’ve got only one sell order so far, but I’m planning to increase my short position in the future.

As we can see at the H1 chart, wave 2 took the form of zigzag pattern. On minor wave level, market formed diagonal triangle pattern inside wave [C]of 2. Most likely, instrument will continue falling down inside wave [1].

RoboForex Analytical Department

Article By RoboForex.com

Attention!
Forecasts presented in this section only reflect the author’s private opinion and should not be considered as guidance for trading. RoboForex LP bears no responsibility for trading results based on trading recommendations described in these analytical reviews.


Junior Mining Stocks to Beat Previous Highs

By Laurynas Vegys, Research Analyst, Casey Research

Despite last week’s pullback, the precious metals market is off to an impressive start in 2014. Gold is up 10.6%, silver 4.3%, and the PHLX Gold/Silver (XAU) 17.1%. Gold, in particular, had a great February, rising above $1,300 for the first time since November 7, 2013.

This has led to some very handsome gains in our Casey International Speculator portfolio, with a few of our recommendations already logging triple-digit gains from their recent bottoms.

Why Junior Gold Mining Stocks Are Our Favorite Speculations

One of Doug Casey’s mantras is that one should buy gold for prudence, and gold stocks for profit. These are very different kinds of asset deployment.

In other words, don’t think of gold as an investment, but as wealth protection. It’s the only highly liquid financial asset that is not simultaneously someone else’s obligation; it’s value you can liquidate and use to secure your needs. Possessing it is prudent.

Gold stocks are for speculation because they offer leverage to gold. This is actually true of all mining stocks, but the phenomenon is especially strong in the highly volatile precious metals.

Most typical “be happy you beat inflation” returns simply can’t hold a candle to stocks that achieved 10-bagger status (1,000% gains). In previous bubbles—some even generated 100-fold returns. And we may see such returns again.

It’s Not Too Late to Make a Fortune

Here’s a look at our top three year-to-date gainers.

What’s especially remarkable is that all three of these stocks shot up much more than gold itself, on essentially no company-specific news. This is dramatic proof of just how much leverage the right mining stocks can offer to movements in the underlying commodity—gold, in this case. Two of the stocks above are on our list of potential 10-baggers, by the way.

So have you missed the boat? Is it too late to buy?

Looking at the chart, two bullish factors jump out immediately:

  • Gold stocks have just now started to move up from a similar level in 2008.
  • Gold stocks remain severely undervalued compared to the gold price. A simple reversion to the mean implies a tremendous upside move.

Now consider the following data that point to a positive shift in the gold market.

  1. After 13 consecutive months of decline, GLD holdings were up over 10.5 tonnes last month. The trend is similar to other ETFs.
  1. Hedge funds and other large speculators more than doubled their bets on higher gold prices this year.
  1. Increase in M&A—for example, hostile bids from Osisko and HudBay Minerals to buy big assets.
  1. Apollo, KKR, and other large private equity groups have emerged as a new class of participants in the sector.
  1. Gold companies’ hedging of future production—usually a sign of insecurity among the miners—shrunk to the lowest level in 11 years.
  1. China continues to consume record amounts of gold and officially overtook India as the world’s largest buyer of gold in 2013.
  1. Large players in the gold futures market that were short have switched to being long.
  1. Central banks continue to be net buyers.

To top it off, there’s been no fallout (yet) from the unprecedented currency dilution undertaken since 2008—and we don’t believe in free lunches.

The gold mania train has not yet left the station, but the engine is running and the conductor has the whistle in his mouth. This means…

Any correction ahead is a potential last-chance buying opportunity before the final mania phase of this bull cycle takes our stock to new highs, well above previous interim peaks.

In spite of the good start to 2014, most of our 10-bagger gold stocks are still on the deep-discount rack. And you can get all of them with a risk-free, 3-month trial subscription to our monthly advisory focused on junior mining stocks, the Casey International Speculator.

If you sign up today, you can still get instant access to two special reports detailing which stocks are most likely to gain big this year: Louis James’ 10-Bagger List for 2014 and 7 Must-Own Stocks for 2014.

Test-drive the International Speculator for 3 months with a full money-back guarantee, and if it’s not everything you expected, just cancel for a prompt, courteous refund of every penny you paid. Click here to get started now.

I hope you will take advantage of this opportunity in front of us—while shares are still relatively cheap.


The article Junior Mining Stocks to Beat Previous Highs was originally published at caseyresearch.com.

Japanese Candlesticks Analysis 25.03.2014 (EUR/USD, USD/JPY)

Article By RoboForex.com

Analysis for March 25th, 2014

EUR USD, “Euro vs US Dollar”

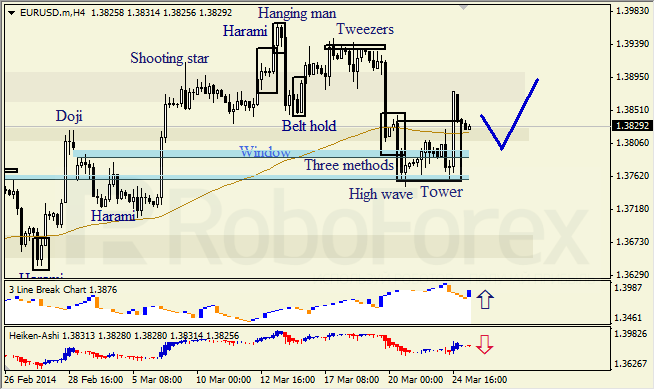
H4 chart of EUR USD shows ascending movement, which is indicated by Tower pattern. Lower Window is support level. Three Line Break chart confirms ascending movement; Heiken Ashi candlesticks indicate bearish pullback.

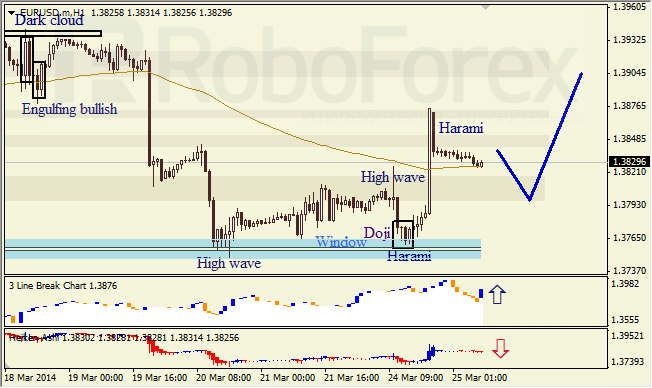
H1 chart of EUR USD shows ascending trend, which started after High Wave and Harami patterns and support from closest Window. Three Line Break chart indicates ascending trend; bearish Harami pattern and Heiken Ashi candlesticks indicate descending movement.

USD JPY, “US Dollar vs Japanese Yen”

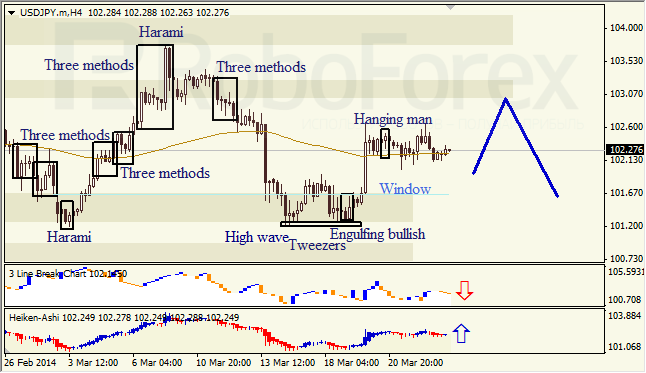
H4 chart of USD JPY shows sideways correction, which is indicated by Hanging Man pattern. Three Line Break chart indicates correction; Heiken Ashi candlesticks confirm that bullish tendency continues.

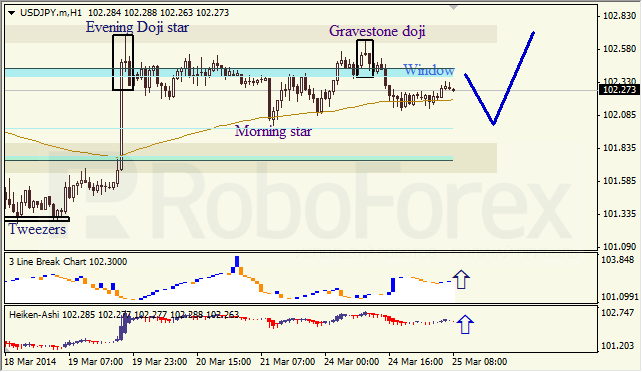
H1 chart of USD JPY shows sideways correction within ascending trend near upper Window, which is indicated by Evening Doji Star and Gravestone Doji patterns. Three Line Break chart and Heiken Ashi candlesticks confirm ascending trend.

RoboForex Analytical Department

Article By RoboForex.com

Attention!
Forecasts presented in this section only reflect the author’s private opinion and should not be considered as guidance for trading. RoboForex LP bears no responsibility for trading results based on trading recommendations described in these analytical reviews.


EUR/USD Price Action For March 25

Article by Investazor.com

Euro had a 90 pips rally yesterday. The EURUSD price went all the way to 1.3875, but pulled back and consolidated near 1.3830. A break above 1.3840 and the 200 EMA, for the 60 minutes chart, could mean another rally to retest 1.3875, 1.3880 or why not 1.3900. Keep your eyes open for a break under 1.3920, because that would be a negative signal. In this case the price could fall back to the 1.3760 support level.

The post EUR/USD Price Action For March 25 appeared first on investazor.com.

Texas Oil Spill Drives Prices Up

By HY Markets Forex Blog

The price of oil is strongly tied to supply, which means whenever an event happens that hampers the availability of this natural resource, costs may go up. The spill that occurred in Texas over the weekend is something investors who participate in crude oil trading should keep a close eye on.

This incident caused marine traffic to shut down on the 52-mile corridor in Texas, which blocked the access of eight refineries to their supply of crude oil, according to Forbes. The period of time this area is closed down due to the spill is valuable information to traders, as the longer refineries don’t have access to their supply, the higher the price of oil could rise.

“The closure could persist all week, so it may prove to supportive for prices, as crude oil deliveries will be hampered,” Michael Fitzpatrick, editor of The Kilduff Report, told USA Today. “Some 10 percent of the nation’s refining capacity if located at the channel.”

The biggest concern surrounding the spill is that it cut off Exxon from it’s refinery in Baytown and Marathon Petroleum from it’s refinery in Texas City, which are two of the biggest in the country. Crude oil traders would be wise to keep a close eye on this news story, because any extended closing of these refineries could have a major impact on supply. As a result, the price of crude oil could be volatile in the coming weeks, which is valuable information to any trader.

The post Texas Oil Spill Drives Prices Up appeared first on | HY Markets Official blog.

Article provided by HY Markets Forex Blog

EURUSD broke above 1.3845 resistance

EURUSD broke above 1.3845 resistance, indicating that the downtrend from 1.3966 had completed at 1.3749 already. Further rise to test 1.3966 resistance could be expected, a break above this level will signal resumption of the uptrend from 1.3477 (Feb 3 low), then the following upward movement could bring price to 1.4500 area. Support levels are at 1.3805 and 1.3749, only break below these levels could trigger another fall towards 1.3550.

eurusd

Provided by ForexCycle.com

Why You Should Start Buying Into The Australian Share Market Now

By MoneyMorning.com.au

Here’s something that won’t surprise you.

Or rather, it shouldn’t surprise you.

If it does surprise you then you really haven’t been paying attention.

What’s the big non-surprise?

Stock markets are risky. And yet it seems as though some of the smartest people around are only just starting to figure that out…

It’s funny how different people react to the Australian share market.

We’ve warned for well over three years now that the stock market is risky.

But we also warned that despite the risks of investing, it was a bigger risk not to invest.

With interest rates at record lows it’s quite frankly almost impossible to get a decent return without using leverage on any investment except stocks.

And this risk in the Australian Stock Market isn’t about to end anytime soon, even though the central banks would have you believe that interest rates will rise within two years. That’s hogwash.

Interest rates aren’t likely to go up within the next five years. And they may not even go up in your lifetime. That’s why we’ve made a bold call for the S&P/ASX 200 index to hit 15,000 points – more than triple where it is today .

Did they miss the past six years?

And yet a bunch of commentators still can’t seem to grasp the idea that this is and has been a risky market.

It’s as though they’ve lived in a bubble for the past six years, totally unaware of everything that has happened.

Take this op-ed in the Financial Times from Mohamed El-Erian, the chair of President Barack Obama’s Global Development Council, and a former big shot at PIMCO, the world’s biggest bond fund:

Markets have been sanguine about geopolitical risk for several years now, a phenomenon illustrated by the relaxed approach they have taken to Ukraine’s crisis. There are understandable reasons for this, but contrary to a popular saying, this could well be a case where the trend is not necessarily the markets’ friend.

After just one day of extreme nervousness, global markets had little problem digesting a major change in the map of eastern Europe. And Crimea’s annexation is not the only notable development in a crisis that has repeatedly surprised quite a few experts.

We have to say it. Is Mr El-Erian kidding?

He says share markets have been ‘sanguine‘ about geopolitical risk. In other words, he’s saying that markets have been happy or satisfied about the risk in the world.

He’s got to be kidding. Didn’t he notice the hullaballoo and ruckus about Libya, Syria, Ukraine, North Korea, China, and any other number of crises that have reared up since 2008?

We listed 19 such problems just a few weeks back. Granted, they weren’t all geopolitical events, but let’s be honest, there’s a superfine line between geopolitical and economic risks. One has a nasty habit of turning into the other.

And yet, so far nothing has happened. 19 crises and counting since 2008, and the result? Most stock markets worldwide have gone up. One exception…one big exception is China.

From the Port Phillip Publishing Library

Special Report: ASX: 15,000

Join Money Morning on Google+


By MoneyMorning.com.au

Buying Into China’s Economy While Investors Panic Over ‘The Crash’

By MoneyMorning.com.au

It’s an obvious point that the mainstream financial media missed: China’s Economy has already crashed, the bounceback is still to come.

Sorry, but we agree with pascoe

It’s a pretty rotten day when your editor finds agreement with Michael Pascoe. Yet that’s the position we’re in this morning.

In an article for the Age, Pascoe pours cold water on the latest data coming out of China. The mainstream is getting into a bit of a fluster that China’s economy could be slowing down.

This will apparently lead to an almighty crash. But Pascoe makes a good point, which in all honesty we can’t argue against:

As the Chinese economy is almost twice as big now as it was in 2007, growth of 7 per cent is a similar increase in real economic activity as 13 per cent growth was seven years ago. China will still overtake the US as the world’s biggest economy before the end of the decade.

Actually, we can make one small point to counter it. Whether it begins a big point is anyone’s guess. The issue isn’t so much the rate of growth but the growth that businesses expect.

In other words, if businesses have invested by buying new machinery and materials on the expectation of 7.5% growth and the growth is ‘only’ 7%, then it would have an impact.

A comparison is if an individual starts spending money based on the expectation of a 5% pay rise but only gets a 4% pay rise. It may not be a huge difference but it would likely impact that person’s spending for the following year.

It’s not a perfect comparison, but you get the point.

First the China bubble burst, then the ‘bounceback’

But either way it’s also important to remember something we’ve tried to bang home for the past few months.

Those holding out for a Chinese economy crash may not realise that in stock market terms it has already happened. The following chart of China’s CSI 300 index makes that clear:


Source: Google Finance
Click to enlarge

Since late 2007 when China’s market hit the top, it has fallen 62%. It’s a big fall…a very big fall. So it’s somewhat laughable for some folks to say China is still a bubble.

So is now the time to buy back into the China Economy story? That’s where we’re putting our money.

It’s always dangerous to try and catch a falling market. Jason made that point in his latest issue of Diggers and Drillers when he recommended a classic ‘bounceback’ story in the mining services sector. If Jason is right, a quick 50%+ gain could be on the cards.

But as for catching a falling market, as a speculator we don’t mind the risk of getting on a story early. The fact is you can never be sure when the market will turn.

We’d rather get in early with a small exposure and then add to it over time rather than waiting for the market to make a decisive turn upwards – by then you will likely have missed some of the big early gains.

Cheers,
Kris+

PS: If you can’t make it to Melbourne for our World War D conference on March 31-April 1, don’t worry. We’ll be live tweeting the event throughout the two days. To get all the action live, follow us on Twitter @MoneyMorningAU

From the Port Phillip Publishing Library

Special Report: ASX: 15,000

Join Money Morning on Google+


By MoneyMorning.com.au

Don’t Believe The Lies About Interest Rates And Inflation

By MoneyMorning.com.au

Last week, Martin Weale of the Bank of England said:

Interest rates could rise within a year, and risk going up sharply if inflationary pressures begin to build.

And that sentiment had the markets jumping (or should I say falling?) to attention. Well, of course it would. When interest rates rise, that’s when the house of cards finally topples.

The West is over-borrowed, and rising interest rates would cripple governments, businesses, and individuals alike. But just as importantly, low rates are exactly what have gee’d up most investment assets classes over the last five years. Shakers…is it all about to go pear-shaped?

The truth is, nobody knows exactly when the big interest rate reset will come. Here at The Right Side, I’ve been a proponent of the ‘Interest Rates will stay lower, and longer, than anyone believes’. And investing in stocks and fixed interest off the back of this belief has seen great returns over the last five years or so.

Sure, we don’t ignore market signals. But it always pays to put them in context.

What’s causing inflation?

Monetary Policy Committee member Martin Weale was wheeled out last week to warn about an imminent rate rise. His rather spurious argument goes along these lines…

The economy is doing rather well. That means people are buying more stuff. And there’s not enough ‘capacity’ (the ability to create goods and services) to allow this growth in demand to continue without pushing up prices. We should get ready to see inflation rise…and in order to tame it, rates will be going up. Quite possibly sooner than the markets believe.

Now, of course, there are some elements of truth in this idea – if there’s scarcity of supply, prices tend to go up. But are we really living in such a world? I mean, when inflation has gone up in the recent past, was it down to large queues developing at the hairdressers, or butchers? Was it a lack of baked beans on the shelf?

No. Where inflation has cropped up, it’s been down to rising global energy and commodity prices. It’s been because the pound has been weak. Yes, possibly because some clever pricing strategies and collusion in specific sectors like aviation, insurance and banking. But price rises have rarely been driven by limited capacity.

The truth is, these guys are regularly wheeled out to send out the same message. To give the sense that rates are about to go up. They need to do this to placate angry savers, and in a vain effort to quell the housing market.

There’s always an excuse to keep interest rates down

Bonds, stocks, house prices…all these things are ‘priced-off’ low interest rates. And last week’s market weakness was directly proportional to the fact that ‘players’ now believe rates may rise sooner than expected.

Well…it’s the market’s prerogative to jump on every utterance from a central bank, or after the publication of some bit of data. But over the medium- to long-term, this is all just market noise.

Over the last five years or so, the market has consistently priced in an imminent rate rise. And it’s always been wrong. During the financial crisis, the ‘emergency rates’ were seen as just that, an emergency level. And then, the curve has always kind of factored in rising rates a year or two out.

But it’s funny how when that year or two is up, the rise never occurs. Something always seems to crop up which justifies low rates. Yet, they maintain the illusion that rising rates are just round the corner.

And I’ve got no doubt something will crop up again. I don’t know what. Geopolitical tensions, bad employment data, a swooning stock market. Who cares? The central banker will find an excuse to keep rates bolted to the floor. Of course they do. And in the UK, the biggest borrower of them all still needs to find some £80bn a year to balance the books…so of course the planners need rates to stay low!

When the inflation levee breaks

The only thing that can possibly change the situation is if inflation really does take off. And I’m not talking about the type of gentle inflation in Martin Weale’s computer models. You know, the type of inflation the central banks forecast, ie the forecasts and formulas that never work!

I’m talking about proper inflation. The type that is completely unpredictable. The type of inflation that’s borne of public psychology.

So, the trap is set. Raise rates and risk financial apocalypse. Keep rates low and risk an unpredictable explosion of inflation.

Obviously, the planners go for the latter option. After all, what sane person would induce a controlled collapse? Better to go for the uncontrolled type…you can always blame that on events outside your control.

Let’s look on the bright side. This means more asset price inflation for the moment. And anyway, over the medium- to long-term we can still look to other markets for sanity. Markets like Africa, the Far East…or even…yes, Russia!

Bengt Saelensminde,
Contributing Editor, Money Morning

Ed note: The above article was originally published in MoneyWeek.

Join Money Morning on Google+


By MoneyMorning.com.au