Fadel Gheit: Lift Oil Export Ban, Free Domestic Profits and Defeat Russia

Source: JT Long of The Energy Report (5/15/14)

http://www.theenergyreport.com/pub/na/fadel-gheit-lift-oil-export-ban-free-domestic-profits-and-defeat-russia

Oppenheimer & Co. Managing Director and Senior Energy Analyst Fadel Gheit knows how to thwart Russia’s aggressive tendencies and encourage domestic oil and gas production: Lift the ban on oil exports. In the absence of a strategic U.S. energy policy, some companies will do better than others. In this interview with The Energy Report, conducted during earnings season, Gheit shares some of his insights on which companies have catalysts with bottom-line impacts.

The Energy Report : We recently interviewed Matt Badiali and he talked about what a boon the conflict in Ukraine has been for U.S. refineries. Are you seeing the same effect? What about opportunities in Europe as countries try to diversify away from dependence on Russian oil and gas?

Fadel Gheit: U.S. refiners benefit from the wide Brent/WTI discount. The Russian invasion of Ukraine has increased global tension, boosted Brent prices and widened the differential. With this cost advantage, U.S. refiners are able to significantly increase refined product exports, mainly to Latin America and Europe, which tightened U.S. supplies and boosted margins, despite flat demand.

Unfortunately, the U.S. does not have an energy policy, and we still have a ban on exporting crude oil, which has been in effect for 40 years. Even with the Russian invasion, we seem paralyzed, confused and unable to respond to Russia’s aggression. Lifting the export ban and supplying Europe with oil and refined products would reduce dependence on Russian oil and lower global oil prices, which in turn would hurt Russian exports and boost the economies of the U.S. and Europe.

TER: In your last interview, you talked about the impact of instability in the Middle East on companies likeApache Corp. (APA:NYSE). Do you see the situation stabilizing there? Are you more comfortable with companies operating in Egypt and Turkey?

FG: I believe the Middle East will remain volatile and unstable—not an attractive business environment. Apache sold 30% of its interests in Egypt to Sinopec, which is a step in the right direction. The sooner Apache exits Egypt and uses the proceeds to buy back stock, reduce debt and increase investment onshore in the U.S., the better off the shareholders will be. Why invest in Egypt or Turkey when you have the huge energy resources we have in the U.S.?

TER: You also said natural gas prices in North America are severely depressed compared to the rest of the world. You called that a good thing because it would result in a second industrial renaissance. Are you still bullish on the prospects for natural gas as an economic engine for the U.S.?

FG: Low natural gas prices are good for the consumer and drive U.S. manufacturing. But I also believe in free trade, and the U.S. government should allow LNG exports to higher-price markets, mainly in the Far East and Europe. If we had built large LNG export terminals, we could have significantly reduced Europe’s dependence on Russian gas.

TER: What companies are benefitting from the fracking boom?

FG: Domestic oil and gas producers, as well as oil service companies. Infrastructure and transportation companies are also joining the party, despite regulatory hurdles.

TER: How are the large, integrated oil companies faring in the new energy environment? What catalysts are you watching during earnings season?

FG: The stocks of the large international oil companies have not performed well in the last 10 years, as they lagged all other energy sectors and the market in general. They are viewed as defensive investments, but offer no real growth. They have above-market dividend yield, but are not attractive enough for investors who favor the pure plays of refiners or oil and gas producers.

As far as individual company catalysts, Royal Dutch Shell’s (RDS.A:NYSE; RDS.B:NYSE) new CEO, Ben van Beurden, has increased the emphasis on profits, capital efficiency and returns. Lower CAPEX and increased divestments should reduce net investments. We expect Shell to generate free cash flow of over $20 billion ($20B) over the next two years. We think this is a good start and rate it a Perform.

We will be watching production growth, cost trends, capital spending and plans to return cash to shareholders in the form of dividends and share buybacks.

TER: What about the prospects for the large independent exploration and production (E&P) companies?

FG: The large E&P companies are more attractive than the integrated companies, less volatile than the refiners and more stable than the small producers. Each has a catalyst. Anadarko Petroleum Corp. (APC:NYSE) benefited from a legal settlement, Apache benefited from restructuring, and so did Hess Corp. (HES:NYSE) and Murphy Oil Corp. (MUR:NYSE). EOG Resources Inc. (EOG:NYSE) and Pioneer Natural Resources (PXD:NYSE) benefited from oil production growth, while investors are waiting for the restructuring of Occidental Petroleum Corp. (OXY:NYSE) to take place. Marathon Oil (MRO:NYSE) andDevon Energy Corp. (DVN:NYSE) have lagged, but offer the lowest valuations in the group. Cabot Oil & Gas Corp. (COG:NYSE) and Range Resources Corp. (RRC:NYSE) will continue to reflect natural gas prices and additional pipeline capacity, which have constrained production growth.

As I mentioned in a recent research report, with higher production growth than the majors, a higher dividend yield and a lower valuation than E&P peers, ConocoPhillips (COP:NYSE) offers an alternative to both groups. We raised our 12-18 month price target to $85 from $80 to reflect an improving outlook on stronger financial and operating results and rated them outperform.

TER: Thank you for your time Fadel.

FG: Thank you.

Fadel Gheit , an energy analyst since 1986, is a managing director and senior analyst covering the oil and gas sector for Oppenheimer & Co. He has been named to The Wall Street Journal All-Star Annual Analyst Survey four times and was the top-ranked energy analyst on the Bloomberg Annual Analyst Survey for four years. He is frequently quoted on energy issues and has testified before Congress about oil price speculation.

Want to read more Energy Report interviews like this? Sign up for our free e-newsletter, and you’ll learn when new articles have been published. To see a list of recent interviews with industry analysts and commentators, visit our Streetwise Interviews page.

DISCLOSURE:

1) JT Long conducted this interview for Streetwise Reports LLC, publisher of The Gold Report, The Energy Report, The Life Sciences Report and The Mining Report, and provides services to Streetwise Reports as an employee. She owns, or her family owns, shares of the following companies mentioned in this interview: None.

2) The following companies mentioned in the interview are sponsors of Streetwise Reports: Royal Dutch Shell. Streetwise Reports does not accept stock in exchange for its services.

3) Fadel Gheit: I own, or my family owns, shares of the following companies mentioned in this interview: Royal Dutch Shell Plc, Devon Energy Corp. and ConocoPhillips. I personally am, or my family is, paid by the following companies mentioned in this interview: None. My company has a financial relationship with the following companies mentioned in this interview: None. I was not paid by Streetwise Reports for participating in this interview. Comments and opinions expressed are my own comments and opinions. I had the opportunity to review the interview for accuracy as of the date of the interview and am responsible for the content of the interview.

4) Interviews are edited for clarity. Streetwise Reports does not make editorial comments or change experts’ statements without their consent.

5) The interview does not constitute investment advice. Each reader is encouraged to consult with his or her individual financial professional and any action a reader takes as a result of information presented here is his or her own responsibility. By opening this page, each reader accepts and agrees to Streetwise Reports’ terms of use and full legal disclaimer.

6) From time to time, Streetwise Reports LLC and its directors, officers, employees or members of their families, as well as persons interviewed for articles and interviews on the site, may have a long or short position in securities mentioned. Directors, officers, employees or members of their families are prohibited from making purchases and/or sales of those securities in the open market or otherwise during the up-to-four-week interval from the time of the interview until after it publishes.

Streetwise – The Energy Report is Copyright © 2014 by Streetwise Reports LLC. All rights are reserved. Streetwise Reports LLC hereby grants an unrestricted license to use or disseminate this copyrighted material (i) only in whole (and always including this disclaimer), but (ii) never in part.

Streetwise Reports LLC does not guarantee the accuracy or thoroughness of the information reported.

Streetwise Reports LLC receives a fee from companies that are listed on the home page in the In This Issue section. Their sponsor pages may be considered advertising for the purposes of 18 U.S.C. 1734.

Participating companies provide the logos used in The Energy Report. These logos are trademarks and are the property of the individual companies.

101 Second St., Suite 110

Petaluma, CA 94952

Tel.: (707) 981-8204

Fax: (707) 981-8998

Email: [email protected]


Phil Juskowicz: How to Beat the Street to North American Energy Profits

Source: Tom Armistead of The Energy Report (5/15/14)

http://www.theenergyreport.com/pub/na/phil-juskowicz-how-to-beat-the-street-to-north-american-energy-profits

When differentials emerge, it’s time for investors to take notice. Phil Juskowicz, a managing director in Casimir Capital’s research department, smells opportunity in micro-cap oil and gas companies, which have lagged behind the small caps for the last three years. In this interview with The Energy Report, Juskowicz explains how they are undervalued, and why they are the ultimate leveraged plays in the (very likely) event of natural gas demand growth.
The Energy Report: Phil, thank you for joining us. The Casimir Micro-Cap Exploration and Production (E&P) Index and the Standard & Poor’s Small-Cap E&P Index diverged in 2011 after closely tracking for several years. Why is this an opportunity for investors?

Phil Juskowicz: Investors wanting exposure to small E&P companies may do well focusing on the micro-cap space rather than small-caps. The S&P Small-Cap E&P Index has substantially outperformed the Casimir Micro-Cap E&P index since the beginning of 2013: The S&P index is up approximately 70% and the Casimir index 20% during this period. As a result of this outperformance, the S&P Small-Cap E&P index trades at rather heady levels, for example, on an EV/EBITDAX basis, compared with some micro-cap E&P shares.

In our view, the divergence reflects, in large part, the desire to invest in companies with exposure to shale plays. Such companies are often the E&Ps that have the financial wherewithal to conduct expensive drilling programs. As these programs ramp up, cash flow rises, and the big companies become even bigger. Additionally, and partially as a result of that trend, the large companies are becoming increasingly oily, with the smaller companies left with the gas-prone assets, or with plays that are less sexy, such as recompletions and workovers. As a result of these trends, we believe that some of the shares of the larger companies may be getting ahead of themselves, and that some of the microcap names offer compelling investment potential.

The micro-cap names we will discuss shortly actually have exposure to some of these shale plays, and are undervalued, in our opinion. Additionally, we believe that shares of other micro-cap E&P companies that are not in the shale plays may warrant analysis as well. As I said, these companies are often working on natural gas, rather than oil, assets. By 2020, we expect industrial demand for natural gas to increase some 15 billion cubic feet per day (15 Bcf/d), or 65%. Coupled with new demand from liquefied natural gas (LNG) exports of 7 Bcf/d, we are constructive toward natural gas prices.

TER: In Ohio, the state responded with restrictions on hydraulic fracturing after geologists found a “probable connection” between fracking and a series of minor earthquakes in the state. Ohio has both the Marcellus and Utica shales. What effects will the restrictions have on production there?

PJ: The drilling restrictions act as a reminder that the shale revolution is not without risk. We can’t assume that shale drilling will continue unabated. Nevertheless, we don’t believe that the restrictions, which govern permits within three miles from a known fault or area of seismic activity, will seriously affect drilling and production. Most of the industry activities are occurring outside of these zones, and the Ohio Department of Natural Resources has continued issuing drilling permits. We have not observed any drilling restrictions related to seismic concerns in any other major producing states. I believe Vermont and Massachusetts may have talked about drilling restrictions related to the issue, but those are not sources of significant production.

TER: What companies are you following in the oil and gas space that could benefit from some of these trends?

PJ: We cover a couple of companies that may benefit from being involved in the shale plays. Two such companies are PEDEVCO Corp. (PED:NYSE.MKT) andTrans Energy Inc. (TENG:OTCBB), which operate in the Niobrara and the Marcellus, respectively. And we recently initiated coverage of ENSERVCO Corp. (ENSV:NYSE.MKT), which is an oilfield service company that’s benefiting from the shale boom, though its services extend to other areas as well.

TER: PEDEVCO is talking about expanding operations in Asia. What opportunities does it see there?

PJ: It has an acquisition in process that’s anticipated to close in September in Kazakhstan, but I’ve liked the company to date more because of its focus on the Niobrara Shale. The company has a net enterprise value of about $60M. The current present value of its assets is significantly more than that, in our opinion. Recently, it purchased Continental Resources Inc.’s (CLR:NYSE) assets in the Niobrara with a PV10 of more than $100M, and it bought that for just $21M. It funded the acquisition with a 50/50 joint venture with a natural resource-focused private equity firm, which enables PEDEVCO to develop its now 15,000 net acres in Weld and Morgan counties, Colo. The company just reported healthy IP rates for three new wells drilled by Bonanza Creek Energy (BCEI: NYSE) on the acquired acreage. We were encouraged by the fact that each of the wells demonstrated similar results, thus supporting the reservoir model, in our view.

It also has 3,500 net acres with Mississippian Lime potential. That is an area that SandRidge Energy Inc. (SD:NYSE) continues to call a core focus area for itself, and SandRidge is an industry leader in that play. We don’t cover SandRidge. Those assets are located in Oklahoma.

I would say that the Kazakhstan assets are a longer-term view. However, the company management has experience working internationally, with Frank Ingriselli, the CEO, having come from Camac Energy (CAK:NYSE). The company, in addition to the private equity firm I mentioned before, has a strategic investment from MIE Holdings Corp. (1555:HKG), which is China’s largest onshore independent oil company. So I believe that longer term, PEDEVCO could benefit from its international ties. In the short term, it’s focused on the Niobrara Shale and the Mississippian Lime in Colorado and Oklahoma, respectively.

TER: Is PEDEVCO exposed to any blowback or downside from the slowing growth in Asia and the possible sanctions on Russia?

PJ: No. In general, again, Kazakhstan is about to become one of the largest oil-producing countries in the world. And oil is an international commodity with international-based pricing fundamentals and drivers. Again, PEDEVCO’s presence in Asia isn’t anticipated to happen until September on a commodity that can float anywhere in the world. So I don’t believe that we should see any significant impact from an Asia slowdown or the crisis in Russia.

TER: Why did you upgrade your target price for PEDEVCO to $3.50 in January and now to $5?

PJ: We initiated coverage with a $3.50 target, and we upgraded the stock from Speculative Buy to Buy in January while maintaining the $3.50 target because we were excited about the opportunity and the value the company was getting from the acquisition of Continental’s assets in the Niobrara. Again, it bought $100M of PV10 assets for $21M. It paid $52,000 ($52K) per flowing barrel of production. So we were excited about that; we felt that there was less risk and the company warranted a Buy as opposed to a Speculative Buy rating.

We recently upgraded the target to $5 once the company got the financing for this acquisition, enabling PEDEVCO to further develop its acreage. Our $5 target consists of present value calculations of wells, for which financing is in hand. The financing helps the company to develop its acreage and obtain increased net present value from its acreage. Our target also included the pro forma debt associated with such financing. So despite the debt, its target increased.

TER: Trans Energy’s stock jumped more than 30% in late December and has stayed up since then. What is behind that?

PJ: It likely reflects superior well results in the Marcellus, which continues to improve on what are already industry-leading production metrics, meaning the Marcellus is a play that is continuing to show among the strongest results in the country. Trans Energy is one of the few publicly traded, pure-play Marcellus E&P companies. So what prompted the stock to potentially increase more than 30% since late December is the continuing good results coming both out of the Marcellus and out of the company itself.

The company had two recent wells that had 60-day average initial production (IP) rates of 9.5 and 6.2 cubic feet equivalent per day (9.5 and 6.2 cf eq/day) of production. That came in late January.

TER: If you could boil it down to one or two factors, is the company benefiting from good luck, good selection of drilling sites, good management or maybe all of them?

PJ: I would say there’s an aspect of good luck in that Trans Energy’s acreage happens to be located in what would become the nation’s most important source of natural gas, the Marcellus. However, we believe management has done an excellent job with, for example, the two wells that we mentioned before. The company and management operated in the Marcellus long before it became the play that it is today. I would say that the wells’ performance has been above industry norms. If you look at those IP rates as well as estimated ultimate recoveries per 1,000 ft of lateral, Trans Energy is a top-tier performing company, in our opinion. I would also just mention that besides management’s ability to execute on production, it did a good job of culling the asset base and selling down some acreage that we saw as non-core for Trans and utilizing the money to ramp up its drilling program in its core areas.

TER: ENSERVCO has a somewhat different business focus. What prompted you to initiate coverage of it in February?

PJ: We think that’s a company that has limited analyst coverage, undiscovered by the Street. Management, in our opinion, has done an excellent job of managing businesses in general and, most recently, applying that to ENSERVCO, an oilfield service company. ENSERVCO is the only national provider of frack heating, hot oiling and acidizing services to the oil industry. It has existing footholds in some of the largest-producing basins in the country and is leveraging some of those to launch into new areas, most recently going from the Marcellus into signing agreements with Utica producers as well. The Marcellus and the Utica largely overlie each other, and that abates the need to establish new yards.

TER: Is ENSERVCO mostly operating in those two formations?

PJ: Actually, half of its business comes from the Rockies. Just 20–25% at this point comes from the Marcellus and Utica region, with the remainder coming from what it calls the central region—Mississippian Lime, for example. In that region, in addition to frack heating, hot oiling and acidizing, ENSERVCO is essentially hauling liquid. That’s a lower-margin business. Well enhancement services businesses are much higher margin.

I don’t want readers to come away thinking that ENSERVCO is a company that is solely tied to new drilling and industry activity and, therefore, subject to the boom/bust cycle of the oilfield service and oil industry. While half of what the company does is in fact tied to new wells, the other half is servicing wells throughout the well life, for example stimulating older wells to produce again with acidizing and reducing paraffin buildup with hot oiling. Therefore, ENSERVCO isn’t as cyclical as a typical oilfield service company may be, as it provides its services throughout the well’s life.

TER: Has ENSERVCO expanded geographically in recent years?

PJ: In addition to the agreements it has made to service companies that are targeting the Utica formation, the company recently announced that it is going to be entering Texas. I think that it’s going to do that in a smaller way, without risking too much invested capital there. Just based on the company’s history, I believe that it will not enter a market unless it has some indications of interest either from new customers or from existing customers that also operate in a different region.

Most of the companies that ENSERVCO services are national E&P companies with operations in Texas as well, companies like Anadarko Petroleum Corp. (APC:NYSE) and Noble Energy Inc. (NBL:NYSE).

TER: Is ENSERVCO’s capacity expanding to meet these geographic extensions?

PJ: Yes. It has expanded its asset base over the past couple of months and has set itself up for additional revenue to come in. It is spending within its cash flow at this time. Management has demonstrated, in my opinion, prudent investment management principles.

TER: The conventional wisdom says that shale is the future, but some voices warn about rapid decline rates. What should a careful investor do?

PJ: Similar to what we were describing before about the risks potentially associated with high production declines or regulatory risks like we’ve seen in Ohio, I would suggest that investors diversify and focus on natural gas-based companies. We see some 15 Bcf/d of petrochemical plants coming online over the next couple years, and 5 Bcf/d of liquefied natural gas facilities coming online the next couple years. That adds up to a lot of new demand for natural gas.

Again, some of these gas-focused companies may have been overlooked by investors until now, and have some value potential. At the same time, companies that are focused on exploitation of older wells, what they call workovers and recompletion, could be a nice place for investors to diversify into if they want to put their money into commodity-focused companies.

TER: You’ve given a lot of good information here. I appreciate your time.

PJ: Thanks again for having me.

Philip Juskowicz , CFA, is a managing director in the research department at Casimir Capital, a boutique investment bank specializing in the natural resource industry. Juskowicz began his career at Standard & Poor’s in 1998. From 2001 to 2005, he worked in equity research at both First Albany Corp. and Buckingham Research. At Buckingham, Juskowicz was senior oilfield service analyst, leveraging his extensive knowledge of the E&P space. From 2006 to 2010, he served as a credit analyst at WestLB, a German investment bank. He earned a Master of Science in finance from the University of Baltimore.

Want to read more Energy Report interviews like this? Sign up for our free e-newsletter, and you’ll learn when new articles have been published. To see recent interviews with industry analysts and commentators, visit our Streetwise Interviews page.

DISCLOSURE:

1) Tom Armistead conducted this interview for Streetwise Reports LLC, publisher of The Gold Report, The Energy Report, The Life Sciences Report and The Mining Report, and provides services toStreetwise Reports as an independent contractor. He owns, or his family owns, shares of the following companies mentioned in this interview: None.

2) The following companies mentioned in the interview are sponsors of Streetwise Reports: ENSERVCO Corp. Streetwise Reports does not accept stock in exchange for its services.

3) Phil Juskowicz: I own, or my family owns, shares of the following companies mentioned in this interview: None. I personally am, or my family is, paid by the following companies mentioned in this interview: None. My company has a financial relationship with the following companies mentioned in this interview: Trans Energy Inc. and ENSERVSCO Corp. My company has a business relationship and has received investment banking and non-investment banking compensation from the following companies mentioned in this interview: Pedevco Corp. I was not paid by Streetwise Reports for participating in this interview. Comments and opinions expressed are my own comments and opinions. I had the opportunity to review the interview for accuracy as of the date of the interview and am responsible for the content of the interview.

4) Interviews are edited for clarity. Streetwise Reports does not make editorial comments or change experts’ statements without their consent.

5) The interview does not constitute investment advice. Each reader is encouraged to consult with his or her individual financial professional and any action a reader takes as a result of information presented here is his or her own responsibility. By opening this page, each reader accepts and agrees to Streetwise Reports’ terms of use and full legal disclaimer.

6) From time to time, Streetwise Reports LLC and its directors, officers, employees or members of their families, as well as persons interviewed for articles and interviews on the site, may have a long or short position in securities mentioned. Directors, officers, employees or members of their families are prohibited from making purchases and/or sales of those securities in the open market or otherwise during the up-to-four-week interval from the time of the interview until after it publishes.

Streetwise – The Energy Report is Copyright © 2014 by Streetwise Reports LLC. All rights are reserved. Streetwise Reports LLC hereby grants an unrestricted license to use or disseminate this copyrighted material (i) only in whole (and always including this disclaimer), but (ii) never in part.

Streetwise Reports LLC does not guarantee the accuracy or thoroughness of the information reported.

Streetwise Reports LLC receives a fee from companies that are listed on the home page in the In This Issue section. Their sponsor pages may be considered advertising for the purposes of 18 U.S.C. 1734.

Participating companies provide the logos used in The Energy Report. These logos are trademarks and are the property of the individual companies.

101 Second St., Suite 110

Petaluma, CA 94952

Tel.: (707) 981-8204

Fax: (707) 981-8998

Email: [email protected]


Outside the Box: EM Carry Trade Looks Vulnerable

By John Mauldin

Last year, post-taper tantrum, the story was all collapsing BRIC walls and emerging-market doom. This year the so-called “fragile five” – Brazil, India, Indonesia, Turkey, and South Africa – the countries that were most vulnerable last year, are looking downright robust. Since their January lows, the Turkish lira has climbed 13%, the Brazilian real 10%, the South African rand 8%, and the Indonesian rupiah and Indian rupee 6% each. In the last two months, the MSCI Emerging Markets Index is up 7% in US dollar terms, a whole lot better than the 1% the developed markets have logged.

But not so fast, says Joyce Poon, Gavekal Asia Research Director (and for my money the best of the young generation of analysts working the Asia markets). “The trouble,” says Joyce, “is that this rally has been driven primarily by investors’ growing enthusiasm for carry trades in an environment of declining global volatility. Experience teaches this is an engine which can all too suddenly be thrown into reverse.”

Joyce’s concern was echoed in a tweet just yesterday from Global Macro Investor’s Raoul Pal – who we are delighted to have joining us at the SIC conference this week, by the way. He tweeted:

And before we move on, I just have to share with you a marvelous bit of whimsy concocted a couple days ago by my associate Worth Wray (who always seems to be two steps ahead of the game in sensing these macro trends). As I mentioned over the weekend, you’ll be hearing from Worth every day during the conference, as he and I summarize all the goings on for you in a special Thoughts from the Frontline series. But first this:

And that is the name of that tune.

I am in San Diego, and my Strategic Investment Conference has started. They tell me they are setting the room for over 650 attendees. Old friends and new gather, economic junkies and those who are trying for the first time to figure things out. (It seems we have more young people every year, or it might be that I keep getting older and the standard of “young” keeps rising along with the markets.)

And late at night a few resilient souls gather in my room, debating the topics of the day. David Rosenberg, polite but never shy, weighs in with his bullish calls, while Darth Vader (aka Bloomberg Chief Economist Rich Yamarone) waves the yellow flag. Wait, who is that flapping her arms and hooting? It is Joan McCullough, that rarely seen, beautifully plumed bird who has graced us with her presence. And she schools both David and Rich with a dose of real world. And sets the tone for the next hour’s debate.

Maybe 15 people, free thinkers all (or maybe some of us are free of thought?), weigh in as the conversation morphs and finds its own path. Gods, I live for these nights! I am such an unrepentant idea and information addict. And for the next three days be the fastest game in town will be right here – it will be like drinking new ideas and views from a fire hose.

I confess to being nervous about my speech on Thursday, something that doesn’t happen often any more. I have spent more time on this one than on any speech I have ever done, and may have overthought it. Too much in my head trying to get out; too much for 40 minutes. Kind of like trying to get your 100,000-year-old human brain to truly understand exponential change. It feels like too much is rushing to the front of the brain, all begging to be set free. The rehearsals have not gone well, at least in my opinion.

And perhaps that is due in part to the fact that I have seen the presentations of some of the other speakers. Patrick Cox is doing a 260-slide PowerPoint deck in 40 minutes. Seriously. And it’s captivating. And Grant Williams truly makes his Apple whatever-it-is software literally sing and dance. At least I don’t follow them or Kyle Bass or Newt, although Dylan Grice will blow the place out before I get my shot. Rosie (David Rosenberg), my lead-off hitter, steps up to the plate in 8 hours, at 8 am, and then it never slows down. Until Saturday, maybe… I kicked everyone out of the room at 11, came in, checked email, and finished this note. And Rosie, who I firmly believe is the first true android, will get his daily out tomorrow morning.

You have a great week, and if you do the Twitter thing, shoot me a note as to what you want me to ask the speakers. You can see the list here (click on the Speakers tab). Worth and I will be writing notes every day about what we are hearing and thinking and sending them your way as shorter editions of Thoughts from the Frontline.

Your thinking about Investing in an Age of Transformation analyst,

John Mauldin, Editor
Outside the Box
[email protected]

Stay Ahead of the Latest Tech News and Investing Trends…

Click here to sign up for Patrick Cox’s free daily tech news digest.

Each day, you get the three tech news stories with the biggest potential impact.


EM Carry Trade Looks Vulnerable

By Joyce Poon, Gavekal Asia Research Director

Over the last two months, emerging markets have delivered a handsome rally, with the MSCI emerging markets index recording a 7% return in US dollar terms, compared with just 1% for the developed markets. The trouble is that this rally has been driven primarily by investors’ growing enthusiasm for carry trades in an environment of declining global volatility. Experience teaches this is an engine which can all too suddenly be thrown into reverse.

The defining feature of the current run-up in emerging markets is that the greater the sell-off a country suffered last year, the stronger the rally it has enjoyed this year. As a result, the so-called “fragile five”—Brazil, India, Indonesia, Turkey, and South Africa—the markets most reliant on foreign capital and so most vulnerable during last year’s taper tantrum, are no longer looking quite so fragile. Since their lows in January, the Turkish lira has surged 13%, the Brazilian real 10%, the South African rand 8% and the Indonesian rupiah and Indian rupee 6% each.

It hasn’t taken long for the rebound to flow through to stock markets. In local currency terms, an investor with an equally-weighted allocation to each of the fragile five’s equity markets will already have seen his portfolio regain its previous high reached in May 2013 (see chart below).

As investors, we like equity rallies to be propelled by fundamental factors, like earnings re-ratings or growth surprises. But there is little behind this rally to suggest any sustainable economic healing. Sure, there are pockets of earnings re-ratings because of last year’s currency depreciation, but we see little in terms of broad-based economic surprises. According to the Citi Eco Surprise Index, economic data in the emerging market has largely surprised on the downside so far this year. Most forward-looking indicators, especially in Asia, are signaling no prospect of any decisive upturn in the growth outlook. What’s more, the prevailing direction of economic and monetary policies is hardly investor-friendly. Credit moderation remains the order of the day in China, while policy settings have been on hold among many of the other major emerging markets in the run-up to national elections. And with food prices turning up, monetary easing is now off the table for emerging market central bankers.

That leaves the search for carry as the principal engine of the current rally. The markets which sold off most violently last year, and which have rebounded most strongly over the last couple of months, are those offering the most attractive yields. As volatility in global financial markets fell this year, and lingering fears of emerging market contagion evaporated, the lack of yield on cash prompted investors to turn once again to the high yielding emerging market currencies and fixed income markets which took such a beating last year.

The widespread return of calm which has underpinned the revival of the emerging market carry trade is marked, and even ominous. Unless you are trading the renminbi or the Russian market, volatility levels in major equity markets, currency pairs, CDS spreads and basis swaps are once again approaching, if not already below, the lows seen last April. Even Chinese CDSs are at year-to-date lows, despite the worries over China’s growth trajectory, while volatility in the Brent crude market has fallen even as geopolitical uncertainty has mounted. While low volatility is nothing new in the era of financial repression, it still signals a remarkable rebound in confidence given expectations that the Fed will halt its balance sheet expansion within a few months.

On this premise, the moment that volatility returns, the emerging markets will be extremely vulnerable to investor repositioning. Quite what the trigger might be is impossible to say. But history teaches us that volatility rarely stays this low for long.

Like Outside the Box?
Sign up today and get each new issue delivered free to your inbox.
It’s your opportunity to get the news John Mauldin thinks matters most to your finances.

© 2013 Mauldin Economics. All Rights Reserved.
Outside the Box is a free weekly economic e-letter by best-selling author and renowned financial expert, John Mauldin. You can learn more and get your free subscription by visiting www.MauldinEconomics.com.
Please write to [email protected] to inform us of any reproductions, including when and where copy will be reproduced. You must keep the letter intact, from introduction to disclaimers. If you would like to quote brief portions only, please reference www.MauldinEconomics.com.
To subscribe to John Mauldin’s e-letter, please click here: http://www.mauldineconomics.com/subscribe
To change your email address, please click here: http://www.mauldineconomics.com/change-address

Outside the Box and MauldinEconomics.com is not an offering for any investment. It represents only the opinions of John Mauldin and those that he interviews. Any views expressed are provided for information purposes only and should not be construed in any way as an offer, an endorsement, or inducement to invest and is not in any way a testimony of, or associated with, Mauldin’s other firms. John Mauldin is the Chairman of Mauldin Economics, LLC. He also is the President of Millennium Wave Advisors, LLC (MWA) which is an investment advisory firm registered with multiple states, President and registered representative of Millennium Wave Securities, LLC, (MWS) member FINRA, SIPC, through which securities may be offered . MWS is also a Commodity Pool Operator (CPO) and a Commodity Trading Advisor (CTA) registered with the CFTC, as well as an Introducing Broker (IB) and NFA Member. Millennium Wave Investments is a dba of MWA LLC and MWS LLC. This message may contain information that is confidential or privileged and is intended only for the individual or entity named above and does not constitute an offer for or advice about any alternative investment product. Such advice can only be made when accompanied by a prospectus or similar offering document. Past performance is not indicative of future performance. Please make sure to review important disclosures at the end of each article. Mauldin companies may have a marketing relationship with products and services mentioned in this letter for a fee.

Note: Joining The Mauldin Circle is not an offering for any investment. It represents only the opinions of John Mauldin and Millennium Wave Investments. It is intended solely for investors who have registered with Millennium Wave Investments and its partners at http://www.MauldinCircle.com (formerly AccreditedInvestor.ws) or directly related websites. The Mauldin Circle may send out material that is provided on a confidential basis, and subscribers to the Mauldin Circle are not to send this letter to anyone other than their professional investment counselors. Investors should discuss any investment with their personal investment counsel. You are advised to discuss with your financial advisers your investment options and whether any investment is suitable for your specific needs prior to making any investments. John Mauldin is the President of Millennium Wave Advisors, LLC (MWA), which is an investment advisory firm registered with multiple states. John Mauldin is a registered representative of Millennium Wave Securities, LLC, (MWS), an FINRA registered broker-dealer. MWS is also a Commodity Pool Operator (CPO) and a Commodity Trading Advisor (CTA) registered with the CFTC, as well as an Introducing Broker (IB). Millennium Wave Investments is a dba of MWA LLC and MWS LLC. Millennium Wave Investments cooperates in the consulting on and marketing of private and non-private investment offerings with other independent firms such as Altegris Investments; Capital Management Group; Absolute Return Partners, LLP; Fynn Capital; Nicola Wealth Management; and Plexus Asset Management. Investment offerings recommended by Mauldin may pay a portion of their fees to these independent firms, who will share 1/3 of those fees with MWS and thus with Mauldin. Any views expressed herein are provided for information purposes only and should not be construed in any way as an offer, an endorsement, or inducement to invest with any CTA, fund, or program mentioned here or elsewhere. Before seeking any advisor’s services or making an investment in a fund, investors must read and examine thoroughly the respective disclosure document or offering memorandum. Since these firms and Mauldin receive fees from the funds they recommend/market, they only recommend/market products with which they have been able to negotiate fee arrangements.

PAST RESULTS ARE NOT INDICATIVE OF FUTURE RESULTS. THERE IS RISK OF LOSS AS WELL AS THE OPPORTUNITY FOR GAIN WHEN INVESTING IN MANAGED FUNDS. WHEN CONSIDERING ALTERNATIVE INVESTMENTS, INCLUDING HEDGE FUNDS, YOU SHOULD CONSIDER VARIOUS RISKS INCLUDING THE FACT THAT SOME PRODUCTS: OFTEN ENGAGE IN LEVERAGING AND OTHER SPECULATIVE INVESTMENT PRACTICES THAT MAY INCREASE THE RISK OF INVESTMENT LOSS, CAN BE ILLIQUID, ARE NOT REQUIRED TO PROVIDE PERIODIC PRICING OR VALUATION INFORMATION TO INVESTORS, MAY INVOLVE COMPLEX TAX STRUCTURES AND DELAYS IN DISTRIBUTING IMPORTANT TAX INFORMATION, ARE NOT SUBJECT TO THE SAME REGULATORY REQUIREMENTS AS MUTUAL FUNDS, OFTEN CHARGE HIGH FEES, AND IN MANY CASES THE UNDERLYING INVESTMENTS ARE NOT TRANSPARENT AND ARE KNOWN ONLY TO THE INVESTMENT MANAGER. Alternative investment performance can be volatile. An investor could lose all or a substantial amount of his or her investment. Often, alternative investment fund and account managers have total trading authority over their funds or accounts; the use of a single advisor applying generally similar trading programs could mean lack of diversification and, consequently, higher risk. There is often no secondary market for an investor’s interest in alternative investments, and none is expected to develop.


Gold Prices Falls on China Lower Demand

By HY Markets Forex Blog

Gold prices were seen falling on Thursday as investors raise concerns over the possible lower demand from China, the largest consumer of the metal.

Gold Futures for immediate delivery fell 0.18% lower to $1,303.50 an ounce at the time of writing, dropping from $1,309.09, the highest price since May 7. While silver edged 0.15% lower to $19.745 an ounce.

Holdings in the world’s largest gold-backed exchange traded fund, SPDR Gold Trust, lost over 4 tons to 787.95 tons on Thursday.

Prices for the yellow metal bounced back from its biggest drop in a year since 1981, climbing by 8.6% this year.

China Demand

A report from the National Bureau of statistics showed that gold and silver jewelry sales in China dropped by 30% to 20.8 billion in April from the year before.

The global investment and banking provider, Macquarie Group said the lower spending in China indicates the lower gold prices for now.

China overtook India as the world’s largest gold consumer last year, as consumption in China climbed by 32% to 1,065.8 metric tons last year, according to the World Gold Council.

China’s gold consumption is expected to rise to 1,350 tons by 2017, the World Gold Council said in April. China’s jewelry purchases of nearly 669 tons in 2013 accounted for 30% of the global total, the council confirmed.


Visit www.hymarkets.com   to find out more about our products and start trading today with only $50 using the latest trading technology today.

The post Gold Prices Falls on China Lower Demand appeared first on | HY Markets Official blog.

Article provided by HY Markets Forex Blog

Silver On The Verge Of Turning Bullish

Technical Sentiment: Neutral


Key Takeaways

  • Silver briefly traded above the 4H 200 Simple Moving Average;
  • Stop Losses above $19.74 and $19.90 cleared;
  • Higher Low – Higher High suggests a bullish technical bias.

Silver rallied 49 cents on Wednesday, providing a late continuation on Monday’s Bullish Engulfing Bar. Having briefly crossed above the 200 Simple Moving Average on the 4H time frame and with a Higher Low ($19.04) and a Higher High ($19.97) already established, the market shook a few traders out of their short positions as technical signals were heavily skewed towards the upside.


Technical Analysis
Silver 15th may

Yesterday’s gains have been completely retraced as Silver is currently trading around $19.50. The $19.97 rally above the previous highs from late-April and May cleared stop losses from short traders. At the same time this move indicated an overall bullish bias, thus Silver is technically less likely to aggressively pursue levels below $19.04 in the near future.

A deeper fall into the $19.00 – $19.33 region can suggest the bullish rallies we’ve seen this week have reached their target. However, as long as the $19.04 Low remains intact, the net positioning will be skewed towards long positions and buy orders as traders will attempt to catch another possible Higher Low.

Towards the upside $20.00 will remain the most important resistance to be broken before the downtrend is completely invalidated. A secondary major resistance lies at $20.59 in the form of a pivot zone, with the 200-Day Moving Average just above it at $20.85.

*********
Prepared by Alexandru Z., Chief Currency Strategist at Capital Trust Markets


Stocks Market Report 15th May

By HY Markets Forex Blog

Stocks –  Europe

In Europe, the equities market climbed on Thursday as investors await a string of economic reports including the eurozone’s first-quarter GDP report and inflation results for April.

The European Euro Stoxx 50 gained 0.26% to 3,218.79 at the time of writing, while the German DAX added 0.41% to 9,794.18. At the same time the French CAC 40 climbed 0.11% trading at 4,506.23, while the UK benchmark FTSE 100 rose 0.18% to 6,891.01.

GDP Reports

Traders will be focusing on the release of GDP reports from the eurozone , while the GDP in Germany showed that the nation’s economy expanded by 2.5% in the first quarter on an annual basis, up from the previous figure of 1.3% seen in the previous quarter, reports from the Federal Statistical Office showed.

In France, the gross domestic product (GDP) for the country’s first quarter over the year grew by 0.8%, according to  official data from the National Institute of Statistics.

Italy’s first quarter GDP over the year is forecasted to show a drop of 0.1%, while a rise of 0.2% on a quarterly basis is expected to be seen.

The eurozone is expected to have expanded by 1.1% year-on-year and 0.4% quarter-on-quarter, according to market analysts.

Another major economic report in the spotlight is the consumer-price inflation rate for the eurozone, with forecasts of 0.7% on an annual basis in April.

Stocks – Asia

Stocks in Asia were seen trading lower on Thursday, with the stronger yen dragging stocks lower.

The Japanese benchmark Nikkei 225 index dived 0.75% lower closing the session at 14,298.21 points, while Tokyo’s Topix index fell 0.69% lower, ending at 1,175.02.

The yen strengthened ¥101.8 against the greenback on Thursday, dragging the Japanese carmakers, Honda Motor Company Ltd. Lower by 2%, while Toyota lost 1.5%.

Japan’s gross domestic product (GDP) grew by 1.5% in the last quarter, surpassing analysts’ forecast of a rise by 1%, data from the Cabinet Office showed on Thursday.

Hong Kong’s Hang Seng index advanced 0.3% trading at 22,649.91 points, while the mainland Chinese Shanghai Composite lost 0.74% to 2,032.79 points.

China’s largest internet-provider, Tencent reported a profit of 6.46 billion yuan in the first quarter on Thursday.

South Korea’s benchmark Kospi index retreated 0.03% to 2,010.20 points, while the Australia’s S&P/ASX 200 index edged 0.14% higher closing at 5,504.00 points.


Visit www.hymarkets.com   to find out more about our products and start trading today with only $50 using the latest trading technology today.

The post Stocks Market Report 15th May appeared first on | HY Markets Official blog.

Article provided by HY Markets Forex Blog

GBPUSD Forex Trading Pivot Point Levels: Pound Sterling under 1.6800

2014.05.15 12:30 6:30AM ET | GBPUSD Currency Pair

SC GBPUSD 2014.05.15

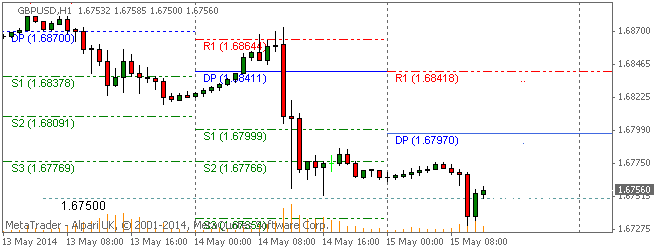
Here are the Pivot Points Levels with Support (S) and Resistance (R) for the GBPUSD currency pair today. Price action is currently trading at the 1.67560 price level and under the daily pivot point, according to data at 6:30 AM ET. The GBPUSD high for the day has been 1.67763 while the low of day has fallen to 1.67305. The pair earlier today opened the Asian trading session below the daily pivot and has continued to trend lower to the 1.6750 area.

Daily Pivot Point: 1.67970
— S1 – 1.67207
— S2 – 1.66758
— S3 – 1.65995
— R1 – 1.68419
— R2 – 1.69182
— R3 – 1.69631


Weekly Pivot Points: GBPUSD

SC GBPUSD 2014.05.15

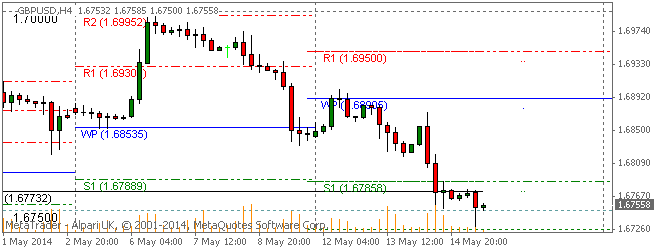
Prices are currently trading under the weekly pivot point and below the S1 support level at time of writing. The GBPUSD has been on an overall strong bearish trend this week after opening the trading week below the weekly pivot.

Weekly Pivot Point: 1.68905
— S1 – 1.67858
— S2 – 1.67263
— S3 – 1.66216
— R1 – 1.69500
— R2 – 1.70547
— R3 – 1.71142


By CountingPips.comForex Trading Apps & Currency Trade Tools

Disclaimer: Foreign Currency trading and trading on margin carries a high level of risk and volatility and can result in loss of part or all of your investment. All information and opinions contained do not constitute investment advice and accuracy of prices, charts, calculations cannot be guaranteed.


USDJPY Forex Trading Pivot Point Levels: Pair remains below 102

2014.05.15 12:30 6:30AM ET | USDJPY Currency Pair

SC USDJPY 2014.05.15

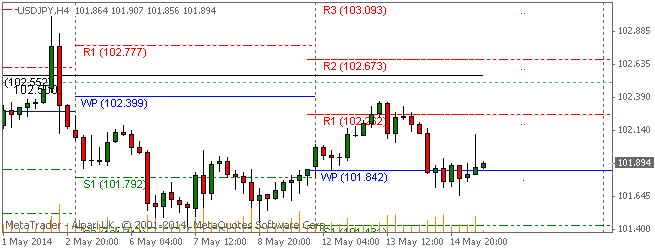
Here are the Pivot Points Levels with Support (S) and Resistance (R) for the USDJPY currency pair today. Price action is currently trading at the 101.894 price level and below the daily pivot point, according to data at 6:30 AM ET. The USDJPY high for the day has been 102.108 while the low of day has reached to 101.653. The pair earlier today opened the Asian trading session below the daily pivot and has trended slightly higher overall so far today.

Daily Pivot Point: 101.953
— S1 – 101.634
— S2 – 101.391
— S3 – 101.072
— R1 – 102.196
— R2 – 102.515
— R3 – 102.758


Weekly Pivot Points: USDJPY

SC USDJPY 2014.05.15

Prices are currently trading just over the weekly pivot point at time of writing. The USDJPY has been on an overall sideways trading path this week after opening the trading week virtually at the weekly pivot.

Weekly Pivot Point: 101.842
— S1 – 101.430
— S2 – 101.011
— S3 – 100.599
— R1 – 102.261
— R2 – 102.673
— R3 – 103.092


By CountingPips.com – Forex Trading Apps & Currency Trade Tools

Disclaimer: Foreign Currency trading and trading on margin carries a high level of risk and volatility and can result in loss of part or all of your investment. All information and opinions contained do not constitute investment advice and accuracy of prices, charts, calculations cannot be guaranteed.


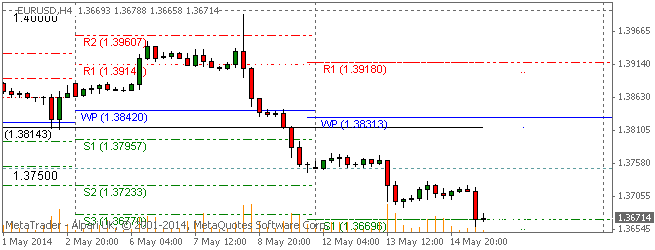
EURUSD Forex Trading Pivot Point Levels: Euro drops under 1.3700

2014.05.15 12:30 6:30AM ET | EURUSD Currency Pair

SC EURUSD 2014.05.15

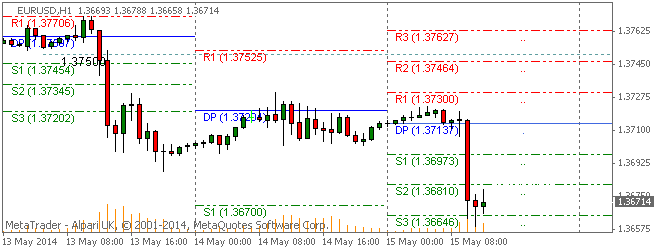
Here are the Pivot Points Levels with Support (S) and Resistance (R) for the EURUSD currency pair today. Price action is currently trading at the 1.36714 price level and under the daily pivot point, according to data at 6:30 AM ET. The EURUSD high for the day has been 1.37227 while the low of day has fallen to 1.36588. The pair earlier today opened the Asian trading session virtually on top of the daily pivot and has trended sharply lower today with prices declining to the S1 support level.

Daily Pivot Point: 1.37137
— S1 – 1.36972
— S2 – 1.36810
— S3 – 1.36645
— R1 – 1.37299
— R2 – 1.37464
— R3 – 1.37626


Weekly Pivot Points: EURUSD

SC EURUSD 2014.05.15

Prices are currently trading sharply under the weekly pivot point and right near the S1 support level at time of writing. The EURUSD has been on an overall bearish trend this week after opening the trading week below the weekly pivot.

Weekly Pivot Point: 1.38313
— S1 – 1.36695
— S2 – 1.35829
— S3 – 1.34211
— R1 – 1.39179
— R2 – 1.40797
— R3 – 1.41663


By CountingPips.com – Forex Trading Apps & Currency Trade Tools

Disclaimer: Foreign Currency trading and trading on margin carries a high level of risk and volatility and can result in loss of part or all of your investment. All information and opinions contained do not constitute investment advice and accuracy of prices, charts, calculations cannot be guaranteed.


Fibonacci Retracements Analysis 15.05.2014 (EUR/USD, USD/CHF)

Article By RoboForex.com

Analysis for May 15th, 2014

EUR USD, “Euro vs US Dollar”

Euro continues falling down without forming any serious corrections. Now main target is the group of lower fibo levels at 1.3595 – 1.3585. If later price rebounds from this target area, pair may start new correction.

As we can see at H1 chart, lower targets are confirmed by several fibo levels. According to analysis of temporary fibo-zones, predicted targets may be reached by the end of this week.

USD CHF, “US Dollar vs Swiss Franc”

Yesterday, Franc broke maximum. Most likely, in the nearest future pair will continue growing up towards the group of upper fibo levels at 0.8975 – 0.8995. If later price rebounds from these levels, bears may start new correction.

As we can see at H1 chart, current target area is confirmed by additional fibo levels. According to analysis of temporary fibo-zones, bulls may reach their predicted targets by Friday. During local correction, I opened short-term buy order with tight stop.

RoboForex Analytical Department

Article By RoboForex.com

Attention!
Forecasts presented in this section only reflect the author’s private opinion and should not be considered as guidance for trading. RoboForex LP bears no responsibility for trading results based on trading recommendations described in these analytical reviews.