USDJPY Forecast For March 31 – April 4

Article by Investazor.com

USDJPY had a great Friday and managed to close the week on green. The quotation stopped at resistance level from 102.80 after the whole week was on the downside. The macroeconomic data from Japan was predominantly good. The retail sales y/y beat the expectations while the unemployment fell from 3.7% to 3.6%. However, the household spending y/y was published way below the expected value, an aspect the markets did not ignore and it prompted some concerns.

The explanation for the appreciation of the Japanese yen in the first part of the week would be the geopolitical conflict between the US and Russia, a type of situation that encourages investors to buy safe haven assets. Also, you should take into consideration the reaction of the markets, which suggested through the price action that they are not so scared anymore of a war and hope that the tensions will be over and the two historic giants will make peace.

Economic Calendar

Manufacturing PMI (12:15 GTM)-Monday. It is a leading indicator of economic health and basically it is an index based on surveyed purchasing managers in the manufacturing industry. Above 50.0 indicates industry expansion whereas below indicates contraction. Last month the actual published value was 55.5.

The post USDJPY Forecast For March 31 – April 4 appeared first on investazor.com.

NZD/USD Forecast For March 31- April 4

Article by Investazor.com

Even though NZDUSD looked quite bearish for last week, the bulls were relentless and managed to push the price higher setting another annual high at 0.8700 from which it retraced a bit and closed the week at 0.8650. The one and only macroeconomic indicator for New Zeeland last week proved to be essential for bulls’ justification of raising the quotation as the trade balance came at the highest level since May 2011. As a result, the price itself was again pushed towards the highs of 2011.

These events made the governor of the central bank to react and to say that having into consideration the promising recovery New Zeeland economy is having and that exports are hurt by the strength of the NZD, we may see further interest rate hikes this year.

Economic Calendar

Building Consents m/m (10:45 GTM)-Sunday. This is a leading gauge of future construction activity because obtaining government approval is among the first steps in constructing a new building. It follows that this indicator measures the change in the number of new building approvals issued. Also, it is a medium impact indicator and lately it had fluctuant values. In February it was -8.3%, so it will draw some attention from the investors.

The post NZD/USD Forecast For March 31- April 4 appeared first on investazor.com.

EUR/GBP finds support at 0.8250; bounces higher

EUR/GBP daily trend was bearish until February when price touched 0.8158, the 61.8% Fibonacci retracement on the 2012-2013 uptrend. In the first half of March a secondary bullish signal appeared when the push towards 0.8400 helped establish a higher swing high. In the medium to long term, this underlines the weakness behind the recent bearish trend and that a larger correction or even a change to a large bullish trend is very likely. Fortunately for us, the technical landscape offers more then a few hints as to what can come next and which are the most important levels to watch right now.

Technical Analysis

EURGBP Daily Chart

Coupling Elliot Wave A-B-C retracement analysis with Fibonacci levels, the first push towards 0.8400 and 38.2% Fibonacci retracement level is the first corrective wave (A). (B) marks the search for a higher low, and 0.8249 is a very good candidate for this low. The support confluence in this area includes 61.8% retracement from 0.8157 to 0.8400, the 50-day Moving Average and the previous resistance trendline which is now offering support for the pair.

EURGBP 4H Chart

On the 4H chart, what looks like a bullish engulfing price action pattern can further confirm this bullish scenario if price will manage to close above 0.8282, the 200 Simple Moving Average, at the end of the European session or later in the US session.

The first short term resistance area can be found between 0.8327 and 0.8347. The medium to long term outlook for a bullish continuation targets 0.8400 and ultimately a new higher swing high, which could form at 50% retracement level and pivot zone 0.8642 or at 61.8% retracement level 0.8535.

If EUR/GBP fails to hold above the 0.8249 level for any reason, all uptrend scenarios will be invalidated, leading to another test of the main support at 0.8158.

*********
Prepared by Alexandru Z., Chief Currency Strategist at Capital Trust Markets


Wave Analysis 31.03.2014 (DJIA Index, Crude Oil)

Article By RoboForex.com

Analysis for March 31st, 2014

DJIA Index

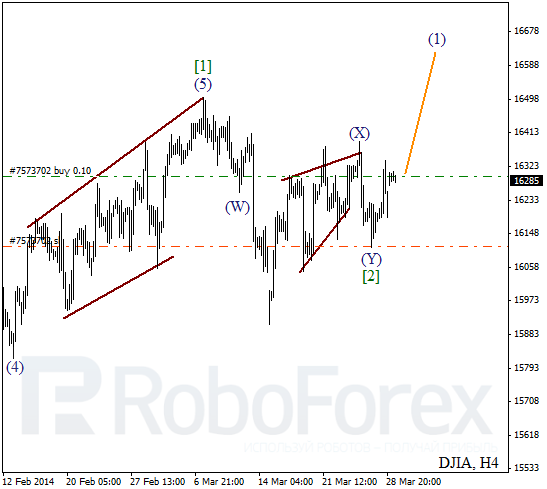
Possibly, wave [2] took the form of zigzag pattern with long flat pattern (X) inside it. Probably, on minor wave level price is forming initial ascending impulses, that’s why I opened buy order during local correction. Stop is placed at minimum, but I’m planning to move it into the black as soon as market starts moving upwards.

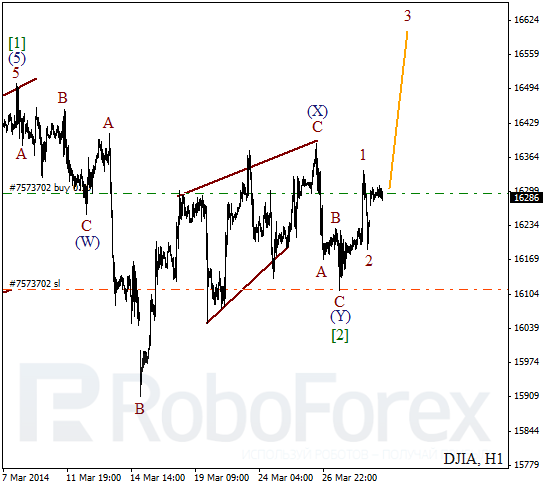
More detailed wave structure is shown on H1 chart. Probably, after completing zigzag pattern inside wave (Y), price formed bullish impulse. Probably, instrument may form extension inside wave 3 during the day.

Crude Oil

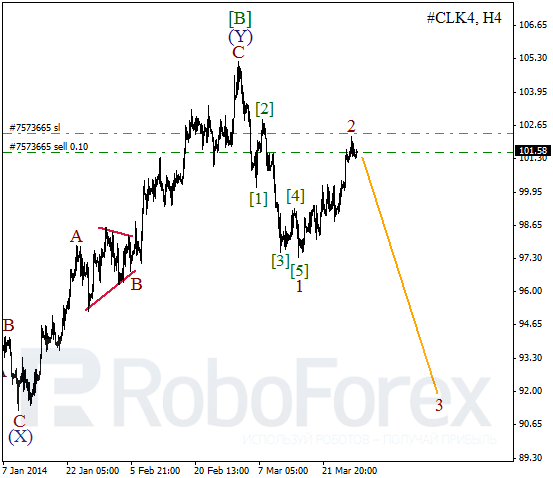
Probably, Oil is about to complete wave 2. Earlier price formed strong bearish impulse inside the first wave. I’ve already started selling carefully, because descending movement inside the third wave may be very fast.

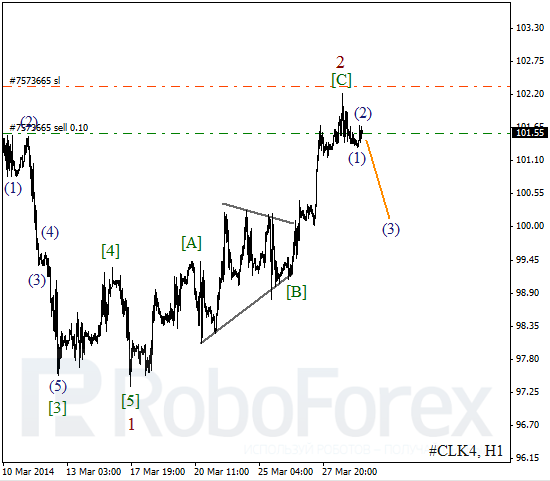
As we can see at the H1 chart, Oil formed zigzag pattern inside wave 2. On minor wave level, price completed initial impulse inside wave (1). After local correction, instrument is expected to start moving downwards inside the third wave.

RoboForex Analytical Department

Article By RoboForex.com

Attention!
Forecasts presented in this section only reflect the author’s private opinion and should not be considered as guidance for trading. RoboForex LP bears no responsibility for trading results based on trading recommendations described in these analytical reviews.


Japanese Candlesticks Analysis 31.03.2014 (EUR/USD, USD/JPY)

Article By RoboForex.com

Analysis for March 31st, 2014

EUR USD, “Euro vs US Dollar”

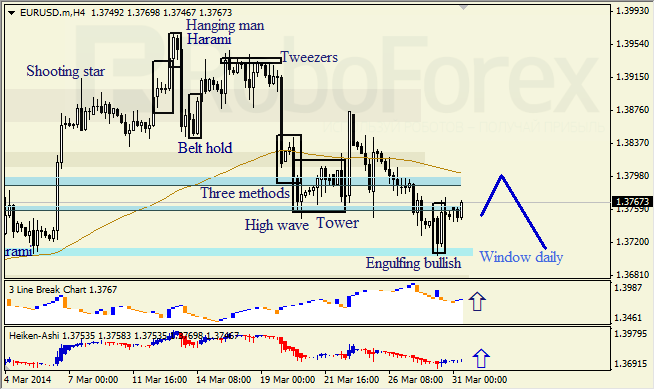
H4 chart of EUR USD shows ascending movement, which is indicated by Engulfing Bullish pattern near Window from daily chart. Upper Window and Moving Average 55 are resistance levels. Three Line Break chart and Heiken Ashi candlesticks confirm ascending movement.

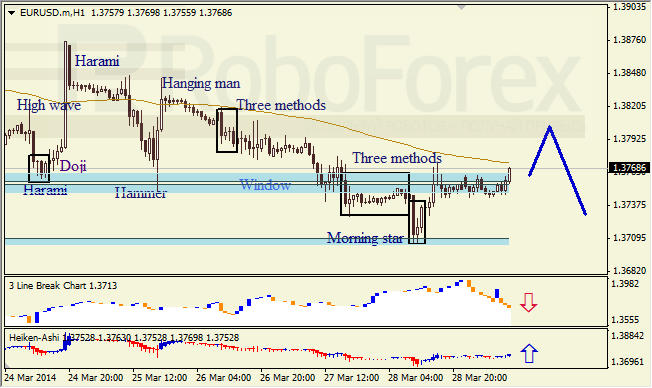
H1 chart of EUR USD shows bullish tendency within descending trend, which started after Morning Star pattern. Upper Window is broken; now it’s support level. Three Line Break chart indicates current trend; Heiken Ashi candlesticks confirm ascending movement.

USD JPY, “US Dollar vs Japanese Yen”

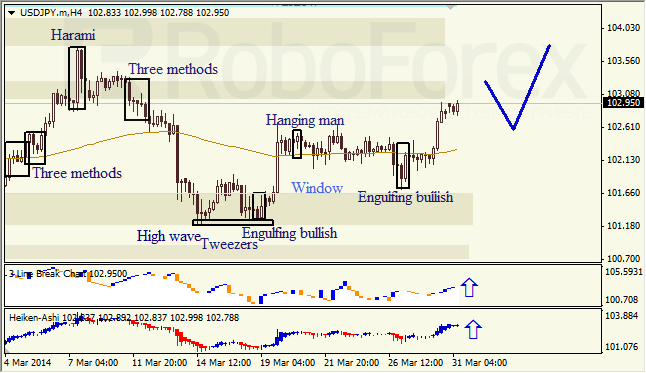
H4 chart of USD JPY shows ascending tendency, which is indicated by Engulfing Bullish pattern. Three Line Break chart and Heiken Ashi candlesticks confirm ascending movement.

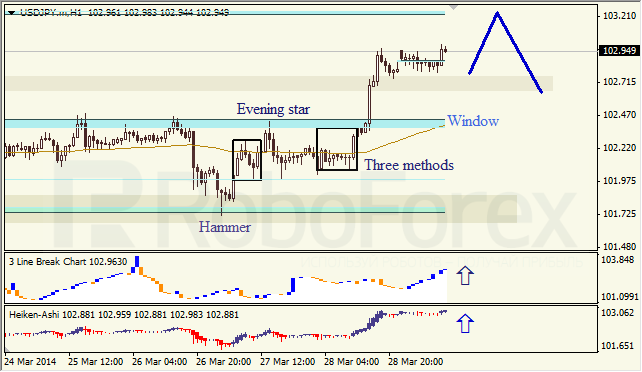
H1 chart of USD JPY shows resistance from upper Window; price may form bearish patterns near it. Three Line Break chart and Heiken Ashi candlesticks confirm ascending movement.

RoboForex Analytical Department

Article By RoboForex.com

Attention!
Forecasts presented in this section only reflect the author’s private opinion and should not be considered as guidance for trading. RoboForex LP bears no responsibility for trading results based on trading recommendations described in these analytical reviews.


EURUSD Price Action For March 31

Article by Investazor.com

The EURUSD quotation was rejected from 1.3700, last Friday. Not it is trading sideways above 1.3745. A break above the local resistance could signal a continuation of the rally to 1.3800, while a break and close, on a 60 minutes chart, bellow the current support could mean another test on 1.3700. The Rising Wedge that is drawn could be a strong bearish signal in case of confirmation.

The post EURUSD Price Action For March 31 appeared first on investazor.com.

Fiji holds rate on comfortable inflation, reserve outlook

By CentralBankNews.info
    Fiji’s central bank maintained its Overnight Policy Rate at 0.5 percent, steady since November 2011, saying the current policy stance “was appropriate as the outlook for foreign reserves and inflation is comfortable.”
    Barry Whiteside, governor of the Reserve Bank of Fiji, added in a statement issued today after a monthly board on meeting on March 28 that the accommodative policy stance would be re-aligned if there are challenges to the bank’s twin core objectives of foreign reserves and inflation.
    Inflation in Fiji fell to 0.2 percent in February, the lowest since April 2009, from 2.3 percent in January. The central bank attributed to drop in inflation to free primary and secondary education that was announced in the 2014 national budget.
    Fiji’s foreign reserves were estimated at US$1.705 billion as of March 28, enough for 4.5 months of goods, and down from $1.763 billion as of Jan. 30.

    http://ift.tt/1iP0FNb

US Economy With More to Lose in the Future of Financial Warfare

By MoneyMorning.com.au

It’s been a busy morning, at the World War D conference. By 10am, Marc Faber had wrapped with his ideas and we were onto the next presenter.

Jim Rickards, author of Currency Wars, entered the stage to an excited crowd.

Rickards is always great to watch. He presented last year to a select group of Port Phillip Publishing readers. He is always generous sharing his experience and ideas with investors.

To kick start his 40 minute slot, he started talking about when he worked with the US government to create financial disaster scenarios in 2009. Currency Wars is dedicated to his ‘financial war games’.

As he explained, at the time, the government had no idea just how serious the financial threats were to the US economy

You see, government officials understood what could happen with things like guns and bombs. But with today’s integrated market, the destruction caused by financial warfare is so much bigger than they understand.
It’s not just a metaphor according to Rickards. It’s a very real threat to big economies. However right now, America is most at risk.

One thing, Rickards said was that because of the financial warfare risks, it’s vital for fundamental investors not to ignore global macro events.

More than ever, he said, these events can affect your portfolio.

He used the current problems with Ukraine and Russia as an example.

Rickards suggested that America sending troops into Ukraine isn’t an option. And that’s not because Russia has big bombs, because the US has big bombs too. Simply put, Russia could crush the US’s financial markets. And while any financial warfare would hurt Russia, it would hurt America’s economy much more.

That’s what Rickards meant by financial warfare…

How would they do it?

If America really wanted to hurt Russia, they could start with seizing Vladimir Putin’s American assets. The next step could be to push Russia out of the dollar standard – like America did with Iran a few years ago.

But the problem is, the destruction from Russia could be so much worse.

The first step, Rickards estimates, could be something as simple as refusing to pay debt. If Russia refused to pay dollar-denominated debt, that would drive up interest rates in the US. This would have major flow through effects in the US economy.

Already the housing market in the US is precarious. Large interest rate swings could cause it to collapse. And the housing stock, dependant on easy and cheap credit, would topple.

But Rickards says it could be much more sinister than that.

This is a day and age of technology warfare. And the financial warfare wouldn’t be as simple as just not paying a few debts.

Russia could bring down the financial markets in the US with a bunch of hackers. Rickards says that although the US could also attack the Russian market with hackers, who do you think has more to lose?

The Russian market shutting down would hurt some investors…however the US market closing down would be catastrophic for the American economy.

Another topic Rickards touched on was the ‘liquidity trap’.

He says that central bankers are printing money as much as they can to keep the system afloat. The problem is, while the money supply may be increasing, the velocity of money is falling.

Why is the velocity of money relevant? Well, as Rickards explained to the raptured audience, people aren’t spending their money. He said they are more interested in staying at home and keeping what few dollars they have.

In order to get the velocity of money going, the central bankers have to work out how to get people to leave their house to spend it. As yet, US Federal Reserve chairman Janet Yellen or her predecessor hasn’t solved this problem.

A bigger concern to investors though, Rickards reckons is the deflation and inflation tug of war.

He knows that the central bankers have only planned for inflation to win. You know why?

Because deflation isn’t good for governments.

Rickards explained it this way:

Imagine prices go down 10%, but your wage stays the same. Even though you’re not making any more money, your purchasing power actually increases.

‘The problem is, the government can’t tax purchases anymore. So they don’t benefit,’ said Rickards.

However, Rickards added that the other problem with deflation is that it makes the debts too large to pay back. When this happens, people would rather default on their debts. With a debt laden banking system, the central bankers know this simply isn’t an option.

Which means Yellen, who is hell bent on inflation driving policies will keep printing money. As Rickards said, ‘It’s the wrong medicine to begin with, but she will administer it until the patient dies.’

Rickards finished up with possible ideas on what a return to sound money could look like. But his vital message for the audience was this: Pay attention to the global macro events. They will affect your portfolio.

And watch out for those nasty central bankers.

Shae Smith+
Contributing Editor, Money Morning

Join Money Morning on Google+


By MoneyMorning.com.au

Dr Marc Faber: The Terminal Phase of a Credit and Asset Bubble

By MoneyMorning.com.au

In the gilded ballroom of Hyatt’s Savoy ballroom, World War D‘s opening speaker Dr Mark Faber delivered a blunt message: the old world order is over.

The US reached a peak in prosperity and influence in the world in the 1950s or 1960s,’ said Faber. But since the 70s the superpower has been locked into a cycle of bubbles, busts and growing debt.

Debt, and the way it has manipulated the global economy, was the main theme of Faber’s address.

There are some people who claim to be economists who will tell you debts do not matter,’ Faber told the packed ballroom.

But the real story is different….

Faber explained the flaw at the heart of expansionary monetary policy (such as QE). ‘When you drop dollar bills into the economy…it won’t lift all prices and assets equally at the same time,’ he said. In the 60s and 70s, extra money flowing through the economy inflated wages; in the early 2000s, money printing inflated commodities. But, Faber points out, this price and asset growth is never equal.

In other words, money printing creates more bubbles. Some assets go up, they overshoot, collapse and cause significant damage which necessitates, in the view of the US Federal Reserve, more money printing. It is a vicious cycle we’ve seen since the 70s: each time there was an economic problem, the Fed printed money and created more distortions.

Bernanke’s tenure saw this trend continue, and when it came to assessing the former Fed chairman, Faber didn’t mince his words.

 ’He’s been a disaster,‘ Faber said drily. Faber pointed out that not only did Bernanke not notice the subprime disaster, he actually helped create it. ‘Under his tenure at the Federal Reserve and under his intellectual influence when working for Mr Greenspan they created the gigantic housing bubble,‘ he said.

At the heart of this expansion in debt, and cycle of bubbles and busts is the reliance of the US economy on consumption. For the last century, policy makers have encouraged consumption on all levels of society including government, and discouraged savings.

But according to Faber, consumption doesn’t create a strong economy. ‘Wealth doesn’t come from consumerism, it comes from capital spending,‘ he said.

And the problem for the US economy is that while debt has continued to rise, capital investment hasn’t. In fact, it’s been falling sharply for a long time.

If we have growing debts, there’s a difference in quality of those debts,‘ he said.  Japan, South Korea and Taiwan used their debts to invest in factories, plants…investments that generated wealth. According to Faber however, the US has just acquired debt to fuel consumption. ‘Where’s the future income?‘ he asked.

Faber used this as an opportunity to strike a note of caution for Australia, warning the room that one day Australia’s indebted housing sector won’t be able to borrow much more. It will then enter a period of contraction or very slow growth.

That was his warning to Australia: then came the opportunity.

We live in a new word. We live in a world where the balance of power has shifted to emerging countries,’ said Faber.

He was of course, talking about China. While China’s growth story is well known, Faber gave the audience an important geopolitical sub story.

China’s massive growth triggered massive commodity export booms in emerging economies. China’s real success was exporting the products it produced back to emerging economies. This has created a significant shift in the global economy: exports from China to emerging countries are higher than exports to the US or Europe.

‘This is the new world, where the old world is largely bypassed,’ said Faber.  While most of the media debates whether the US will grow, Faber argues it will have no impact on the world, as China has a much greater influence now than the US.

Faber is no bull on China however, and warned he would be very careful about investing there. Faber sees conditions at the present time as much worse than many people realise. There are also geopolitical concerns that are often left unexamined.

Take oil. Oil consumption in China – most of which comes from the Middle East – will rise. ‘The Middle East in my opinion will go up in flames at some point, that will be an unpleasant event,‘ predicted Faber in his typically apocalyptic but still understated way.

For Australia, he sees opportunities in the huge numbers of Chinese tourists travelling abroad, but he believes Australia has made a huge mistake by tolerating US bases on its continent. ‘China will not sit by and let themselves be bossed around by the US,‘ he said.

His final message reiterated the failure of the US Federal Reserve. Corporate profits had been boosted by artificially low interest rates; wealth inequality is on the rise; and to compound it all, he says the Fed won’t raise interest rates anytime soon.

Punctuated by flashes of humour and dire warnings, it was a sober message that the attentive audience lapped up.

Callum Denness
Roving Reporter for Money Morning Australia at World War D

Join Money Morning on Google+


By MoneyMorning.com.au

USDCAD remains in downtrend from 1.1278

USDCAD remains in downtrend from 1.1278, the rise from 1.1000 would possibly be consolidation of the downtrend. Key resistance is at 1.1100, as long as this level holds, the downtrend could be expected to resume, and next target would be at 1.0950 area. On the upside, a break above 1.1100 resistance will indicate that the downtrend from 1.1278 had completed at 1.1000 already, then the following upward movement could bring price to 1.1500 zone.

usdcad

Provided by ForexCycle.com