Namibia keeps rate on “encouraging” 2014 prospects

By CentralBankNews.info
    Namibia’s central bank maintained its repo rate at 5.50 percent, saying the country’s economy performed broadly satisfactory in the first two months of this year and “the prospects for 2014 are encouraging as economic growth is expected to continue and inflation will remain at sustainable levels.”
    The Bank of Namibia, which last cut its rate in August 2012, maintained its forecast for the economy to expand by 5.3 percent in 2014, supported by a a continued expansion of construction activities and mining – mainly diamond mining – along with strong growth in consumer demand.
    In the fourth quarter of 2013 Namibia’s Gross Domestic Product grew by 4.3 percent from the third quarter for annual growth of 5.1 percent, down from 13.6 percent in the third quarter. In 2013 growth averaged 4.3 percent and the International Monetary Fund forecasts 4.3 percent growth in 2014.
   Namibia’s inflation rate rose to 5.3 percent in March from 5.13 percent the previous month, for average first quarter inflation of 5.1 percent, below 6.0 percent in the same 2013 quarter.
    “Inflation is anticipated to increase slightly in the second quarter of 2014, although it is expected to remain below 6 percent,” the central bank said.

     In February the central bank said inflation this year was projected to rise to 6 percent from 5.6 percent in 2013, with upside risks mainly from a depreciation of the Namibian dollar.
     Annual growth rate in domestic private sector extension picked up to 15.6 percent in February from 14.3 percent in January and December, mainly due to higher growth in credit to the business sector, mainly overdraft and installment credit. Strong growth in household credit reflects high growth in mortgage loans.
    Namibia’s international reserves were N$17.5 billion as of April 11, a level the central bank said was sufficient to maintain the fixed one-to-one exchange rate peg to South Africa’s rand. At the end of January Namibia’s reserves stood at N$18.2 billion.
    “Going forward, the rapid growth of imports and the sustained double-digit growth rate in installment credit may put pressure on reserves, thus warranting monitoring,” the central bank said.
    In February the central bank also warned about strong growth in installment growth for individuals and said it had started targeted intervention to slow it down.
    With its fixed exchange rate regime, Namibia’s dollar largely mirrors changes in South Africa’s rand. Both currencies have depreciated against the U.S. dollar since early 2011 and last year the N$ fell 19 percent against the USD as capital flowed back to advanced economies in anticipation of the U.S. Federal Reserve’s gradual withdrawal of asset purchases and stronger growth.
    The N$ continued to drop through January but since then it has rebounded as financial markets have calmed. For the year, the N$ is down less than 1 percent, trading at 10.47 to the U.S. dollar today.
   
    http://ift.tt/1iP0FNb


Intel Sales May Come in Higher Than Forecasted

By HY Markets Forex Blog

Multinational semiconductor chip-maker, Intel Corp, second-quarter sales are expected to come in higher than analysts’ forecasts as the company’s improving corporate orders help to control the drop in the personal-computer market.

According to the company’s official website, the company’s income will be $13 billion, plus or minus $500 million, while gross margin of sales will come in at approximately 63%. Sales were forecasted to come in at around $12.96 billion and gross margin of 59.8% according to analysts.

“Once people got into the mode of upgrading, they decided to take a closer look at their current assets,” said Ing, who has the equivalent of a hold rating on Intel’s stock. “It goes well beyond the XP obsolescence.”

Intel shares climbed to $27.85 in extending trading. The stock gained less than 1% to $26.77 at the time of writing in New York, compared with the 3.4% drop in Nasdaq Composite Index.

As the PC market heads towards its third annual decline, the Chief Executive Officer of Intel Brian Krzanich has grown the mobile market by trying to crack the market with Intel for over a decade. Brian is working on starting to grow Intel’s progress outside the PC market, such as phones, tablets and so on.

According to a statement released by the company earlier today, Krzanich has promised to increase Intel’s products to 40 million units this year. Intel shipped around 5 million tablet processors in the first quarter, the statement confirmed.

Intel’s revenue in PC-chip business dropped to $7.94 billion, while operating profit in the same division increased to $2.8 billion.


Visit www.hymarkets.com   to find out more about our products and start trading today with only $50 using the latest trading technology today

The post Intel Sales May Come in Higher Than Forecasted appeared first on | HY Markets Official blog.

Article provided by HY Markets Forex Blog

WTI Crude Climbs While Ukraine Remain In Focus

By HY Markets Forex Blog

The North American West Texas Intermediate (WTI)  crude was seen trading higher on Wednesday after reports from China showed that the country’s economy was growing at a slower pace, while the escalating tensions in Ukraine continues to remain in focus.

WTI crude for May delivery climbed 0.19% higher to $103.95 at the time of writing on the New York Mercantile Exchange. At the same time the European benchmark Brent crude for June settlement dropped 0.06% lower to stand at $109.30 a barrel on the London-based ICE Futures Europe exchange.

China GDP

Fresh data from the National Bureau of statistics released on Wednesday showed that China’s economy was expanding at the weakest pace, climbing by 7.4% in the January to March quarter, compared to analysts estimates of 7.3% and lower than the previous quarter figures of 7.7%.

China, the world’s second-biggest oil consumer is forecasted to account for approximately 11% of global demand this year, while the US is expected to account for 21%, according to reports from the International Energy Agency in France.

Escalated Tensions in Ukraine

Following the escalated crises over the weekend, officials from the Western nations and Russia continue to accuse each other over the violence. The US President Barack Obama issued another warning against Russia that any further intervention in Ukraine would cause tougher consequences, as the EU and the US prepare to issue further sanctions against the country.

According to the North Atlantic Treaty Organization, Russia has about 40,000 troops along Ukraine’s border after its annexation of Crimea last month.

US Crude Inventories

Crude supplies in the US climbed by 7.6 million barrels in the week ending April 11, rising above analysts’ estimates of 2.3 barrels, according to reports from the American Petroleum Institute (API).

A separate weekly oil report is expected to be released by the Energy Information Administration later in the day, with forecasts of a rise for the twelfth time in thirteen weeks.

Gasoline inventories are predicted to have fallen by 1.75 million barrels, while distillate supplies, including heating oil and diesel, probably remained unchanged.


Visit www.hymarkets.com   to find out more about our products and start trading today with only $50 using the latest trading technology today

The post WTI Crude Climbs While Ukraine Remain In Focus appeared first on | HY Markets Official blog.

Article provided by HY Markets Forex Blog

GBPUSD: On The Offensive, Closes In On The 1.6819/22 Levels

GBPUSD: With GBP recovering higher and threatening the 1.3819/22 levels, further strength is envisaged. The pair needs to decisively break and hold above here to trigger further bullish offensive towards the 1.6877 level. Further out, resistance resides at the 1.6900 level where a break will aim at the 16950 level and then its big psycho level at the 1.7000 level. Its daily RSI is bullish and pointing higher supporting this view. On the downside, support lies at the 1.6719 level where a breach will aim at the 1.6683 level with a cut through here allowing further downside towards the 1.6600 level. Further down, support stands at the 1.6550 level and then the 1.6500 level. On the whole, GBP continues to retain its upside bias.

Article by www.FXtechstrategy.com


Gold Futures Halted Again On Latest Furious Slamdown

By Jason Hamlin, www.goldstockbull.com

They are not even trying to hide the gold manipulation these days. You would think with the recent spotlight on gold price fixing and lawsuit filed in March, the manipulators would at least retreat into the shadows for a few months. But this is not the case, as they chose tax day for the largest slam down of 2014.

This action is clearly not-for-profit selling, which can only be interpreted as price manipulation. The regulators are bought off and/or appointed by the banks that are doing the manipulating. Long-term investors of physical metals need not worry too much about this action, but those trying to play the futures market or hedge positions are getting scalped.

Zerohedge.com reports:

It seems the two words “fiduciary duty” are strangely missing from the dictionary of the new normal’s asset management community. This morning, shortly before 8:27am ET, someone decide that it was the perfect time to dump thousands of Gold futures contracts worth over half a billion dollars notional. This smashed Gold futures down over $12 instantaneously, breaking below the 200DMA and triggered the futures exchange to halt trading in the precious metal for 10-seconds. Palladium also got clobbered and was also halted. This is gold’s worst since Bernanke ‘tapered’ in December.

As Nanex exposes in great detail…

1. June 2014 Gold (GC) Futures on April 15, 2014
Note the 10 second halt.

gold manipulation


By Jason Hamlin, www.goldstockbull.com


Thoughts from the Frontline: Every Central Bank for Itself

By John Mauldin


“Everybody has a plan until they get punched in the face.”

– Mike Tyson

For the last 25 days I’ve been traveling in Argentina and South Africa, two countries whose economies can only be described as fragile, though for very different reasons. Emerging-market countries face a significantly different set of challenges than the developed world does. These challenges are compounded by the rather indifferent policies of developed-world central banks, which are (even if somewhat understandably) entirely self-centered. Argentina has brought its problems upon itself, but South Africa can somewhat justifiably express frustration at the developed world, which, as one emerging-market central bank leader suggests, is engaged in a covert currency war, one where the casualties are the result of unintended consequences. But the effects are nonetheless real if you’re an emerging-market country.

While I will write a little more about my experience in South Africa at the end of this letter, first I want to cover the entire emerging-market landscape to give us some context. Full and fair disclosure requires that I give a great deal of credit to my rather brilliant young associate, Worth Wray, who’s helped me pull together a great deal of this letter while I am on the road in a very busy speaking tour here in South Africa for Glacier, a local platform intermediary. They have afforded me the opportunity to meet with a significant number of financial industry participants and local businessman, at all levels of society. It has been a very serious learning experience for me. But more on that later; let’s think now about the problems facing emerging markets in general.

Every Central Bank for Itself

Every general has a plan before going into battle, which immediately begins to change upon contact with the enemy. Everyone has a plan until they get hit… and emerging markets have already taken a couple of punches since May 2013, when Fed Chairman Ben Bernanke first signaled his intent to “taper” his quantitative easing program and thereby incrementally wean the markets off of their steady drip of easy money. It was not too long after that Ben also suggested that he was not responsible for the problems of emerging-market central banks – or any other central bank, for that matter.

As my friend Ben Hunt wrote back in late January, Chairman Bernanke turned a single data point into a line during his last months in office, when he decided to taper by exactly $10 billion per month. He established the trend, and now the markets are reacting as if the Fed’s exit strategy has officially begun.

Whether the FOMC can actually turn the taper into a true exit strategy ultimately depends on how much longer households and businesses must deleverage and how sharply our old-age dependency ratio rises, but markets seem to believe this is the beginning of the end. For now, that’s what matters most.

Under Fed Chair Janet Yellen’s leadership, the Fed continues to send a clear message to the rest of the world: Now it really is every central bank for itself.

The QE-Induced Bubble Boom in Emerging Markets

By trying to shore up their rich-world economies with unconventional policies such as ultra-low rate targets, outright balance sheet expansion, and aggressive forward guidance, major central banks have distorted international real interest rate differentials and forced savers to seek out higher (and far riskier) returns for more than five years.

This initiative has fueled enormous overinvestment and capital misallocation – and not just in advanced economies like the United States.

As it turns out, the biggest QE-induced imbalances may be in emerging markets, where, even in the face of deteriorating fundamentals, accumulated capital inflows (excluding China) have nearly DOUBLED, from roughly $5 trillion in 2009 to nearly $10 trillion today. After such a dramatic rise in developed-world portfolio allocations and direct lending to emerging markets, developed-world investors now hold roughly one-third of all emerging-market stocks by market capitalization and also about one-third of all outstanding emerging-market bonds.

The Fed might as well have aimed its big bazooka right at the emerging world. That’s where a lot of the easy money ran blindly in search of more attractive real interest rates, bolstered by a broadly accepted growth story.

The conventional wisdom – a particularly powerful narrative that became commonplace in the media – suggested that emerging markets were, for the first time in a long time, less risky than developed markets, despite their having displayed much higher volatility throughout the past several decades.

As a general rule, people believed emerging markets had much lower levels of government debt, much stronger prospects for consumption-led growth, and far more favorable demographics. (They overlooked the fact that crises in the 1980s and 1990s still limited EM borrowing limits until 2009 and ignored the fact that EM consumption is a derivative of demand and investment from the developed world.)

Instead of holding traditional safe-haven bonds like US treasuries or German bunds, some strategists (who shall not be named) even suggested that emerging-market government bonds could be the new safe haven in the event of major sovereign debt crises in the developed world. And better yet, it was suggested that denominating these investments in local currencies would provide extra returns over time as EM currencies appreciated against their developed-market peers.

Sadly, the conventional wisdom about emerging markets and their currencies was dead wrong. Herd money (typically momentum-based, yield-chasing investors) usually chases growth that has already happened and almost always overstays its welcome. This is the same disappointing boom/bust dynamic that happened in Latin America in the early 1980s and Southeast Asia in the mid-1990s. And this time, it seems the spillover from extreme monetary accommodation in advanced countries has allowed public and private borrowers to leverage well past their natural carrying capacity.

Anatomy of a “Balance of Payments” Crisis

The lesson is always the same, and it is hard to avoid. Economic miracles are almost always too good to be true. Whether we’re talking about the Italian miracle of the ’50s, the Latin American miracle of the ’80s, the Asian Tiger miracles of the ’90s, or the housing boom in the developed world (the US, Ireland, Spain, et al.) in the ’00s, they all have two things in common: construction (building booms, etc.) and excessive leverage. As a quick aside, does that remind you of anything happening in China these days? Just saying…

Broad-based, debt-fueled overinvestment may appear to kick economic growth into overdrive for a while; but eventually disappointing returns and consequent selling lead to investment losses, defaults, and banking panics. And in cases where foreign capital seeking strong growth in already highly valued assets drives the investment boom, the miracle often ends with capital flight and currency collapse.

Economists call that dynamic of inflow-induced booms followed by outflow-induced currency crises a “balance of payments cycle,” and it tends to occur in three distinct phases.

In the first phase, an economic boom attracts foreign capital, which generally flows toward productive uses and reaps attractive returns from an appreciating currency and rising asset prices. In turn, those profits fuel a self-reinforcing cycle of foreign capital inflows, rising asset prices, and a strengthening currency.

In the second phase, the allure of promising recent returns morphs into a growth story and attracts ever-stronger capital inflows – even as the boom begins to fade and the strong currency starts to drag on competitiveness. Capital piles into unproductive uses and fuels overinvestment, overconsumption, or both; so that ever more inefficient economic growth increasingly depends on foreign capital inflows. Eventually, the system becomes so unstable that anything from signs of weak earnings growth to an unanticipated rate hike somewhere else in the world can trigger a shift in sentiment and precipitous capital flight.

To continue reading this article from Thoughts from the Frontline – a free weekly publication by John Mauldin, renowned financial expert, best-selling author, and Chairman of Mauldin Economics – please click here.


EUR/AUD Break-Out Imminent

Technical Sentiment: Bullish

Key Takeaways

  • EUR/AUD fails to make a lower low;
  • Pair enters a triangle chart pattern;
  • Sentiment bias is slightly bullish ahead of news.

EUR/AUD is increasingly developing a bullish technical sentiment, yet confirmation is still required. The current downtrend failed to provide a lower swing low, as price rose above the bearish trendline from March and is now within reach of the main resistance area. If European data does not disappoint too much, a rally above 1.4850 will confirm the reversal of the current trend.


Trend reversal scenario

EURAUD 4H 16th April

Last week EUR/AUD offered a perfect rejection from 1.4850 – based off the 200-Day Moving Average and the trendline from March – making a higher low in the process. The rejection itself was signaled by a Bearish Engulfing Bar on the 4H chart (and a small bearish Pin bar on the Daily timeframe). Even with such a nice display from the sellers, the pair failed to beat the weekly low at 1.4653.

In a strong bearish trend, as it is the case right now, any failure to continue making lower swing lows is immediately perceived as a sign of weakness. Buyers are currently seeking to test the resistance between 1.4822 (triangle trendline, 200-Day Moving Average) and 1.4850 (previous high, 100 Simple Moving Average on 4H chart).

A break-out and close above 1.4850 will signal the trend is now bullish, opening the way higher. Main resistance levels:

  1. 1.4955 – resistance from late March, beginning of April.
  2. 1.4990 – 38.2% Fibonacci Retracement from 1.5536 down to 1.4653
  3. 1.5100 – February 2013 Low and strong Fibonacci Confluence


Without corrections, trend continuation is limited

If EUR/AUD fails to breach the resistance, the triangle chart pattern remains valid and prices will continue to adopt a range personality. A bearish break of the triangle is a viable trading opportunity as well, yet the lack of correction in the trend thus far and oversold conditions could limit further drops to 1.4530 area.

*********
Prepared by Alexandru Z., Chief Currency Strategist at Capital Trust Markets


Fibonacci Retracements Analysis 16.04.2014 (EUR/USD, USD/CHF)

Article By RoboForex.com

Analysis for April 16th, 2014

EUR USD, “Euro vs US Dollar”

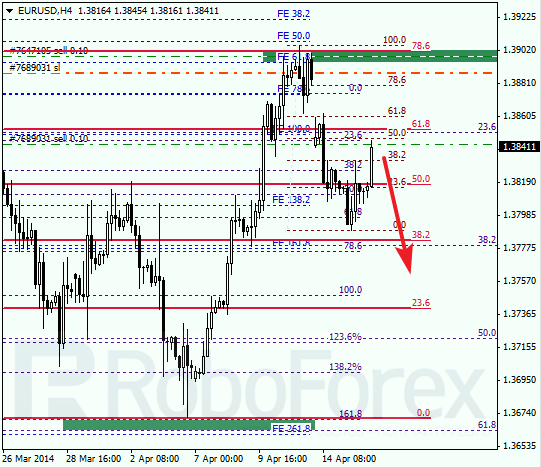
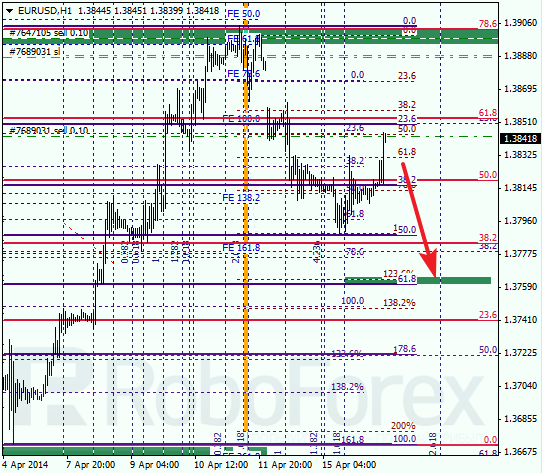
After rebounding from the group of upper fibo levels, Eurodollar started new descending movement. During current pullback, which has already reached local correctional level of 50%, I opened another buy order. In the nearest future, market is expected to reverse downwards and break minimum.

As we can see at H1 chart, pair rebounded from the group of upper fibo levels right inside temporary fibo-zone. Main target for bears is at local level of 61.8% (1.3760). If pair breaks this level, price will continue moving towards level of 78.6% (1.3720) to test it from above.

USD CHF, “US Dollar vs Swiss Franc”

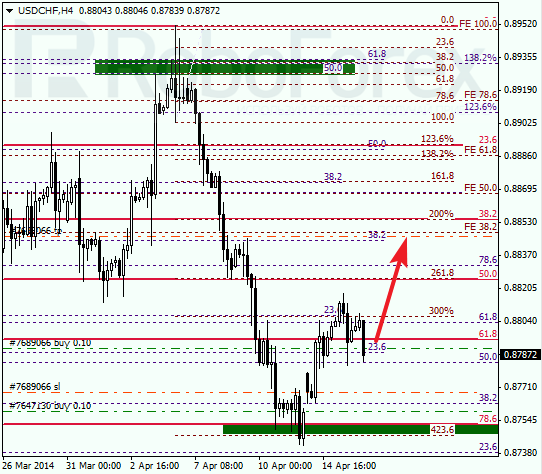
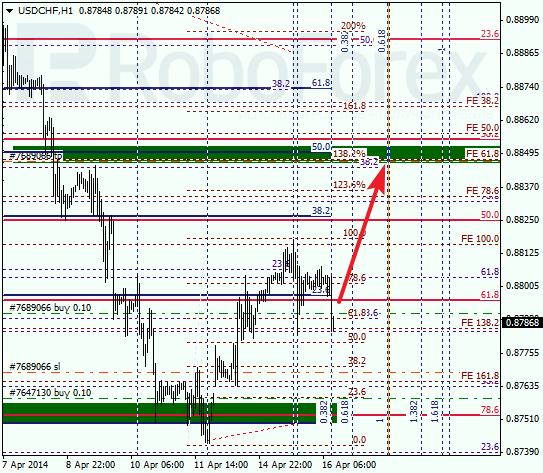
After rebounding from the group of lower fibo levels, market started moving upwards. During correction, I opened another buy
order. Price may yet consolidate for a while, but later it is expected to break previous maximum.

As we can see at H1 chart, possibly price may reach local correctional level of 50% (0.8780). If later price rebounds from it, market may start new ascending movement towards the group of fibo levels (0.8845 – 0.8855) near level of 50%.

RoboForex Analytical Department

Article By RoboForex.com

Attention!
Forecasts presented in this section only reflect the author’s private opinion and should not be considered as guidance for trading. RoboForex LP bears no responsibility for trading results based on trading recommendations described in these analytical reviews.


Wave Analysis 16.04.2014 (EUR/USD, GBP/USD, USD/CHF, USD/JPY)

Article By RoboForex.com

Analysis for April 16th, 2014

EUR USD, “Euro vs US Dollar”

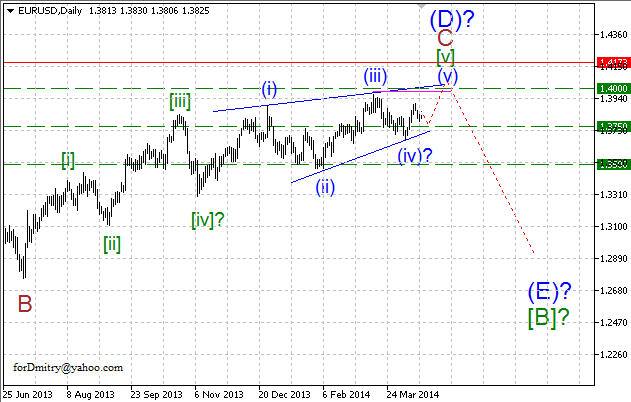
Probably, Euro is finishing diagonal triangle [v] of C of (D) of ascending zigzag (D) of [B], which may be followed by final descending zigzag (E) of [B].

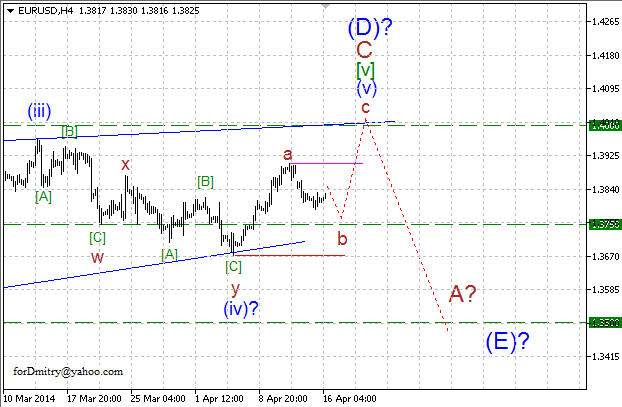
Probably, price is forming final ascending zigzag (v) of [v] of C of (D). Pair has already finished ascending impulse a of (v) of [v] of C of (D) and right now is forming descending correction b of (v) of [v] of C of (D).

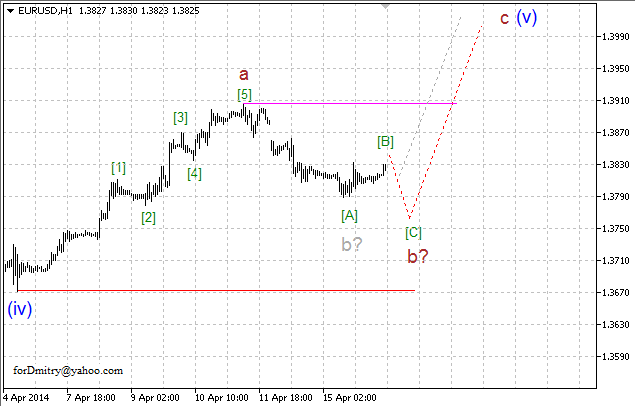
Possibly, pair is completing local descending correction b of (v) in the form of zigzag, which may be followed by ascending wave c of (v).

GBP USD, “Great Britain Pound vs US Dollar”

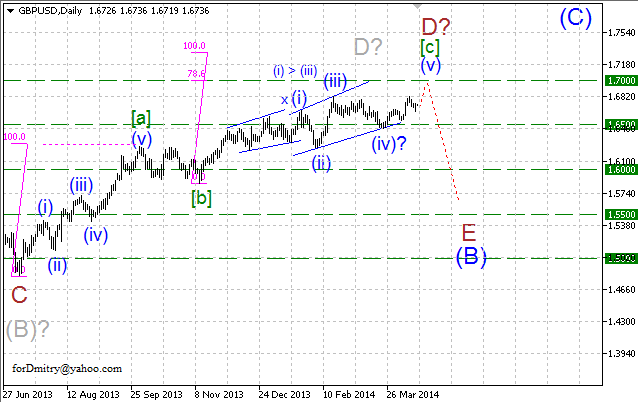
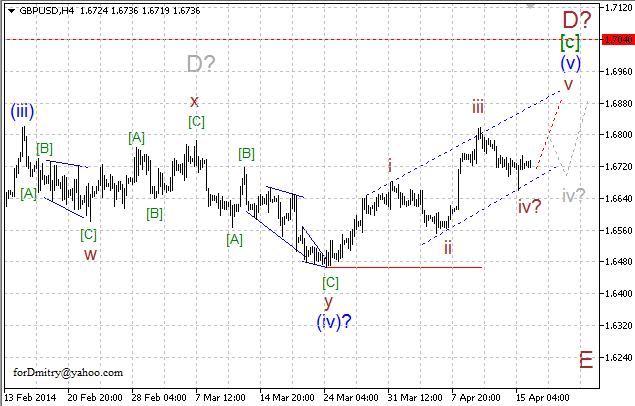
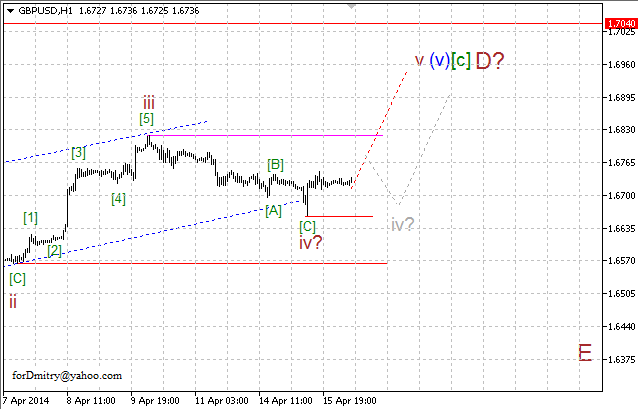
Probably, Pound is completing final wedge [c] of D of ascending zigzag D of (B) with extension in its first wave (i) of [c]. After completing zigzag D of (B), price is expected to start final descending zigzag E of (B).

Probably, pair is finishing final ascending impulse (v) of [c] of D. Right now, price is forming ascending wave v of (v) of [c].

It looks like price is starting to form final ascending wave v of (v). However, this assumption hasn’t been confirmed yet, and pair may still be forming correction iv of (v) in the form of long horizontal pattern.

USD CHF, “US Dollar vs Swiss Franc”

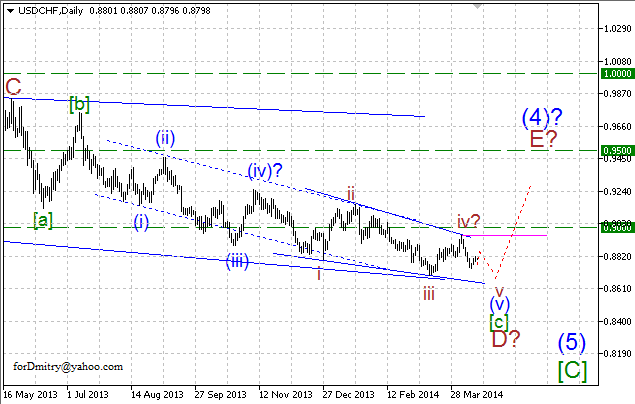
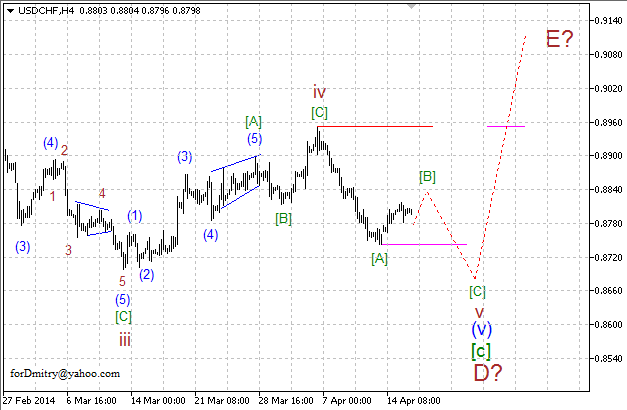
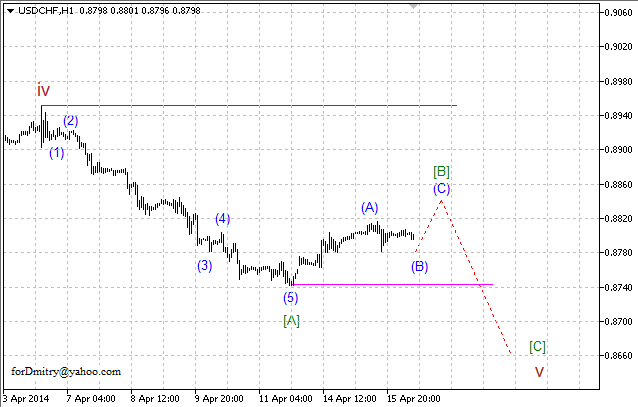
Probably, Franc is completing diagonal triangle (v) of [c] of D of descending zigzag D of (4), which may be followed by final ascending zigzag E of (4).

Probably, price is forming final descending zigzag v of (v) of [c] of D. Pair is completing local ascending correction [B] of v, which may be followed by descending wave [C] of v.

Possibly, price is finishing ascending correction [B] of v in the form of zigzag, which may be followed by descending impulse or diagonal triangle [C] of v.

USD JPY, “US Dollar vs Japanese Yen”

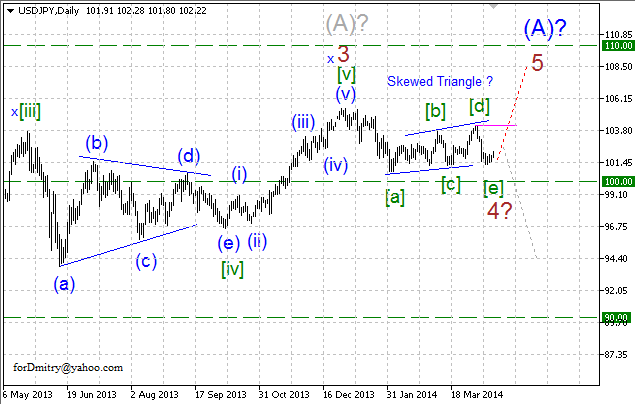
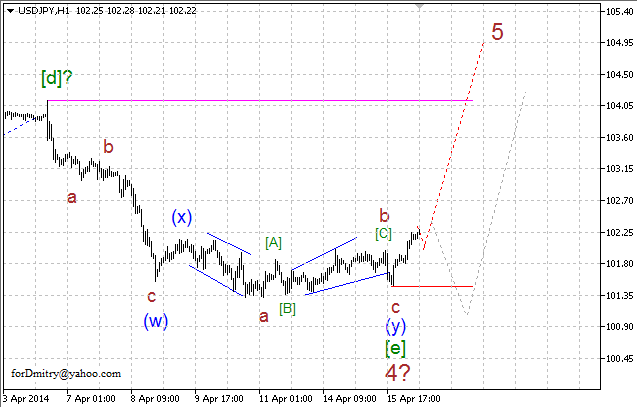
Probably, Yen finished long horizontal correction 4 of (A). In this case, price is expected to start final ascending movement inside wave 5 of (A).

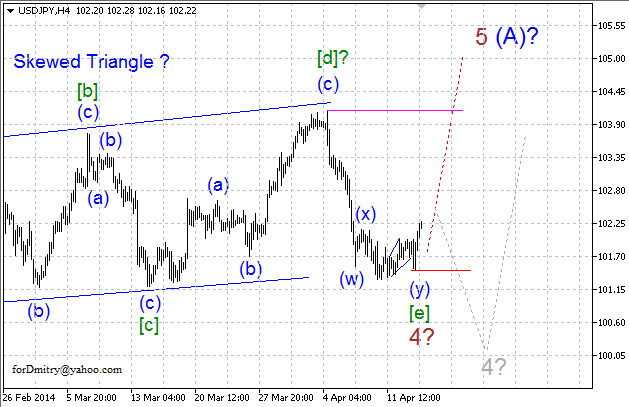
Possibly, pair completed skewed triangle 4, which may be followed by final ascending wave 5.

Probably, price finished descending double zigzag [e] of 4 and started forming final ascending wave 5.

RoboForex Analytical Department

Article By RoboForex.com

Attention!
Forecasts presented in this section only reflect the author’s private opinion and should not be considered as guidance for trading. RoboForex LP bears no responsibility for trading results based on trading recommendations described in these analytical reviews.


Anarchy in New York, Taxicabs Suddenly Vanish…

By WallStreetDaily.com Anarchy in New York, Taxicabs Suddenly Vanish…

Allow me to share an investment insight I recently received from self-made millionaire, Chris Camillo.

Chris is the bestselling author who turned $20,000 into $4 million straight through the Financial Crisis, without shorting the collapsing housing market.

Back in November, Chris invited me into his home to sit and chat.

Knowing that all legendary investors have their own “secret sauce,” I listened very carefully.

And today, I’m stealing Chris’ secret to reveal my favorite company among MIT’s just-published list of the “Top 50 Smartest Companies.”

The company is Uber, MIT’s 26th Smartest Company…

Uber is a sedan service that’s ready to push the taxicab industry into extinction.

Forget dirty, smelly cabs… with the Uber app loaded on your smartphone, the click of a button will summon a beautiful black towncar ready to take you anywhere.

The towncar usually arrives in less than seven minutes, too.

Oh, and the driver is courteous and attentive. Imagine that!

When I downloaded the Uber app, I was prompted to load a credit card, which ingeniously eliminates a cash exchange.

And upon arriving at my destination, I simply opened the door and exited the vehicle.

The driver’s gratuity is built into the price, as well!

I never even reached for my wallet. (Check out this video of me in an Uber “black car” this morning.)

But here’s why I’m declaring the taxicab industry dead…

With all the subtle nuances of a personal limousine service, Uber’s prices are right in line with taxis. Sometimes they’re even cheaper!

Personally, I hope to never see the inside of a cab again.

Now, how does my conversation with bestselling author, Chris Camillo, factor in?

It’s simple, really.

Chris made his fortune exploiting what he calls “information imbalances.”

While that may sound complicated, it’s not.

An information imbalance occurs when the public has a rare, unfair advantage over Wall Street.

The advantage comes from having the freedom to invest alongside trends, phenoms and sensations just as they’re happening.

Wall Street is its own worst enemy in this regard.

Institutional controls and regulations weigh on money managers like cement, which means they’re sitting ducks for any “unexpected” profit sensations.

For example, Wall Street totally missed Uggs, True Religion Jeans and Crocs as they swept the nation.

Wall Street also missed the Wendy’s “Pretzel Burger” craze.

And guess what?

Wall Street is about to miss the next BIG one!

How to play the rise of personal sedan services…

Undoubtedly, competitors will arrive to challenge Uber. I mean, competition is the nature of free markets, right?

But the competition won’t come from taxicabs.

Quite frankly, taxicab companies have failed miserably to adapt to a changing market. And now it’s way too late for them to save themselves.

The fly in the ointment here is that Uber is a privately held company.

Boy, it’d be a shame to waste a classic information imbalance, though.

So I’m going to break form and recommend “going short” shares of Medallion Financial Corp. (TAXI).

Medallion Financial controls the financing of taxicab medallions.

These medallions are the licenses required to operate taxicabs in major cities like New York, Boston, Chicago, Newark, Philadelphia and Baltimore.

As Uber continues to rise to power, taxicab medallions will be worth less and less.

Only 4.8% of the shares are presently being held “short,” so we’re nice and early on this one.

For our more aggressive speculators, consider buying a few November 2014 $10 put options.

By November, I expect cabbies will be scrambling to survive, meaning those put options will have exploded in value.

Onward and upward,

Robert Williams
Founder, Wall Street Daily

The post Anarchy in New York, Taxicabs Suddenly Vanish… appeared first on Wall Street Daily.

Article By WallStreetDaily.com

Original Article: Anarchy in New York, Taxicabs Suddenly Vanish…