Gold Forecast & How To Momentum Trade Gold Stocks

By Chris Vermeulen, www.TheGoldAndOilGuy.com

Back on April 9th I posted a short tutorial on how to momentum trade gold along with my short term gold forecast.

Today I wanted to do a follow up video for my gold market traders for three reasons:

1. I had lots of great feedback from traders taking advantage of what I showed to profit in the past week.

2. To show you how and why this strategy works better with gold stocks and silver stocks.

3. To provide my short term gold forecast so you are on the right side of the market for next week.

4. Also you should see my major long term Gold Forecast

Get My Gold Forecast & Gold Trade Alerts: www.TheGoldAndOilGuy.com

Chris Vermeulen


Will Price Cuts at Tesco Restore Profits?

By WallStreetDaily.com

After the second year of a profit decline, multinational grocer and general retailer Tesco (TESO) attempts to redeem itself, but is its CEO’s master plan enough to win back its customers’ hearts?

The retail giant (the world’s third largest) has a 6% profit drop in 2014, so far. With trading slowing down over the past 12 months, most of its British stores had a 3% drop in Q4 2013. CEO, Philip Clarke, is definitely under fire – since this decline was preceded by a two-decade growth period (most of it under the previous Chief Executive). He has some big shoes to fill, and his solution to this dull season is a price cut. Clarke is hoping that chopping millions of pounds off of prices will do the trick.

Breakingviews’ Robert Cole argues that Tesco should consider how aggressive it wants to be with its strategy:

“The big question they need to ask themselves is how aggressively they get involved in the price war. Numbers out today show that the trading margin in Tesco business was 5% last year. That’s, inevitably, going to come down because of some of the initiatives they’ve already taken. But I think the question they really need to ask is: Do they go in really, really hard on prices and re-establish Tesco as a proper value proposition?”

Challenges confront TESO on every end: failed attempts in the United States and Japan, an expensive China expansion and vicious competition on the home front. Store improvements and new services are eating up another billion pounds, but, luckily, these changes will help (and not harm) the business.

What isn’t doing the company any good right now is the success of discounters Aldi and Lidl, as well as that of upmarket grocers Waitrose and Marks & Spencer.

In spite of being at a 10-year market share low, Kantar Worldpanel’s Edward Garner says TESO is still No. 1 is some sectors:

“There are areas where they are doing very strongly. Digital and omni channel. If you think about digital, they are the largest online grocer probably in the world, let alone this country. They have things like the Hudl, which is a tablet that takes you straight to Tesco and Blinkbox. So they have a very large digital footprint. And the idea being that you deal with Tesco in all sorts of environments. Large scale, small stores, online.”

Trading profits overseas are down in Asia and Europe by 5.6% and 28%, respectively. But this won’t deter the retail giant. In fact, TESO is leaping into the fashion industry – and it’s bringing F&F, its clothing brand, to the United States. Another shot at a game of “Sink or Swim,” and this time, Tesco needs to keep its head above water.

For a £23-billion company with 530,000 staff members to see such devastating results, people can only wonder if something is seriously off with the company’s direction or management.

The post Will Price Cuts at Tesco Restore Profits? appeared first on Wall Street Daily.

Article By WallStreetDaily.com

Original Article: Will Price Cuts at Tesco Restore Profits?

Gold Forecast – This Is Going To Be Exciting

By Chris Vermeulen, www.TheGoldAndOilGuy.com

Gold Forecast: During the past year there has been very little talk about gold, silver or gold stocks in the media. Yet the year before it was all the media could talk about and they even had the price of gold streaming live all day in the corner of the tv monitor.

I am always amazed how the masses and media can be so off in their timing of the stock market and commodities in general. For example when Greece was having issues in 2012 and everyone was avoiding investments in that country like it was the plague. Looking back now, Greece is up huge and only recently investors are confident enough to put money into the Greek stock market again.

But the truth is that big move has already happend, and the US and global markets are in rotation (changing trends). Money is slowly shifting from what has been hot during the past year or two, to new investments which have a lot more room to rise in value. And this is leads us back to my gold forecast.

If you are at all familiar with Stan Weinstein’s work, then you understand the four market stages. If not, you can learn these four stages on my Stan Weinstein page. Through stage analysis we can predict the type of price action we should expected and have a rough idea just how long a move (new trend) is likely to last. It is important to know that Stan Weinstein’s stage analysis works on any time frame from a one minute chart to a monthly chart. If you do not know this then you are trading almost blind without a doubt.

Current stage analysis looks as though the US stock market may be starting to form a stage three top. There are several indicators and market behaviors which are screaming, telling us to trade with caution to the long side. But the masses do not see this or hear what is unfolding in front of their very own eyes, and that I fine. It actually reminds me of a funny old movie called “hear no evil, see no evil”.

In short, the market is showing some signs of distribution selling in stocks, and the once market leaders are now getting completely crushed with heavy selling volume like the biotech stocks, social media stocks and other momentum stocks and this is bad.

Gold on the other had has been forming a stage one basing pattern. This provides a very bullish long term gold forecast that investors could ride for several years.

———————–

Q: Where Will Investment Capital Go During The Next Bear Market In stocks?

A: One of the places will be precious metals. Click here for my gold forecast which shows the main reason why

———————–

Gold Forecast Coles Notes:

1. The US dollar index has setup a massive stage 3 topping pattern on the weekly chart. A falling dollar will send the price of gold higher naturally.

2. Bullish gold forecasts by the media have dropped substantially, meaning everyone is bearish on gold.

3. Gold stocks are already showing signs of massive accumulation. I always use the price and volume action of gold stocks to help create and time my gold forecasts which it starting to look bullish.

Gold Forecast Conclusion:

Gold market traders should understand that precious metals in general are still months away from breaking out to the upside and starting a new bull market. Do not be in a rush to buy gold or gold stocks yet. There will be plenty of time folks.

Get My Daily Video Gold Forecast & Gold Trading Alerts at: www.TheGoldAndOilGuy.com

Chris Vermeulen


Fibonacci Retracements Analysis 17.04.2014 (EUR/USD, USD/CHF)

Article By RoboForex.com

Analysis for April 17th, 2014

EUR USD, “Euro vs US Dollar”

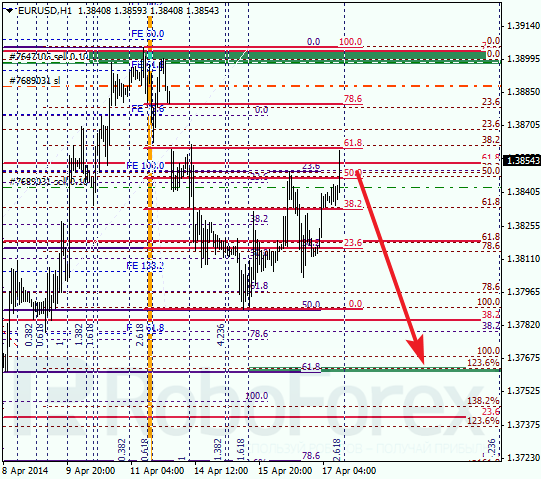
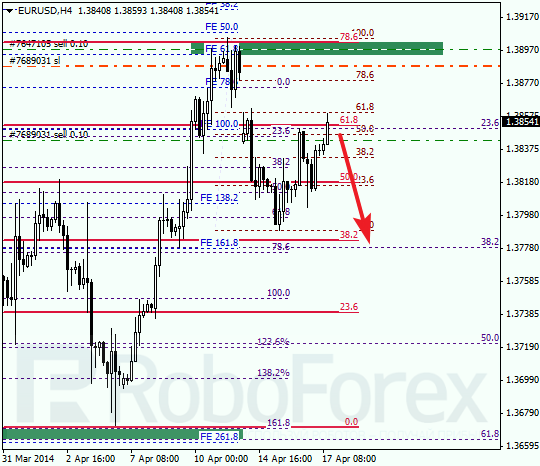
Eurodollar is still being corrected; earlier pair rebounded from the group of upper fibo levels (at 1.3900). Right now, price is trying to rebound from level of 61.8% (1.3860). If bears succeed in doing it, market will start new descending movement.

As we can see at H1 chart, I’ve got two sell orders so far. If later pair breaks local level of 50% (1.3847) downwards, I’ll open several more orders with target close to the group of lower fibo levels (1.3760).

USD CHF, “US Dollar vs Swiss Franc”

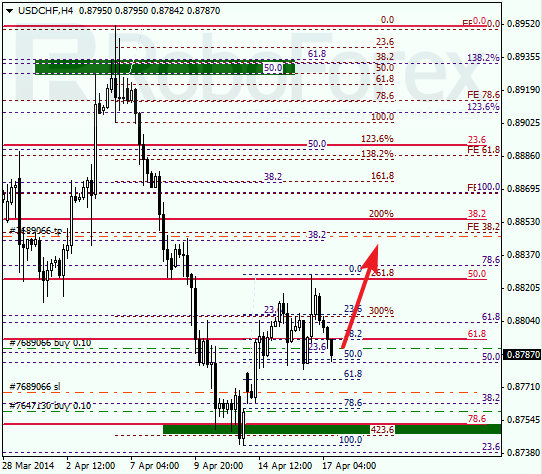
Franc is consolidating and trying to find support from local level of 50% (0.8785). Earlier price rebounded from the group of fibo levels at 0.8745. Possibly, market may reach new maximums until the end of this trading week.

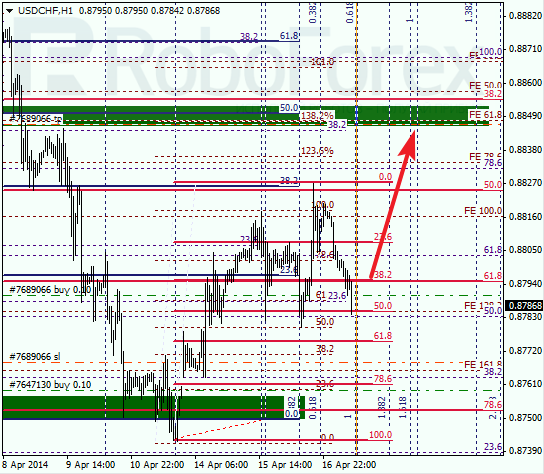
As we can see at H1 chart, price is getting closer to temporary fibo-zone. Possibly, pair may rebound from local level of 50% inside this zone. Later market is expected to start new ascending movement towards the group of fibo levels (0.8845 – 0.8855).

RoboForex Analytical Department

Article By RoboForex.com

Attention!
Forecasts presented in this section only reflect the author’s private opinion and should not be considered as guidance for trading. RoboForex LP bears no responsibility for trading results based on trading recommendations described in these analytical reviews.


Wave Analysis 17.04.2014 (DJIA Index, Crude Oil)

Article By RoboForex.com

Analysis for April 17th, 2014

DJIA Index

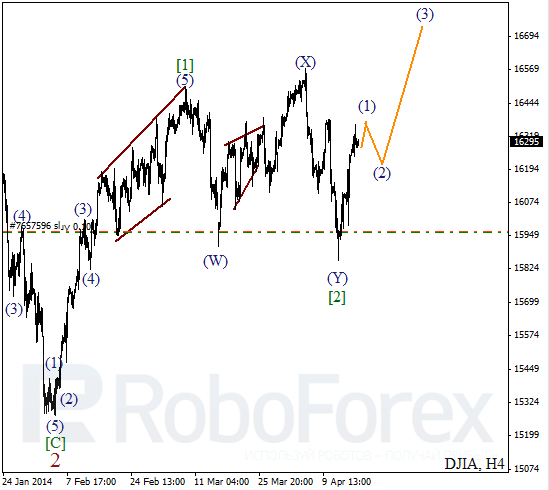
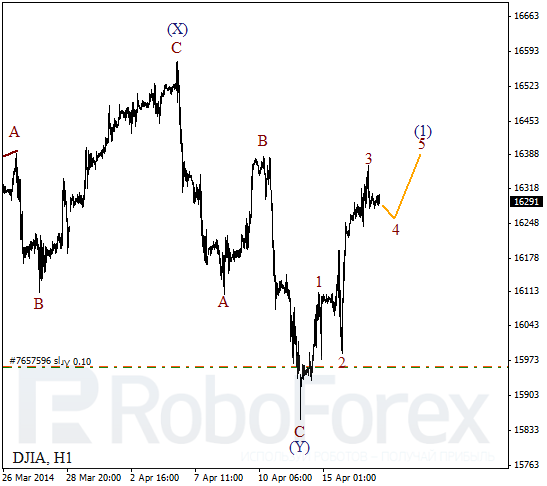
Probably, Index completed double three pattern inside wave [2]. On minor wave level, price is forming initial bullish impulse. After completing local correction, instrument is expected to start growing up inside the third wave.

More detailed wave structure is shown on H1 chart. Price is starting the fourth wave inside wave (1). In the near term, price may finish correction and start the fifth wave. As soon as it happens, I’m planning to open another buy order.

Crude Oil

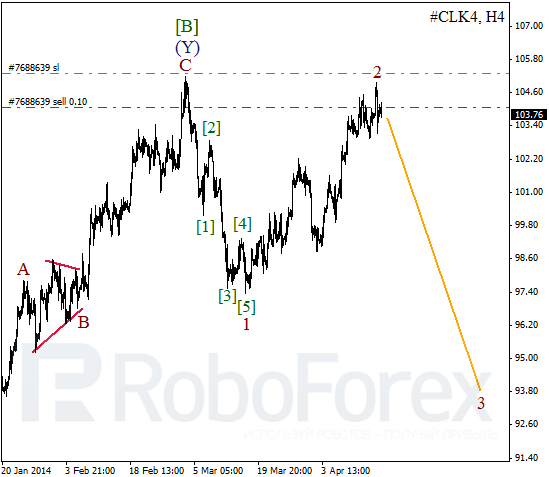
It looks like Oil finished wave 2. Earlier, price formed bearish impulse inside wave 1. I’ve got only one sell order so far, but as soon as market start falling down I’m planning to open several buy orders.

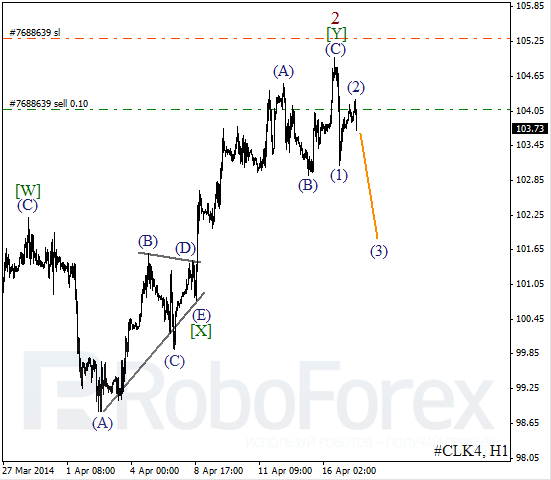
As we can see at the H1 chart, after completing zigzag pattern inside wave [Y], Oil formed initial bearish impulse inside wave (1). Possibly, during the day price may break local minimum while forming the third wave. After that, I’ll move stop into the black.

RoboForex Analytical Department

Article By RoboForex.com

Attention!
Forecasts presented in this section only reflect the author’s private opinion and should not be considered as guidance for trading. RoboForex LP bears no responsibility for trading results based on trading recommendations described in these analytical reviews.


Salman Partners’ Raymond Goldie: Copper Is Pathological and Suffers from SAD, but It Has Value

Source: JT Long of The Gold Report (4/16/14)

http://www.theaureport.com/pub/na/salman-partners-raymond-goldie-copper-is-pathological-and-suffers-from-sad-but-it-has-value

Dr. Copper may be in a supercycle, but there are serious problems. In this interview with The Gold Report, Salman Partners’ Vice President of Commodity Economics Raymond Goldie explains why even though the base metal acts pathologically and has a bad case of seasonal affective disorder, these six equities are priced below their intrinsic value.

The Gold Report: You are giving a presentation at the Society for Mining, Metallurgy & Exploration Current Trends in Mining Finance Conference called Diagnosing the Doctor, which refers to assessing the supply and demand problems for Dr. Copper as a way to understand what is ailing all the mining products today. Are we in a supercycle? What is the meaning of a sustainable supercycle?

Raymond Goldie: I suppose it’s best to answer your second question first—What is the meaning of a sustainable supercycle?—because a lot of people use the word supercycle to describe the wonderful state that we had beginning in the early part of this century, when metal prices kept going up, commodity prices kept going up, seemingly forever. I’m a little less restrictive on what I define as a supercycle. I think a supercycle is any period in which we have commodity prices higher than their long-term average values. On that basis, even allowing for overall inflation, we’ve been in a supercycle since 2004. We’re still in it, although for a few months regrettably at the end of 2008 we popped out of it. But right now we are in a supercycle.

TGR: What are the fundamentals keeping us in your definition of a supercycle?

RG: The usual reason is China. It’s the biggest consumer of most of the commodities in the world and has the biggest growth in consumption of most of the commodities in the world. But what that analysis tends to overlook is that production of most commodities in China has been increasing at roughly the same rate as consumption in China. So, on balance, China may not be as big a contributor to the supercycle as we’ve imagined.

TGR: Does that mean that the Western world is playing a larger role in supporting the supercycle than we give it credit for?

RG: When it comes to assessing supply and demand from Asia, it is important to consider Chinese economic data, which a recent Bloomberg article equates to some of the meat served in low-cost restaurants. We don’t know where it comes from and don’t really know what it means. It’s not easy to put a lot of credence on Chinese economic numbers, so it’s hard to tell the extent to which China does affect supply and demand.

But one thing that we can count on is the diligence of people who sit at borders with clipboards looking at stuff crossing borders. They are paid to make sure that the right duties get paid and the ships are carrying what they’re supposed to be carrying. If we look at China’s trade with the rest of the world, those numbers are fairly reliable, even if the numbers for what’s going on inside China are not reliable. Since 2008, the dark days when the world seemed to have ended, China’s imports of copper from the rest of the world have grown 41% per annum.

TGR: And what about the supply side?

RG: I think the single most important reason that we’re in a sustainable supercycle is that we haven’t invested enough in finding more resources. The supply-side constraints are probably why prices are higher than the long-term trend in prices.

TGR: Why has it been so difficult to predict how much copper will be produced in a given year if it takes so long to bring a mine to production?

RG: Since about 2003 analysts have consistently overestimated the production of copper. My theory for the consistent shortfall is that before 2003, when strikes, landslides, earthquakes, storms, civil unrest, late trains and the like slowed down production, someone in the head office would send a cable calling for the mining of high-grade ore to make up the difference. But since 2003, there hasn’t been any high-grade ore to mine because of a lack of investment in new resources. And this happens year after year. About 7% less copper is produced each year than the mines predicted at the start of the year.

TGR: So why isn’t that inconsistency causing the price to go up?

RG: Maybe it is. There has certainly been what I’ve called a pathological situation in the copper markets because typically the relationship between copper inventories—the stuff that’s sitting around in warehouses—and prices is that the lower the inventories, the higher the price. But since 2005, in the Western world—we don’t know what’s going on in China—inventories have gone up 185%. Typically, that would mean prices go down, right? But, no, prices have gone up 95%. That may be one of the reasons that we’re consistently producing less of the stuff than we thought we could.

TGR: You have said that the pitch-point™ curve* for supply and demand compared to prices is pathological. Is that because of the role of recycling in meeting some of the demand?

RG: I think it could be because it used to be that every pound that was in inventory was backed by all the copper that the mines would produce and all the copper that scrap yards would produce. The amount that the scrap yards produce has been declining, in large part because Asians have been very diligent about taking scrap from North America and refining it into good usable copper again. But, again, it’s hard to get good figures for how much copper there is in scrap yards so that answer is probably yes, the declining use of copper in recycling is probably one of the reasons why we’ve seen prices go up even though inventories have also gone up. But it’s hard to be more precise than that.

TGR: You have also said that copper has seasonal affective disorder (SAD). What causes that?

RG: That’s right, it does. I can tell you what SAD is, but I can’t tell you exactly what causes it. In the good old days of the London Metal Exchange (LME), the saying was “sell in May and go away.” And that was always a wonderful excuse to take an English summer holiday and not bother coming back to trade copper until September or October. Now, the peak seems to be around the end of February and the end of June tends to be the bottom in copper prices. It’s pretty consistent. Year after year we see that effect, but what causes it, I don’t know.

TGR: Because copper is so important for growth, is it feasible that it could be used as the world reserve currency instead of gold or the dollar? What would that look like?

RG: Copper is being used as a reserve currency in China right now. Some of the importers will use the copper that they hold as collateral for loans that they make from various banks in China. One of the advantages of copper as collateral is that unlike wheat, silver or potash, you can store it outside. Even in the rain, copper will keep its value, and there’s always a use for the stuff.

But to talk about copper as a reserve currency for the whole world is not practical. If a country is holding reserves of $1 trillion, it would have to have 150 million tons on reserve. That is about eight and a half years of copper consumption just sitting there. But certainly copper is being used as a currency on a small scale, as it’s being used now in China.

TGR: What prices are you using for copper going forward in the rest of 2014?

RG: Since 2003 when the fundamentals of the copper business changed so significantly, the forward prices on the LME have been a much better forecaster of copper prices than we analysts. This afternoon, the LME is telling me that if I buy copper now for delivery in 10 years, I would have to pay $3.02/pound ($3.02/lb). That’s as good as any forecast I have for the long-term price of copper. If you were to buy a pound of copper for delivery tomorrow, it’s pretty much the same as where the price of copper is today.

TGR: If copper prices look to be fairly flat going forward, why do copper equities tend to outperform the metal?

RG: This gets back to the unwieldy nature of copper as a store of value. Let’s say you were thinking of retiring and decided to make off with all of your fortune, say $3 million ($3M), and drive away into the sunset. Now, if you put that in the form of gold, $3M would weigh less than 200 lb; it would fit in the trunk of your car. But $3M worth of copper would weigh 450 tons. That is why when people get enthusiastic about buying gold, they often buy gold bullion. But when they’re thinking of buying copper, the unwieldy nature of buying copper metal means they are better off with the equities. That’s why the equities have done about the same or even a little better than the price of copper itself. That certainly has not been the case with gold.

TGR: Are the copper companies less risky than some of the gold companies?

RG: Riskiness is a feature of the things that Mother Nature can fling at us or the surprises that come with the election of a government that no one expected and that government nationalizes some of its assets. Most of the companies that I follow are managed by a lot of gray hairs; they’ve seen all the unpleasant things that can happen. Most of the ones that I tend to look at are well managed, and they include the big producers, like Freeport-McMoRan Copper & Gold Inc. (FCX:NYSE), whose biggest growth comes from the Democratic Republic of Congo, where there are political risks, but Freeport is skilled enough and experienced enough in operating in parts of the world where there is high political risk that it has so far been able to stave off most political concerns.

Another company that has also done well in that part of the world is First Quantum Minerals Ltd. (FM:TSX; FQM:LSE), a Canadian company that just bought Inmet Mining Corp. and, through its acquisition of Inmet, is building a new copper mine in Panama. Of the companies I cover, First Quantum stands out for being relatively low risk and high return.

TGR: Does First Quantum’s acquisition make it stronger because it is diversified?

RG: Certainly, it’s diversifying geographically. Before the acquisition most of its assets were in Zambia, which has been a good address for a mine, but that may not always be the case. Having assets in Panama, Finland and Turkey is not a bad idea.

TGR: What about some smaller companies that you cover in the copper space?

RG: It’s pretty hard to find a small copper producer. The only one I cover is Amerigo Resources Ltd. (ARG:TSX). It operates a “mine” in one of the best addresses in the world for a copper mine, and that’s Chile. But instead of mining the stuff, it processes the tailings from one of the world’s biggest copper mines, El Teniente. It is profitable and it is expanding its operations.

TGR: Do you evaluate a company in the tailing business very differently than a company like First Quantum?

RG: I don’t actually. I generally use the standard textbook discounted cash flow valuation method. For a mine in production, like Amerigo’s operations, I use a low discount rate. For potential expansion, I use a higher discount rate because this is an unproven technology there. For First Quantum, the same thing. For First Quantum’s existing operations, I use a lower discount rate than for valuing the operations that it hopes to bring onstream in a few years in Panama or Zambia. I use an even higher discount rate on something that isn’t in production yet, simply because of the technological, political and community risks associated with that prospect.

TGR: Do you follow any explorers?

RG: The explorers I cover are NovaCopper Inc. (NCQ:TSX.V; NCQ:NYSE.MKT), Curis Resources Ltd. (CUV:TSX.V; PCCRF:OTCPK) and Nautilus Minerals Inc. (NUS:TSX).

NovaCopper is a company that has one of the world’s highest-grade copper deposits, but it’s in a part of Alaska that requires a road to be built. Until that road is built, probably around 2021, the mine is going to sit there. So the risk in that case, even though it’s in the U.S., is a political risk.

TGR: Does NovaCopper’s resource make the risk worthwhile?

RG: I assume that it’s not until about 2025 when it comes into production, and I discount that back to the present. Every year you discount it, you make it worth a little less or you value it at a little less. If NovaCopper were in production today, it might be worth $10/share, but because it’s so far in the future, I think it’s worth about $5/share. The company is trading under $2/share, so there is upside.

TGR: What about the risk-reward story for Curis? It is in the U.S. as well, a fairly safe jurisdiction.

RG: Curis is also a political risk story. The company hopes to use a fairly new method of extracting copper, which is pumping fluids into the ground, dissolving the copper and bringing it up to the surface. No shovels and excavators required. It looks like an oil well field. It surrounds the town of Florence, Arizona, which does not allow mining, but the half of the deposit surrounding the town has state approval.

Curis has been waiting more than a year and a half for the federal Environmental Protection Agency’s (EPA) approval. I don’t know how long it’s going to take for the EPA to act, but when it does give its comment, it is likely to be approval. One of the lessons I have learned is that if any mining company tells you it thinks the government will approve its project in such and such a time, you can usually be confident in adding another year. Companies always tend to underestimate how long it takes governments to get around to doing anything.

TGR: How about the risk and reward for the last one you mentioned, Nautilus?

RG: That’s another government story. It’s also a new technology story. It’s the most exciting and interesting of all the companies I cover because it has identified high-grade copper, zinc, gold and silver-bearing deposits right at the surface of the sea floor a couple of miles under the ocean off Papua New Guinea. It has just completed the first of the three machines it needs to dig the stuff up from the sea floor. The government has a legal dispute with the company, which hasn’t been resolved yet. So there are both technological and political risks. And it also is a cheap stock.

TGR: What’s the timeline on these? Are these all long-term investments?

RG: NovaCopper could be up and running by 2025. Amerigo is in production right now with expansion dependent on government approval. Once that has happened, it is probably two or three years before that comes into production. Once Curis gets EPA approval, it should be in production in about 18 months. First Quantum’s Panama project should be in production around 2016. Nautilus is two or three years away from production once it resolves its differences with the government.

TGR: With all of these great ideas, what advice do you have for resource investors who are looking to keep their portfolios healthy during the next two or three years while they wait for some of these things to happen?

RG: There are two questions that investors should ask about any investment they make: Is the value there? When should I seize on that value? Most copper mining stocks are trading as if the price of copper were $2/lb and is going to be about $2/lb forever. But copper on the LME 10 years out is actually $3/lb. That means the equities are definitely a value story. As to when to buy it, given the SAD cycle we mentioned earlier, investors might want to wait until the end of June.

TGR: Thank you for your advice.

RG: Thank you.

*”Pitch-point curve™” is a term trademarked by Raymond Goldie.

Raymond Goldie, vice-president of commodity economics and senior mining analyst at Salman Partners, has extensive experience in the investment business, including more than 20 years as a mining analyst covering non-precious-non-ferrous and precious minerals (gold, silver, PGEs, diamonds) and fertilizer companies. In geology, Goldie holds a Bachelor of Science from Victoria University in Wellington, New Zealand; a Master of Science from McGill University; a Ph.D. from Queens University; and a Diploma in Business Administration from the University of Toronto.

Want to read more Gold Report interviews like this? Sign up for our free e-newsletter, and you’ll learn when new articles have been published. To see recent interviews with industry analysts and commentators, visit our Streetwise Interviews page.

DISCLOSURE:

1) JT Long conducted this interview for Streetwise Reports LLC, publisher of The Gold Report, The Energy Report, The Life Sciences Report and The Mining Report, and provides services to Streetwise Reports as an employee. She owns, or her family owns, shares of the following companies mentioned in this interview: None.

2) The following companies mentioned in the interview are sponsors of Streetwise Reports: None. Streetwise Reports does not accept stock in exchange for its services.

3) Raymond Goldie: I own, or my family owns, shares of the following companies mentioned in this interview: None. I personally am, or my family is, paid by the following companies mentioned in this interview: None. My company has a financial relationship with the following companies mentioned in this interview: None. I was not paid by Streetwise Reports for participating in this interview. Comments and opinions expressed are my own comments and opinions. I had the opportunity to review the interview for accuracy as of the date of the interview and am responsible for the content of the interview.

4) Interviews are edited for clarity. Streetwise Reports does not make editorial comments or change experts’ statements without their consent.

5) The interview does not constitute investment advice. Each reader is encouraged to consult with his or her individual financial professional and any action a reader takes as a result of information presented here is his or her own responsibility. By opening this page, each reader accepts and agrees to Streetwise Reports’ terms of use and full legal disclaimer.

6) From time to time, Streetwise Reports LLC and its directors, officers, employees or members of their families, as well as persons interviewed for articles and interviews on the site, may have a long or short position in securities mentioned. Directors, officers, employees or members of their families are prohibited from making purchases and/or sales of those securities in the open market or otherwise during the up-to-four-week interval from the time of the interview until after it publishes.

Streetwise – The Gold Report is Copyright © 2014 by Streetwise Reports LLC. All rights are reserved. Streetwise Reports LLC hereby grants an unrestricted license to use or disseminate this copyrighted material (i) only in whole (and always including this disclaimer), but (ii) never in part.

Streetwise Reports LLC does not guarantee the accuracy or thoroughness of the information reported.

Streetwise Reports LLC receives a fee from companies that are listed on the home page in the In This Issue section. Their sponsor pages may be considered advertising for the purposes of 18 U.S.C. 1734.

Participating companies provide the logos used in The Gold Report. These logos are trademarks and are the property of the individual companies.

101 Second St., Suite 110

Petaluma, CA 94952

Tel.: (707) 981-8999

Fax: (707) 981-8998

Email: jluther@streetwisereports.com


Will Facebook’s Latest Move Cripple the Finance Industry?

By WallStreetDaily.com Will Facebook’s Latest Move Cripple the Finance Industry?

In September 2012, shares of Facebook (FB) hit their all-time low of $17.55.

The stock has been on an upward trajectory ever since.

It even enjoyed a short-lived break above the $70 level back in March, which got me thinking…

In light of Facebook’s recent acquisition spree, including the $2-billion purchase of Oculus, were the lows of 2012 a historic buying opportunity? I believe so…

Already a fifth of the time that Americans spend on their smartphones is spent on Facebook. And now the social media juggernaut is reportedly weeks away from the regulatory approval it needs to launch an e-payments service in Europe.

With Facebook’s European headquarters in Ireland, the country’s central bank must approve Facebook as an electronic money institution.

The conquest of American banks would undoubtedly be next.

To shed more light on this developing storyline, I asked bestselling author Karim Rahemtulla to share his opinion.

Karim, who’s been covering the stock since it IPO’d, says that Facebook’s “ubiquity” makes it a legitimate threat to take over the world of commerce.

~ Robert Williams, Founder, Wall Street Daily

These days, it seems like everyone wants to know how social media will evolve.

Which companies will survive long enough to deserve seemingly commonplace valuations of 20 and 30 times sales or double and triple the market multiple for earnings?

Is Facebook (FB) dead because younger users are migrating to other media apps like Snapchat, Instagram (which is owned by Facebook, by the way) or whatever the next new thing might be?

Well, late last week, Facebook gave astute investors a glimpse into what the future holds, and the company showed why it’ll remain the dominant force in social media for some time to come.

Can You Say “Banking”?

Facebook announced that it’s close to obtaining regulatory approval from the Irish monetary authorities to provide financial services for users.

More specifically, Zuckerberg’s firm is seeking approval for a service that would allow users to store money on Facebook, use the funds to pay for goods and services, and exchange money with others.

Not only is Facebook’s Irish entry the first shot across the bow to companies like PayPal – owned by eBay (EBAY) – that offer services for money transfers and merchant payments, but it’s also a wake-up call to bigger banks that offer a whole suite of services.

You see, while both PayPal and the banks have been around much longer, they lack the one crucial ingredient that will make Facebook the dominant player of the future: eyeballs!

Like many others, I’ve come to rely on the site for events ranging from sports to social gatherings… and I’m not the “generation” that most people associate with Facebook. But I am in the age group (35 to 60) that’s joining Facebook faster than any other.

This is important, as Facebook needs us to spend money on things that give the company a cut. Tweens and Millennials may love posting pictures, but they don’t buy like we do.

Consider this scenario: Just the other day, I was on my Facebook page and noticed that a friend had a birthday. She was in a different state, and I thought it’d be a nice gesture to send her a present. With Facebook banking, I could do so in a matter of clicks!

Remember, Facebook’s power is its ubiquity: It’s become routine to check my page, converse with friends over the FB messaging service – and, most recently, text when I’m overseas, since Facebook acquired WhatsApp.

On top of that, my conventional bank doesn’t offer any particular benefits that make me want to stay with them. Security is suspect, especially in light of all the recent hacking. Why would Facebook be any less secure?

In an age where relationship banking with big banks is non-existent, why couldn’t a company that has dominated social networking succeed? I’d consider banking through them in a heartbeat, and I think others would, too.

If you’re still not convinced, consider the numbers coming from all of this: If Facebook were able to engage just 10% of its user base in banking services, it’d be the biggest bank in the world in terms of the number of clients.

Clearly, not all social media sites are created equal. Some, like Facebook, are leaps and bounds ahead of others in terms of user interface, offerings and clientele. And with this latest venture into the banking business, FB is starting to convince former skeptics (like myself) that it’s the single company with the potential to dominate the sector.

Ahead of the tape,

Karim Rahemtulla

The post Will Facebook’s Latest Move Cripple the Finance Industry? appeared first on Wall Street Daily.

Article By WallStreetDaily.com

Original Article: Will Facebook’s Latest Move Cripple the Finance Industry?

EUR/USD Forecast And Price Action For April 17th

Article by Investazor.com

This week is almost ended, Easter is here and investors took a break. The Euro-dollar currency pair moved sideways from the opening price to the current moment. Tuesday the price stopped at 1.3800 even though the fundamental analysis was sustaining a US dollar strengthening. Both US CPI and Core CPI surprised with a 0.2% release while it was expected 0.1%.

Yesterday the EU Current Account was below expectations, while the CPI was in line with its estimates of 0.5% y/y. The Core CPI of the European Union did not meet analysts’ median estimation of 0.8% growth on an annual basis. While EU data was rather disappointing, the US releases surprised with some good numbers. Building Permits met their expectations as well as Housing Starts; Capacity Utilization Rate and the Industrial Production went above analysts’ expectations and should have triggered some buying for the US dollar, but it didn’t.

See our last analysis: EUR/USD Forecast And Price Action For April 15th;

The price of EURUSD moved sideways between 1.3800 and 1.3850 suggesting that investors are not that active in this period. This morning the European single currency managed to comeback to 1.3840. Now it is trading flat in a 10 pips range. German PPI was negative, -0.3%, but no one seems to care. See what are is expected to be published next and what would price action suggest.

The following are expected today:

US – Unemployment Claims (13:30). If it is Thursday the Unemployment Claims is published for the US labor market. As I said in my past analysis of this indicator, even if it is considered to be a medium to high impact indicators, it doesn’t influence investors that much in this period.

US – Philly Fed Manufacturing Index (15:00). This indicator still have an important impact on the market. Last month was published two times its expected value and today it is estimated to be around 9.6 points. A big surprise, like last month, would trigger some volatility.

In my opinion EURUSD will not do anything surprising this week. I believe that the price is under some buying pressure and it will close the gap. You will find more about its price action in the next paragraph.

EUR/USD Price Action

The price has drawn a symmetrical triangle. Not it is traded near the upper line of this pattern. A break followed by a close above the upper line would signal a rally which could target 1.3880. A break below the local support would only signal a possible retest on the lower line of the triangle. The volatility is pretty low, I would be very careful at a false breakout above the upper line and a comeback inside the pattern.


The post EUR/USD Forecast And Price Action For April 17th appeared first on investazor.com.

Renewed Tensions in Ukraine Push Oil Prices Up

By HY Markets Forex Blog

In the past couple of weeks it appeared as though tensions in Ukraine were easing. However, recent military action has renewed fears in the area, which pushed up the price of oil.

Commodity options traders should be paying close attention to this situation, as Russia is believed to be behind much of the action in Ukraine. Small economic sanctions have already been placed against the Eastern European nation, but if things get worse, the country’s supply of oil could be impacted. As a result, prices could continue to increase, which may provide investors with an opportunity to make money.

“The increasing tensions between the West and Russia over Ukraine could provide further upside momentum to the oil market, supporting crude oil prices higher,” Myrto Sokou of Sucden Financial Research in London, told The Associated Press.

Renewed worries began when pro-Russian militants ceased government buildings in Ukraine. In response, Ukraine’s government sent tanks and troops to regain these buildings. NATO Secretary General Anders Fogh Rasmussen said the alliance would send troops to assist the effort, which could escalate the situation.

Oil is being driven more by the Ukraine situation,” Guy Wolf, global head of market analytics at Marex Spectron Group in London, told Bloomberg. “Does this situation mean more intense disagreements elsewhere, as in the Cold War? In a tight market, such as WTI, anything can have an amplified effect.”

Any further escalation could lead to future increases to oil. Commodity options traders should watch closely for any signs that could heighten tensions. For example, if Russian President Vladimir Putin announces he is going to increase military presence in Ukraine, the U.S. could impose more economic sanctions that drive up oil prices.

The post Renewed Tensions in Ukraine Push Oil Prices Up appeared first on | HY Markets Official blog.

Article provided by HY Markets Forex Blog

Doug Casey’s Coming Super-Bubble

By Louis James, Chief Metals & Mining Investment Strategist, Casey Research

In many of my conversations with legendary speculator Doug Casey since the crash of 2008, Doug has talked about a coming super-bubble.

Everything Doug has studied about human nature, history, and economics—from Roman times right up to the present—has him absolutely convinced that the global economy is headed for high inflation, with a very real potential for hyperinflation in the US.

Ben Bernanke’s panicked deployment of squadrons of cash-laden choppers has been emulated around the world. The Bank of International Settlements estimates that global debt markets now exceed $100 trillion.

The laws of economics—maybe even physics—say that this inflation, whenever it arrives, must have consequences… and that those consequences cannot be avoided forever.

The easiest consequence to predict, and the one we’re betting heavily on, is that the price of gold will move higher. Much higher. That move will in turn ignite a bubble in gold stocks and, as Doug likes to say, a super-bubble in junior gold stocks.

Jeff Clark, editor of our BIG GOLD newsletter, recently illustrated what such a super-bubble can look like, citing figures from several historic bull markets. I hesitate to repeat any of his figures because the right junior stocks’ gains when the market goes bubbly are, frankly, hard to believe. However, it is a fact that quite a few junior stocks achieved the much-vaunted 10-bagger status (1,000% gains) in previous bubbles, and some even returned 100-fold.

Here’s the essential reason why junior mining stocks are Doug’s favorite speculations.

Let’s start at the beginning: Doug’s mantra is that one should buy gold for prudence and gold stocks for profit. These are very different kinds of asset deployment.

It’s particularly important not to think of gold as an investment, but as wealth protection. It’s the only highly liquid financial asset that is not simultaneously someone else’s liability. Every ounce of gold you physically possess is value in solid form—there is no short to your long. Come hell or high water, it is value you can liquidate and use to secure your needs. That’s why gold is for prudence.

Gold stocks are for speculation because they offer leverage to gold. This is actually true of all mining stocks and, more broadly, of stocks in commodity-related companies; they all tend to magnify the price movements in the underlying commodity. But the phenomenon is especially strong in the highly volatile precious metals.

Allow me to illustrate—and in an effort to avoid seeming overly promotional, I’ll show how gold stocks’ leverage works on the downside as well as the upside. Bad news first: here’s a chart showing how gold retreated during October and November of 2008, the worst two months of that year’s crash for mining stocks. Also shown are an index of gold juniors and our own portfolio performance. This was, of course, a terrific time to buy, resulting in spectacular gains over the next two years.

Now the good news: here’s a chart showing the performance of the same three things in January and February of this year, which saw a major rally in the gold sector.


Here’s one more, with a particularly telling point to make. This is the stock price of ATAC Resources (ATC.V) over the same time period as the chart above. The point I want to draw your attention to is that the company had no major news during the time period shown. It’s a Yukon gold play, buried deep under the famous snows of the Great White North, so there’s no exploration under way, and there won’t be until the snow melts weeks or months from now.

This third chart shows in one simple yet powerful way exactly why Doug loves buying these stocks when they’re on sale and selling them when they go into bubble mode. ATAC essentially did nothing and still shot up over an order of magnitude more than gold. Note that while this third chart looks like the second, the scales are quite different. (ATAC, by the way, is part of my special report, 10-Bagger List for 2014, that details nine companies I believe could show 1,000% or more returns this year. Note that the report was written before the big move upward you see in the chart above.)

It’s worth emphasizing that ATAC’s performance this year is just on a rebound from recent lows—imagine what a stock like this could do when Doug’s super-bubble for gold stocks arrives.

But what if it doesn’t? Or worse—what if we already missed it?

I remember a conversation with Doug back in 2011, when gold rose to within reach of $2,000 per ounce. Many mainstream analysts said gold was in a bubble. I told Doug I couldn’t understand why anyone would listen to analysts who’ve called the gold trend wrong every year since the current bull cycle started. I remember Doug chuckling and saying: “Just wait and see—this is barely an overture.”

I am certain Doug is right. That’s not because he’s the guru, nor because I’m a nutty gold bug, but because no government in history has ever multiplied its currency base without sparking serious and often fatal inflation. That’s a fact, not an opinion, backed by enough data to make me extremely confident in predicting what lies ahead for the US dollar, even if I can’t say exactly when we’ll reach the tipping point.

Since that 2011 interim peak, as we all know painfully well, gold has backed off on par with the correction in the middle of the great 1970s gold bull market. But economic realities require that the market turn around and head for his long-predicted super-bubble in junior mining stocks before too long. That makes the correction the last, best time to build a substantial position in the stocks best positioned to profit from the coming bubble.

And now Doug is saying that he believes the upturn is at hand. He expects a steadily rising market for a year or two, perhaps more, but not many more, culminating in a market mania for the record books.

Our market does appear to have bottomed. It may take a while to go into its mania phase, but it’s already heating up. No one is going to want to be short when this train leaves the station—and the conductor has blown the whistle.

To find out what you could be missing if you don’t invest in junior mining stocks right now, watch Casey Research’s recent video event, Upturn Millionaires—How to Play the Turning Tides in the Precious Metals Market. With resource and investment experts Doug Casey, Frank Giustra, Rick Rule, Porter Stansberry, Ross Beaty, John Mauldin, Marin Katusa, and myself. Watch it here for free, or click here to find out more about my 10-Bagger List for 2014.


The article Doug Casey’s Coming Super-Bubble was originally published at caseyresearch.com.