The U.S. Dollar Trying to Develop Upward Momentum

The EURUSD Taking the Risk to Fall to 1.3720

The past week has not brought anything new to the overall picture for the EURUSD. The pair traded in the range limited by the support around 1.3790 and the resistance around 1.3864. Yesterday, it tested the support again but failed to move below. The overall picture as well as indicators is neutral. Only the Parabolic SAR is located above the price chart now that may imply a price decline, its minimum target may be the support near 1.3720. Nevertheless, we should not exclude attempts to increase by the 39th figure that should be considered as an opportunity to open short positions.

eur

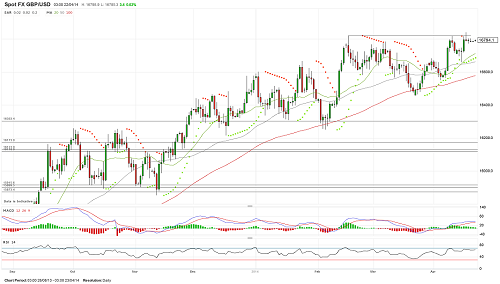
The GBPUSD Attempting to Return to Highs

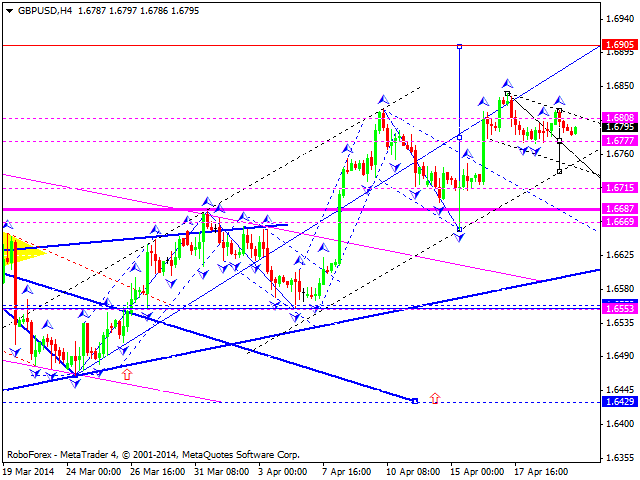
The GBPUSD was declining at first, but data on labour market in Great Britain returned interest to buy the pound. Due to this the pair found the support around 1.6683, from which it was able to rise to the level of 1.6820, overcame it and tested 1.6842. The upward momentum has not received further development, and the pound appeared below the 68th figure again. Nevertheless, demand for it is kept on dips to 1.6774, and it keeps trying to return to current highs. Despite kept positive towards the pound, its ability to continue rising and to move significantly upward casts doubt. In case of the development of a correction, the support around 1.6700-1.6660 will be a target.

gbp

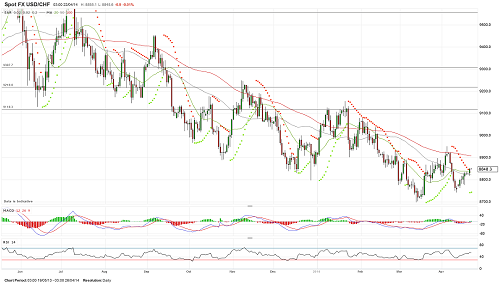
The USDCHF Can Rise To 0.8900

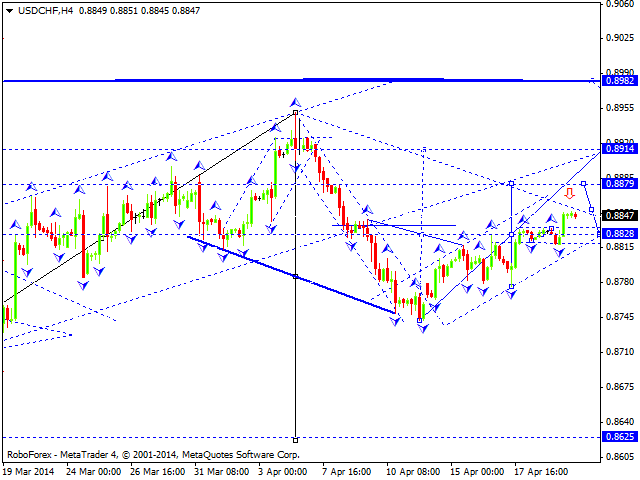
The USDCHF was also in a range. From below its fluctuations were limited by the support around 0.8777, from above by the resistance around 0.8836. With the beginning of this week, the dollar could go slightly higher. Market activity is still at a low level, so it is to wait until it is normalized to be able to objectively evaluate the sentiment of market participants. In general, the dollar looks able to test the 89th figure, rising above which will improve its prospects. Till then one should not exclude testing the 87th figure.

chf

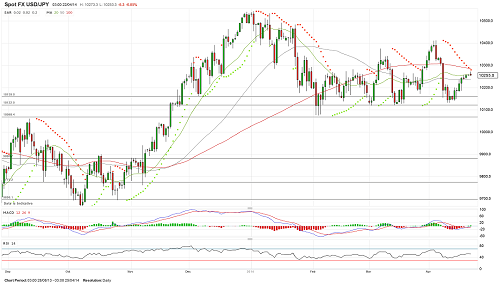
Downside Risks of The USDJPY Are Kept

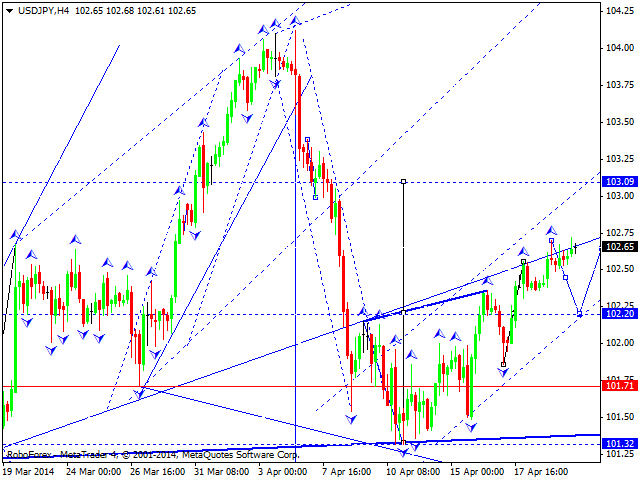
The USDJPY bears failed to consolidate below 101.59. The dollar has managed to return above the level and rose to 102.56. Despite this, risks to resume a decline are kept. Loss of the 102nd figure will lead to testing the support around 101.59 again, but the yen needs to break below 101.22 to develop a larger correction. A rise above 103.00-103.40 can mean resumption of an ascending trend.

jpy


provided by IAFT


Forex Technical Analysis 22.04.2014 (EUR/USD, GBP/USD, USD/CHF, USD/JPY, AUD/USD, USD/RUB, GOLD)

Article By RoboForex.com

Analysis for April 22nd, 2014

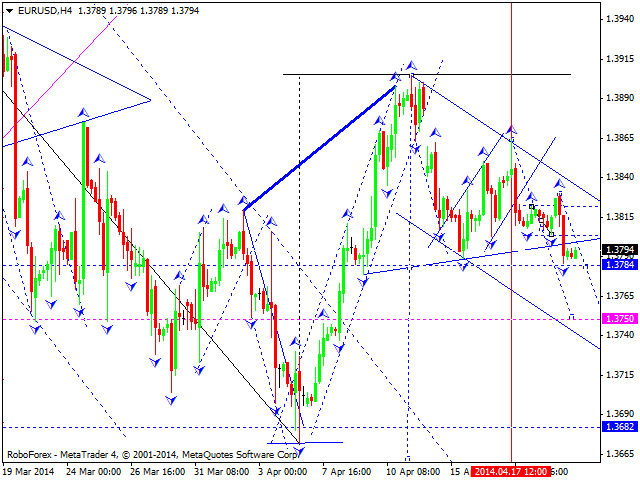
EUR USD, “Euro vs US Dollar”

Euro broke its consolidation channel downwards and today may continue falling down towards level of 1.3750. Later, in our opinion, instrument may move upwards and return to level of 1.3800.

GBP USD, “Great Britain Pound vs US Dollar”

Pound is still moving upwards and forming ascending structure with target at level of 1.6905; right now market is consolidating. If it breaks this consolidation channel upwards, price will reach above-mentioned target. Alternative scenario implies that pair may leave this channel downwards and reach level of 1.6715.

USD CHF, “US Dollar vs Swiss Franc”

Franc is still forming ascending structure with target at level of 0.8800. We think, today price may reach this level, and then start falling down again towards level of 0.8830. Later, in our opinion, instrument may form another ascending structure to renew maximum of this ascending wave.

USD JPY, “US Dollar vs Japanese Yen”

Yen is still moving inside ascending structure with target at level of 103.00. We think, today price may fall down towards level of 102.20 and then start moving upwards to complete this correction. Later, in our opinion, instrument may continue falling down toward level of 100.00.

AUD USD, “Australian Dollar vs US Dollar”

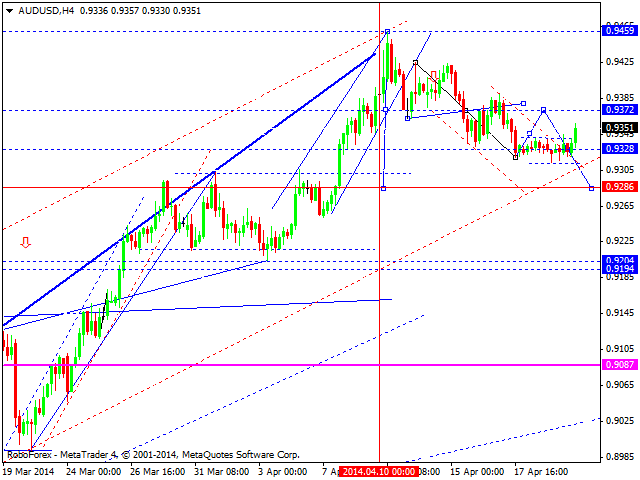
Australian Dollar is returning towards level of 0.9370.  Later, in our opinion, instrument may start forming new descending wave towards next target at level of 0.9286.

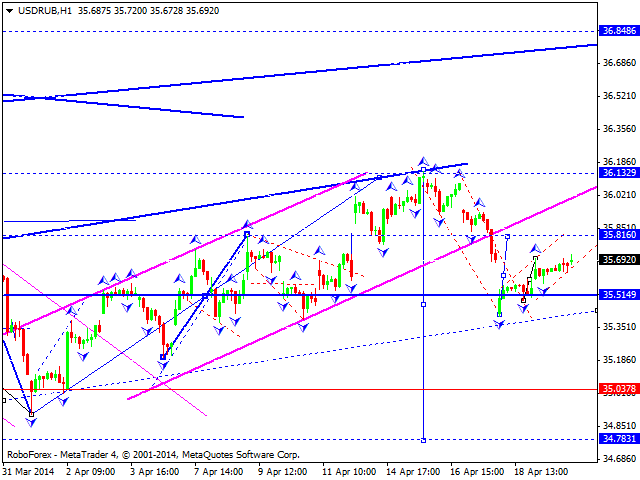
USD RUB, “US Dollar vs Russian Ruble”

Ruble continues moving upwards. We think, today price may reach target at level of 35.81 and then form another descending structure towards level of 34.78. Later, in our opinion, instrument may continue growing up to reach level of 36.00.

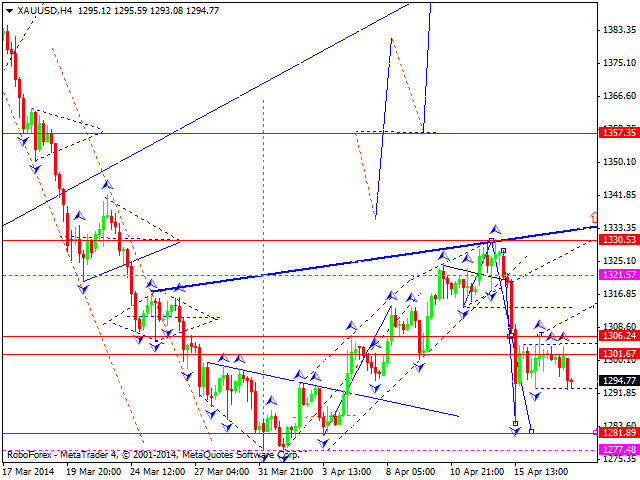
XAU USD, “Gold vs US Dollar”

Gold stopped near lower border of its consolidation channel and is still not traded due to the Easter. After market opening, we think price may continue forming ascending structure towards target at level of 1357.

RoboForex Analytical Department

Article By RoboForex.com

Attention!
Forecasts presented in this section only reflect the author’s private opinion and should not be considered as guidance for trading. RoboForex LP bears no responsibility for trading results based on trading recommendations described in these analytical reviews.


Do You Exhibit Shark Behavior Like David Tepper?

By WallStreetDaily.com Do You Exhibit Shark Behavior Like David Tepper?

Meet David Tepper, the world’s greatest investor.

He’s the Founder of Appaloosa Management, a hedge fund with roughly $20 billion under management. He also owns a chunk of the Pittsburgh Steelers.

While Tepper may look tame in photographs, make no mistake…

He’s a shark in the truest sense of the word.

Last year, Tepper annihilated his competition to the tune of 42% returns.

Over the last five years, he’s generated annualized gross returns as high as 50%.

In 2011, Tepper famously bought a $43.5-million beachfront mega mansion in the Hamptons – just so he could tear it down and build a bigger one.

That’s shark behavior!

I love reporting on the movement of sharks here at Wall Street Daily. So Tepper is someone I’ll be tracking closely throughout the year.

Tepper is presently bullish on U.S. stocks, and is especially bullish on the airline industry.

In fact, Tepper presently owns a massive position in United Airlines (UAL).

He doesn’t hesitate to make monster bets on technology, either.

Tepper previously made a killing on Apple (AAPL), and now owns roughly 236,709 shares of Google (GOOGL), having just added to the position.

But here’s the rub…

Tepper has very obviously recalibrated his trading strategy toward the lightning-quick adoption of new technologies.

Put simply, old rules no longer apply when it comes to tech investing.

You must exhibit shark behavior, which means striking fast.

Bottom line, to mimic the investment success that Tepper is having with technology companies, there’s one subtle nuance to realize.

Below is a “must see” video my staff just produced that perfectly captures this infinitely important subtlety.

Oh, and the video covers everything in less than four minutes.

Cheers to that!

Robert Williams,
Founder, Wall Street Daily

Shark_TN_1

Transcript:

With technology advancing faster than ever, it’s absolutely essential that investors are able to distinguish between the truly disruptive, long-lasting technologies and ones that are just overhyped, passing fads.

And it’s important to do so early in order to maximize profits.

With the general population becoming more tech-savvy and demanding more disruptive technologies, the adaptation of new technologies is happening faster than ever.

Need proof? Just look at the graph, which shows the time it took for major disruptive technologies to gain mass adoption over the past century.

As you can see, technology was slow to catch on with the general public at the turn of the 20th century.

Take electricity, for example – one of the most disruptive technologies in American history. It took approximately 35 years just to reach 70% saturation in U.S. households!

But as we move to newer technologies, like the refrigerator, you’ll notice that the adoption time shortens. It might not seem like it today, but at the time, the refrigerator was a truly disruptive technology. People no longer had to buy ice for their iceboxes. They just plugged in their new refrigerators, and they were set.

The U.S. ice trade was valued at $28 million at the time. When adjusted for inflation, that’s a $660-million industry, wiped out, as households no longer needed ice to keep food fresh. Not only that, but people were able to keep their food at a specific temperature, preventing diseases and saving millions of dollars in spoiled food. Yet this technology still took 25 years to reach 70% adoption.

Another example: color television. While it took a few years to catch on with the general public, you can see that as soon as it did, it happened much faster. It took approximately 15 years to reach 70% saturation in U.S. households.

Its fellow living room innovation – the VCR – took only 10 years to reach saturation. And that was after a sluggish start, due to the highly publicized competition with Betamax tapes.

As we move closer to the present day, you can see how much faster the public adopts new technologies. Air conditioning, the microwave, cellphones…

Now, what about the internet, arguably the most disruptive technology introduced to the American people in history! Well, in 1997, the U.S. Census Bureau started researching the number of households with the internet. It only took 12 years for the internet to reach 70% saturation in U.S. households.

Or the first major release of a smartphone – Apple’s original iPhone in June 2007. By 2013, over 60% of Americans had a smartphone. That’s only six years to reach 60% saturation!

The takeaway here? Technological innovation is happening faster than ever – and so is public adoption.

As an investor, you need to be more aware of the changing consumer technology space, as there are outstanding fortunes to be made on innovative, disruptive technologies being developed. And you stand the best chance of becoming significantly wealthier if you’re able to identify disruptive technologies early, so you can jump on board before everyone else does – and before the technology gains mass adoption. Keep in mind that by the time you see new technologies showing up in the majority of U.S. households, it’s likely too late.

The post Do You Exhibit Shark Behavior Like David Tepper? appeared first on Wall Street Daily.

Article By WallStreetDaily.com

Original Article: Do You Exhibit Shark Behavior Like David Tepper?

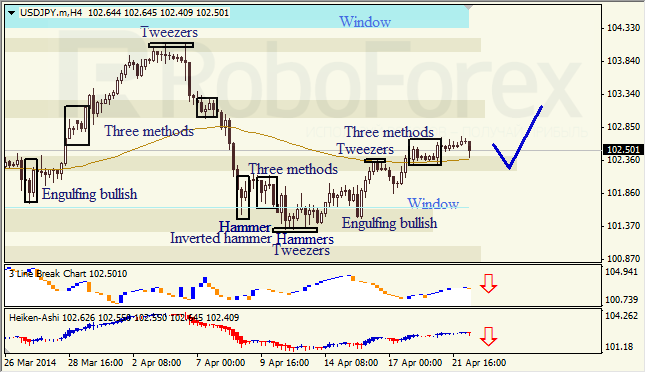
Japanese Candlesticks Analysis 22.04.2014 (EUR/USD, USD/JPY)

Article By RoboForex.com

Analysis for April 22nd, 2014

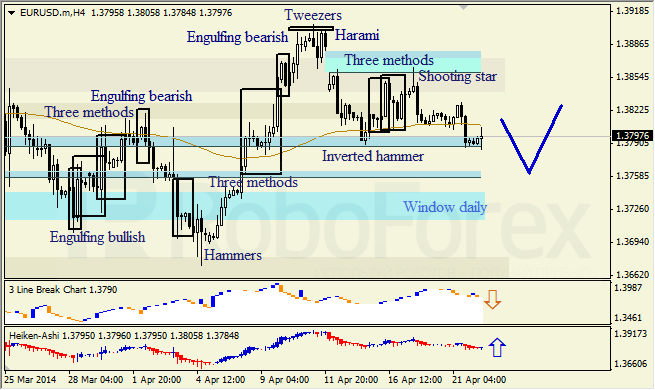
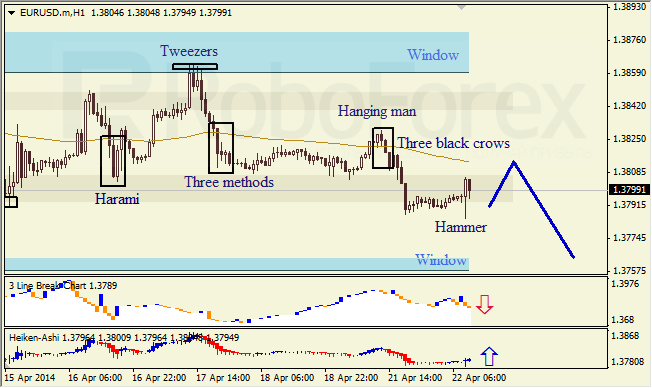
EUR USD, “Euro vs US Dollar”

H4 chart of EUR USD shows descending movement, which is indicated by Shooting Star pattern near resistance from upper Window. Middle Window is support level. Three Line Break chart confirms descending movement; Heiken Ashi candlesticks indicate possibility of bullish pullback.

H1 chart of EUR USD shows bearish tendency, which is indicated by Hanging Man and Three Black Crows patterns. Lower Window is support level. Three Line Break chart confirms bearish movement; Hammer pattern and Heiken Ashi candlesticks indicate possibility of bullish pullback.

USD JPY, “US Dollar vs Japanese Yen”

H4 chart of USD JPY shows ascending movement, which is indicated by Three Methods continuation pattern. Three Line Break chart and Heiken Ashi candlesticks indicate bearish pullback.

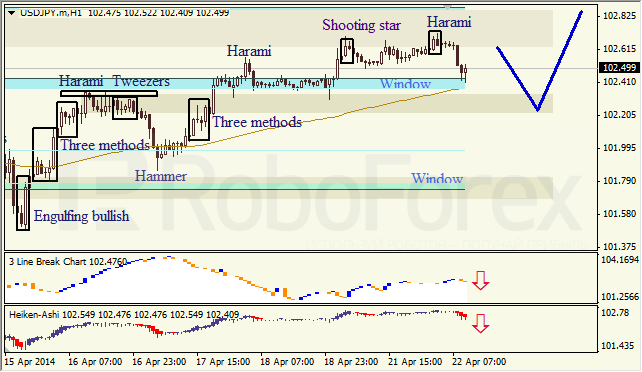
H1 chart of USD JPY shows correction within ascending trend, which is indicated by Harami pattern. Three Line Break chart and Heiken Ashi candlesticks confirm descending movement.

RoboForex Analytical Department

Article By RoboForex.com

Attention!
Forecasts presented in this section only reflect the author’s private opinion and should not be considered as guidance for trading. RoboForex LP bears no responsibility for trading results based on trading recommendations described in these analytical reviews.


Why Even the Bears Should Buy Stocks Now

By MoneyMorning.com.au

It has been a scary few weeks for stocks.

There has been almost non-stop talk of the so-called tech ‘bubble’; bursting.

Add to this the ongoing rumbles in Ukraine, worries about slowing growth in China, and the prospects of Australia entering a recession, and it’s no wonder stocks have fallen.

Even so, what’s the damage?

As it turns out, for most investors it hasn’t been much more than a tiny cut to the flesh.

In fact, since the start of the year the Australian S&P/ASX 200 index is still up 1.9%, and for all the talk of the tech bubble crashing, the NASDAQ index is down just 1.94%.

Should investors see this as a mild tremor before the big event, or should you just ignore the noise and get on with investing?

Here’s our take…

Your editor is in the final week of our three-week stint in Los Angeles, California, one of the earthquake capitals of the world.

According to recent reports, California is due a ‘big one’. This weekend saw an earthquake in Mexico that measured as a magnitude of 7.2. And the two weeks prior to our arrival here saw a number of small-scale temblors that some thought could be a warning sign.

A similar story has played out in the stock market. Investors are looking at all sorts of events and stories and wondering if this is the precursor to the big stock market crash.

If an 8% drop in the NASDAQ is your definition of a crash then that’s what you’ve seen over the past month. But an 8% drop isn’t that uncommon. The issue is what will happen next. That’s where the bearish investors have consistently gotten this market wrong.

Same views, different targets

To be fair, there isn’t that much difference between your editor’s bullish view and many of the ultra-bearish views you see.

That may seem like an odd comment. Your editor is calling for the Australian Share Market to more than triple over the next five years. By contrast our old pal Vern Gowdie has the market falling 90% from today’s levels.

So how can it be possible that our views aren’t that far apart?

The reason is simple: we both see big structural problems with the world economy. We both see that the current boom is simply a result of boom and bust policies (increased credit).

One day that will mean the boom will turn to a bust. We both agree with that. The difference is that your editor believes that the boom has only just started. As a result we’re betting on Aussie stocks to more than triple over the next five years.

One reason for that boom will be the rapid growth of China and other emerging markets. Keep an eye out for more commentary on this from our new emerging markets analyst Ken Wangdong.

On the other side, Vern believes the market is about to hit the skids.

Anyway, getting back to the 8% NASDAQ drop. It’s one thing to have a long-term view on stocks; it’s another thing to take advantage of what have so far turned out to be short-term dips.

This is why we believe it’s much harder to be a bearish investor in this market — it’s much harder to make the most of the volatility.

Here’s why…

Own stocks to boost returns

When you’ve got an overall bullish view of the stock market you can afford to sit through the short-term dips.

You get to cash in any dividends you may get from income stocks, plus you can use spare cash to increase your stock position at a cheaper price.

If the market then reverts to an uptrend then you also get the benefit of capital growth.

On the other hand, for short sellers to play the same game on the short side it means they either have to be always short — which means they’ll accumulate a losing position in an up-trending market — or they need to time the market by shorting and then buying back the stock as the market hits the peaks and troughs.

That’s not impossible, but it’s tough unless you use the right trading tools.

Of course, if you believe the market is heading south it’s hard to justify buying stocks. But it’s also worth asking, what if you’re wrong?

What if stocks don’t collapse?

What if the market continues to rise? Or what if the market even just goes sideways for a long time?

It’s worth asking that question because there can be a big difference between staying in cash and having a combination of cash and dividend-paying stocks. For a start, a cash investment will likely give you no better than a pre-tax 4% income stream.

Meanwhile, a good dividend-paying stock can give you a pre-tax income stream of 6%, 7% or even 8%. It’s why even if you have bearish tendencies, in our view it still makes a lot of sense to invest at least a small portion of your investable assets in stocks.

For most investors we recommend up to 50% in stocks. But even starting off with a 5% or 10% exposure in this volatile market is a good start. That’s especially so after stocks have sold off. It could make a big difference over the next few years as you look to build your wealth.

Cheers,
Kris

From the Port Phillip Publishing Library

The Daily Reckoning: Losing Confidence in the US Dollar

Join Money Morning on Google+


By MoneyMorning.com.au

Why Global Economic Health is More Than Just GDP

By MoneyMorning.com.au

I begin with a strange excerpt from the Financial Times:

Nigeria made a play for recognition as Africa’s biggest economy by changing the way it calculates its gross domestic product. Thanks to the change, the country’s GDP almost doubled, to $509 billion.

Turns out such changes are not uncommon.

Back in 2010, between Nov. 5–6, Ghana’s GDP jumped 60% overnight. It went from a ‘poor’ country to ‘low-middle income’ with the change of a single figure.

And one night in 1987, Italy’s economy grew 20%. It passed the U.K. and became the fifth-largest economy in the world. ‘A wave of euphoria swept over Italians,The New York Times reported at the time.

I could go on…

Today, we take another look at that abstraction called GDP, or gross domestic product — to which far too many investors pay far too much attention. That little figure has quite a history and many problems. To admit a bias, I despise the little bastard.

Diane Coyle is one who does not. Her book GDP: A Brief but Affectionate History inspires this letter. Coyle’s fascinating 140-page book was one of the freebies at Grant’s Spring Investment Conference in New York, and I read it on the train ride home.

Essentially, GDP aims to be a summary of the output in an economy in any year. It gives, proponents say, a measure of size and growth.

It had an ignoble birth.

GDP is one of the many inventions of World War II,’ Coyle writes. I should’ve known. War, of the quartet of infamous horsemen, motivated the first attempts to systematically measure this thing called an economy.

The first stirrings came earlier, in 1665. War was the impetus then too. William Petty tried to assess England and Wales’ ability to fight and finance the Second Anglo-Dutch War. Petty wanted to show that the country could suffer more taxes to take on Holland and France. Another early attempt by an Englishman has a title that makes its aim clear: An Essay Upon the Ways and Means of Supplying the War.

In the US, it was the Great Depression that spurred efforts to get a clearer picture of the economy. The goal was to aid the government in figuring out a way to end the slump. Simon Kuznets won a Nobel Prize for his work during this time. Coyle writes:

His first report, submitted to Congress in January 1934, showed that America’s national income had been halved between 1929–32. Even in those depressed times, the report was a best-seller, at 20 cents a copy, and the first print run of 4,500 copies quickly sold out.

President Roosevelt cited the figures when he launched his recovery program. GDP, then, has been the handmaiden to both war and government expansion. I would argue that has not changed to this day.

What has changed is the math behind the number itself. There was a time, for example, when defence spending was actually subtracted from GNP (which was GDP’s predecessor). But that didn’t work because…well, check out this bit, which Coyle quotes from an official history:

The assessment was overly grim because national income fell short of the total market value of goods and services produced, of which defense spending was a component… By including all government purchases as part of national products, the GNP statistics established the role of national government in the economy as that of an ultimate consumer…

So they didn’t like the story the number told and changed it. This is one of many moves over time. The inclusion of military spending as a positive was also an important shift in thinking. As Coyle writes, ‘For two centuries, ‘the economy’ was the private sector.’ No longer. Now the more the government spends, the more the economy grows, according to GDP.

This sort of gets us to the question of what to count and how to count it. Problems abound.

For example, if you buy a service, it’s counted. If you do it yourself, it isn’t. This reminds me of the example Bill Bonner, our co-founder, likes to use. If you mow your lawn and your neighbour mows his lawn, there is no addition to GDP. But if you pay your neighbour $30 to mow your lawn and he pays you $30 to mow his, then GDP goes up $60.

There are many things like this, including some weird stuff (like hedonic pricing) that just sounds like a bunch of nonsense to me. And GDP deals badly with things like quality and innovation.

Then there are currency adjustments that foul things up mightily. In 2007, the World Bank lopped off 40% from China’s GDP because of currency adjustments. That wasn’t even the biggest change. Ghana lost 52% of its GDP that year. Yet I’m sure the working man in Ghana woke up that morning and found his life hadn’t changed a bit…

But the real story of GDP, to me, is how political it has become.

This gets us back to those big jumps in GDP that I started with. In fact, Coyle opens her book with the story of Andreas Georgiou, head of Elstat (Greece’s official statistical agency) facing criminal charges and a parliamentary inquiry. She writes:

His crime? Trying to produce accurate statistics on the Greek economy after decades during which official statisticians had massaged figures at the behest of politicians.

Greece needed loans. Getting them depended on meeting ‘tough targets for reducing how much the government was spending and borrowing’. So they made up the numbers to get the loans.

I’m reminded of what Herodotus once wrote of the Persians: ‘To tell a lie is considered by them the greatest disgrace, and next to that to be in debt…especially because they think that one in debt must of necessity tell lies.

So now you understand the game afoot.

Now you know why countries fiddle around with their GDP. They have…motives. They want loans, as in the case of Greece. Or they want aid, as in the case of certain African countries. Richer countries play the game too. All governments use GDP to show a certain picture to their electorate or to potential investors.

Nonetheless, Coyle comes to a charitable conclusion at the end of the book. She writes that ‘we should not be in a rush to ditch GDP,’ and says it has its points. ‘GDP does a good job of measuring how fast (or not) the output of ‘the economy’ is growing,’ she writes, ‘and GDP growth is closely linked to social welfare.

She acknowledges the challenges and shortcomings, but still has warm words for her troublesome protagonist. ‘At present, we are in a statistical fog,’ she concludes, ‘[but] GDP, for all its flaws, is still a bright light shining through the mist.

I beg to differ.

GDP is an abstraction too far removed from reality. Yet people make real-world policy on this fantasy as well as a witch’s brew of sister concoctions. We look to boost GDP or lower the unemployment rate or manage inflation through the CPI.

This reminds me of what Paul Goodman once wrote about how the machine starts to run for its own sake. These things replace the reality they tried to represent. So GDP goes up even though the quality of life has gone nowhere; the unemployment rate falls, but tens of millions can’t find work and stop looking; and inflation is low even as people find their expenses going up.

I say let’s ditch GDP. It’s not a bright light in the fog. It is the fog.

Chris Mayer,
Contributing Editor, Money Morning

Ed Note: The above article was originally published in The Daily Reckoning US.

From the Archives…

Join Money Morning on Google+


By MoneyMorning.com.au

Sri Lanka maintains rates, poised for strong performance

By CentralBankNews.info
    Sri Lanka’s central bank maintained its monetary policy stance, as expected, and said the country’s economy was poised for a stronger performance on the back of a recovery in the external sector, sustained momentum in construction and manufacturing, and low and stable inflation.
    The Central Bank of Sri Lanka kept its Standing Deposit Facility Rate (SDFR) at 6.50 percent and the Standing Lending Facility Rate (SLFR) at 8.0 percent. The central bank rejigged its policy framework in January with the SDRF rate replacing the previous benchmark repo rate.
    Sri Lanka’s headline inflation rate was steady at 4.2 percent in March and February and the central bank expects inflation to remain in mid-single digits throughout the year although there might be some price pressures from supply disruptions linked to drought.
    The central bank targets inflation of 4-6 percent this year and 3-5 percent in 2015 and 2016. In 2013 the central bank cut the benchmark rate by 100 basis points to boost economic growth, which rose to 7.3 percent in 2013 from 6.3 percent in 2012.

    But the central bank said credit to the private sector only grew by a modest 4.4 percent in February from the same month last year, down from 5.2 percent in January. Credit obtained by public corporations declined further in February and continued fiscal consolidation, together with the proceeds of a sovereign bond issue in April is expected to ease the public sectors reliance on bank financing in coming months.
    “The resulting release of funds for private investments bolstered by sufficient market liquidity levels would provide the necessary stimulus to strengthen private sector activity and in turn, as expected, expand credit growth from the second quarter onwards,” the bank said.
   Sri Lanka’s Gross Domestic Product expanded by an annual 8.2 percent in the fourth quarter of 2013, and the central bank has forecast 7.8 percent growth for 2014.
    Inflows of workers’ remittances rose significantly in February and earnings from tourism also rose in the first quarter, the bank said, adding that gross official reserves were estimated at around US$ 8.0 billion at the end of February, the equivalent of 5.3 months of imports. Reserves are expected to rise further with the proceeds of this month’s $500 million sovereign bond.

    http://ift.tt/1iP0FNb


Willem Middelkoop and Terence van der Hout: Turnaround Stories Revolve Around Proven Management

Source: JT Long of The Gold Report (4/21/14)

http://www.theaureport.com/pub/na/willem-middelkoop-and-terence-van-der-hout-turnaround-stories-revolve-around-proven-management

Willem Middelkoop and Terence van der Hout of the Netherlands-based Commodity Discovery Fund believe that when the world’s reserve currency is reset away from the U.S. dollar in the next decade, gold prices will rise and mining equities will follow. Van der Hout and Middelkoop tell The Gold Report that by focusing on producers, near-producers and turnaround stories, they plan to capitalize on the opportunities in North America, Africa and beyond.

The Gold Report: Willem, your first book predicted the collapse of the global financial system a year before the 2008 fall of Lehman Bros. In your new book “The Big Reset: War on Gold and the Financial Endgame,” you’re predicting the demise of the dollar as the reserve currency by 2020. You said it can occur as a carefully planned event or as the result of a crisis. What would these two scenarios look like?

Willem Middelkoop: Authorities always prefer to act within a well-planned scenario. The U.S. and the International Monetary Fund (IMF) understand that the U.S. dollar has to be replaced one day. It could be 2020. It could be 2018. It could be 2023. It has to be replaced by another anchor to support the worldwide monetary system.

Gold-Report1Both the U.S. and the IMF will try to stay in the driver’s seat as they propose the transformation of the worldwide financial system. They could introduce special drawing rights (SDRs), an international reserve asset created by the IMF in 1969 to supplement its member countries’ official reserves. Its value is based on a basket of four key international currencies, and SDRs can be exchanged for freely usable currencies. The U.S. and the IMF could propose that the SDRs be used to replace the dollar as the anchor for the worldwide financial system.

However, the IMF and its partners, the central banks around the world, will need at least five more years to prepare the system for such a change. A crisis of confidence around the dollar could occur before the IMF and its partners are ready for a reset operation. If a crisis of confidence occurs, the IMF would have to mount a rescue operation to save worldwide trade, as we saw in early 2009. We had some similar, but smaller, resets following the crisis in Germany after the Weimar hyperinflation in 1923 and, more recently, in Cyprus.

The SDRs could act like a monetary umbrella and consist of dollars, euros, British pounds and Chinese yuan after a monetary reset.

TGR: A lot of this plan is going on backstage. Most people don’t know about it. What signs should we look for to signal the shift so we can adjust our portfolios?

WM: This is a very important question. Investors need to understand that such a transformation in our monetary system might be introduced over a weekend. In Cyprus, there were not many warning signs. That’s why I started a new blog called thebigresetblog.com, where I follow the latest information, and I’m publishing the latest signs pointing toward such a reset. On March 17, I published a story that was based on an interview with George Soros. In that interview with The Financial Times, Soros said the system is broken and needs to be reconstituted. I also published an interview with Christine Lagarde, head of the IMF. She used the term “reset” multiple times in interviews during the World Economic Forum.

Another important sign is an editorial by the Chinese state press agency recently saying that the time has come for a new international reserve currency to be created to replace the dominant U.S. dollar.

Both East and West sent out specific signals pointing toward this transformation. Of course, it’s important to watch the gold and dollar charts on a daily basis, because when a reset is close, you can expect major moves.

TGR: What does this mean for gold? The signs are out there—why is the price hovering around $1,300/ounce ($1,300/oz)?

WM: It’s quite easy to understand why central banks would like to revalue gold to devalue the dollar at a certain stage of this reset. The U.S.’s official gold reserves, which are still 8,000 tons, are valued at the historical cost price of $42/oz. A revaluation toward $4,200/oz would grow the value of these gold reserves from the current $11 billion ($11B) to $1.1 trillion. Without such a revaluation, gold prices will have to rise as well given the structural deficits in the gold market. Worldwide gold production can’t keep up with the growing demand for physical gold. Recent figures by the World Gold Council show a deficit of 700 tonnes physical gold.

We have seen lots of manipulation of the gold price, similar to the 1960s when the London Gold Pool was keeping gold prices at $35/oz. Central bankers have done this for a number of years by selling large amounts of gold from the official reserves of Western central banks. We’ve seen another round of manipulation of the gold price in the last few years. This can’t go on for another 5 to 10 years.

TGR: If the gold price went up, would the precious metals mining stocks follow or, because of the manipulation, would there not be a connection?

WM: The gold price started to rise at the end of December. When the gold price went up 10%, precious metal mining stocks went up sometimes as much as 30%. Investors will come to understand that the gold price might trade higher in the following weeks and months, and precious metal mining stocks should also go higher.

Countries like China and Russia are also growing their gold reserves enormously. With estimates for yearly deficits in the physical gold market up to around 1,000 tons/year, more investors see precious metal companies as the only ones that own huge amounts of physical tons still in the ground. When they can be sold at higher prices, these companies will become hugely profitable.

We’ve seen that in the past. In the 1970s, we had the last gold rush and lots of free cash flow was generated by gold and silver producers. In the late 1970s and the early 1980s, these amounts were enormous. Senior producers had gains of 200–300% in the last two years of the gold bull market. The junior producers and the exploration companies showed gains of more than 1,000% on average.

TGR: What markets do you think are good right now? What commodities do you like?

WM: We still have 60% of our equity investments in gold-related equities, 20% in silver-related and the last 20% in base metals and specialty metals. The only change in the last two years has been that we decreased our investment in exploration companies and increased our investment in royalty companies and senior producers.

TGR: Why was that?

WM: Because of the low valuation in the correction since the middle of 2011. The valuation for gold producers became almost laughable. Of course, a producer, which is creating cash flow and is still profitable at these prices, has only upside in the current market. It was a defensive move. The current bidding war concerning Osisko shows it was a smart move to add to our position during the down turn.

Terence van der Hout: Technically, an exploration company that has no assets can just go to zero—there are a number that are doing that—whereas producers will always be worth something, even at fire sales.

That’s another consideration that we’ve been looking at on the downside. Very recently, we’ve been subtly shifting from producers and near-producers to advanced developers. We see a turn in the markets. Those companies are well leveraged to the gold price and have a fairly extreme undervaluation to catch up with. Normally, they will be revalued to something relating to the amount of resource they produce.

One of the companies that we’ve been invested in for a while is OceanaGold Corp. (OGC:TSX; OGC:ASX). It has been producing gold in New Zealand at a steep cost, but it has a gold-copper deposit it brought to production in the Philippines that is performing very well. It’s a classic story of a startup producer that is beginning to be valued at its full potential.

TGR: Do you think it’s beginning to be recognized by the market because of the diversification of the company or because of the new resource and reserve that it came out with?

TvdH: It was a function of OceanaGold’s performance in production rather than the resource update. The added resources were mainly from its newly acquired El Salvador project, which is miles away from production. OceanaGold is finally being rewarded in a market that’s turning.

TGR: What other companies fit that model?

TvdH: Lake Shore Gold Corp. (LSG:TSX) is similar in the sense that it’s showing a turnaround. It was run as an exploration company while it was producing. Lake Shore has a wonderful land package, but it should have been focused fully on production. It made a number of changes about a year ago and became cash-flow positive in the last two quarters.

WM: And profitable even with the current gold price.

TvdH: It’s a good turnaround story.

TGR: Does Lake Shore have any catalysts coming up that will help the market see what a turnaround it has made?

WM: Given the current uptrend for gold prices, companies like Lake Shore Gold, which are already profitable at these low numbers, are becoming very profitable when the gold price regains some of its value toward $1,400/oz. We expect the gold price to move up toward $1,500/oz, and then these kinds of smaller producers that have turned the corner will react strongly in this better pricing environment.

TvdH: The same goes for Detour Gold Corp. (DGC:TSX), which is similar to the Osisko Mining Corp. (OSK:TSX) project that’s now in the throes of being taken over by a major. It has the same style of deposit. It’s open pit, low grade and bulk mineable. It’s been cheap to extract.

Detour was expecting a quicker ramp-up with fewer problems getting to full production. Now it’s focused on getting the right mine sequence. It has also made a few management changes. Detour isn’t cash-flow positive yet, but it’s on the right track.

Much like Osisko, it’s a no-brainer that Detour could be taken over sometime in the future. It will be revalued, particularly at the takeover stage.

WM: Since our start in July 2008, we have had 25 takeover situations in our portfolio. The ongoing bidding war between Goldcorp Inc. (G:TSX; GG:NYSE) and Yamana Gold Inc. (YRI:TSX; AUY:NYSE; YAU:LSE) for the Osisko projects is the 25th.

Detour is the largest Canadian gold mine, and it just started producing. Looking at the market cap, we get all the gold resources thrown in for free. The current market cap is a little shy of the total capital expenses to build the mine. There’s great value still to be seen in the market.

Investors should be taking advantage of the current situation. There’s more deal flow in the market. Almost every week, we see the start of a new mining or private-equity fund focused on mining. There was a new fund started by some JPMorgan bankers. The Carlyle Group just started a new commodity fund. Billions and billions are fleeing into the market. This gives us confidence that the bottom has been set.

TvdH: Another company that stands out for me is Midas Gold Corp. (MAX:TSX), which is developing a gold-antimony project in Idaho. There is currently no antimony production in the U.S. It has been designated as a critical mineral, but it is largely sourced from China, which has put some export restrictions on antimony during the last several years. Furthermore, Midas’ project is large. It will be relatively cheap to build. Because of the antimony kicker, which is about $10/kilogram, we expect the mine will be cheap to operate. Idaho is also a derisked jurisdiction. A couple of mines already operate in Idaho, and the Midas gold project is designated as a brownfield site, which should make the permitting quicker.

TGR: Midas just did a $10 million ($10M) private placement. Do you know how it plans to use those funds to add value?

TvdH: We were lucky to have a small share of that private placement. It is putting at least part of that money into advancing toward the prefeasibility stage and deciding what kind of processing it will employ—bio-oxidation (BiOx) or normal solvent extraction. A prefeasibility study and the subsequent environmental impact statement would come along later this year.

WM: We still have a very big focus on new discoveries. Our research department is very active and is always on the hunt for new discoveries. We love the discoveries by Probe Mines Limited (PRB:TSX.V), Fission Uranium Corp. (FCU:TSX.V) and Reservoir Minerals Inc. (RMC:TSX.V).

TvdH: Probe was looking at classic, low-grade, large, open-pit bulk mining in Canada until it discovered a high-grade zone at depth and along strike. That was the signal for Agnico-Eagle Mines Ltd. (AEM:TSX; AEM:NYSE) to take a 9.9% stake in the company. That started its performance on the stock market as well.

Probe is becoming a bit of a different beast. It has shown that the high-grade area is consistent; it’s now a matter of finding how long it is because it does need a certain volume. It would require an underground operation. Probe is drilling that area; if that shows upwards of 1 million ounces (1 Moz), it might make it to an underground mine as a standalone, apart from the open pit that Probe was looking to develop previously. It becomes a completely different kind of project from then on.

TGR: When might those results be in?

TvdH: Probe has been drilling since February. A few results have come in, but not quite the stepouts that we’d expected. I’m assuming that results will be coming in over the next couple of months.

WM: It is an important discovery for Ontario because it changes the whole geological understanding of this part of Canada. It’s important for investors to study this one.

The discovery by Fission in the Athabasca Basin is too important to ignore, too. We’ve been big investors from the start of Fission. We were investors in Hathor Exploration, which was taken over two years ago. We were investors in the previous Fission company, which made the discovery along with Hathor. It’s one of those world-class discoveries that can create billions in value. It still has a 100% hit rate—and if the deposit keeps growing, I wouldn’t be surprised to see more than 100 million pounds of uranium in this discovery.

TGR: And Fission has had a nice effect on all of the other companies in the Athabasca as well.

WM: Yes, because it convinces us that the only good place to hunt for new uranium discoveries is this Athabasca Basin.

TvdH: Interestingly, next-door neighbor NexGen Energy Ltd. (NXE:TSX.V) has made a discovery on a separate conductor to the one that Fission is drilling on, which implies that any of the conductors—Fission has loads of conductors on the rest of its property—could hold a similar amount of mineralization. That’s what gets the excitement going.

WM: A lot of blue sky still. I expect a bidding war on this Fission discovery within the next 12 to 18 months. It’s too big and it’s too important for the major producers worldwide to ignore. There will be lots of Asian interest for this one as well.

TGR: Is there another discovery near Vancouver?

TvdH: Falco Pacific Resource Group (FPC:TSX.V) is a fascinating story. The company purchased a drill database, which was not digitized, from Noranda Inc. It purchased the property for $5M and 7M in shares. Without one drill hole, it now has a deposit of 2.2 Moz, grading about 3.4 grams per ton (3.4 g/t) underground. On the face of it, you’d say the grade would be a bit dodgy, but Noranda had built the mine almost to the stage of opening it. It put in all the underground workings. It put in the mill. Then it realized it was gold, it wasn’t a base metal, which was the focus of the company at the time. Then it had a merger with Falconbridge Ltd. Falconbridge was taken over by Xstrata plc (XTA:LSE) and this project was completely forgotten until Falco Pacific picked it up not too long ago.

Falco’s project is smack in the middle of the old Noranda gold district. It has a good management team led by Chairman Darin Wagner, who was involved in West Timmins Mining Inc., which sold to Lake Shore Gold. Howard Poulsen, a well-known geologist, is on its technical advisory board. Mike Byron, the vice president of exploration and a director, has more than 25 years in the field. If it can show a few more ounces, then this could be a nice mine at a cutoff of 3 g/t.

TGR: A number of the companies in your fund are in Africa. How do you assess risk for a given region in Africa?

TvdH: There are various types of risks in Africa. There is a cost risk in West Africa because power is expensive and infrastructure is lacking. South Africa has energy issues and social and labor unrest. We have 70% of our portfolio invested in less risky areas, like North America. We used to avoid South Africa entirely, but something has changed in the way that we look at platinum.

Platinum Group Metals Ltd. (PTM:TSX; PLG:NYSE.MKT) is developing a classic platinum mine in South Africa—a thin reef mine, which will be labor intensive. But it has also come up with a new discovery at Waterberg. It’s not a 30-centimeter thick layer of platinum-enriched rock—it’s anywhere between 5–20 meters and wider. It’s amenable to underground bulk mining methods, which makes mechanization possible. That keeps the project largely aloof from the labor unrest issues.

Waterberg also has enormous size potential. The current size of the deposit is already world class. Platinum Group Metals made a stepout of about 5 kilometers (5km) recently, and it hit the same mineralization at a certain depth. Just a few weeks ago, it announced a 16km stepout had hit another mineralized structure. It owns about 23km of strike length. There is still huge blue sky on that project.

We very much like the future for platinum group metals (PGMs) given that the Chinese automobile market is exploding and will need all the PGMs that the world can provide.

The Waterberg project and Ivanhoe Mines Ltd. (IVN:TSX) Platreef project are the future of platinum mining in South Africa.

WM: Platinum and palladium are very interesting for investors right now. The current supply and demand prognosis for palladium and platinum indicates shortages. These shortages will be structural. The palladium market will soon demand 9 Moz/year. The production will only be around 6 Moz—there’s a huge deficit. Platinum and palladium are especially important to Asia, where they are used in the exhaust systems of cars, to combat the smoke and air pollution.

TGR: Interesting. Where else are you focusing in Africa?

TvdH: We’ve been watching Asanko Gold Inc. (AKG:TSX; AKG:NYSE.MKT) in Western Africa for a long time. It used to be called Keegan Resources. It was doing very well on the exploration front and then there was a management and name change. Along came Peter Breese. He has a huge track record. He has developed seven mines, which he sold to Norilsk for $6B. He developed, built and sold off a uranium company for $1B. If this gentleman steps into a project, he’s not there just to pick up a paycheck. He’s there to build mines.

Breese, who is president and CEO of Asanko, brought about the merger with PMI Gold Corp. in February. He now has a huge cash position. He’s fully financed to bring a decent-grade project to production in Ghana by 2016.

TGR: You seem to like these turnaround stories.

WM: A strong, proven, successful mine manager or entrepreneur can build companies time and again. The longer we are in this business—we’re investors for more than 10 years now—the more we try to follow the good management teams.

TvdH: That’s a derisking aspect of the business: management. Management is one of the prime parameters for us.

WM: However, we’re quite fed up with the high salaries being paid to executives running companies that don’t perform. The industry has to understand that investors are taking these compensation packages into consideration when they decide if they should invest or not.

TGR: Do you predict an impact from the conflict in Russia as it is a supplier of PGMs?

WM: Only if more sanctions are applied. Russian President Vladimir Putin understands how vulnerable the U.S. and the U.S. dollar have become. If strong sanctions were applied against Russia, it would be very easy for the Russians to stop selling oil in dollars and start selling it in yuan, rubles or even in gold. The U.S. knows it should be careful not to make Putin too mad because the dollar is too vulnerable. This is why no strong sanctions have been implemented until recently.

TvdH: Last week, Russia-based Norilsk Nickel (GMKN:RTS; NILSY:NASDAQ; MNOD:LSE) made a deal with Chinese and Japanese buyers of palladium, which could tie up large quantities for the next five years. These are interesting deals because in the past Norilsk was just selling palladium at the spot price, whereas now the Chinese and the Japanese are seeing the strategic aspect of palladium and are willing to tie it up for longer periods to ensure their supply chain.

TGR: Any final advice for our readers as we’re going into this shifting world?

WM: I would like to talk a little about silver. We talked a lot about gold, and gold is very important. It’s my opinion that gold will come back in the monetary system. I don’t expect a full gold standard, but gold will become more important. But silver is poor man’s gold. When the gold price goes up too much, more people start to buy silver instead. However, there are no large, above-the-ground stockpiles available anymore. Silver was still used to produce coins until the 1980s. These above-the-ground silver stockpiles are almost completely gone. We’re very interested in great silver companies with lots of ounces in the ground.

TGR: Thank you both for your time.

Willem Middelkoop is a successful entrepreneur and publicist from The Netherlands. He is a former market commentator for Dutch National TV, founder of Amsterdamgold.com, a web shop for gold and silver bullion that was sold in 2011, and founder of the Commodity Discovery Fund, where he is currently the principal. Middelkoop is a member of the Advisory Board of the London-based Official Monetary and Financial Institutions Forum (OMFIF). He is author of several books covering financial markets and the economy. His most recent book, “The Big Reset,” his first book in English, was published at the end of 2013 and will be published in Chinese later this year.

Terence van der Hout is a senior researcher at the Netherlands-based Commodity Discovery Fund. The fund focuses on investing in world-class natural resources discoveries in precious metals, base metals and specialty metals, as well as undervalued start-up producers. Van der Hout also distributes Strategic Metals Bulletin, a free, monthly commentary on developments in the world of critical metals. To subscribe, please send an e-mail to: [email protected]. Van der Hout has a background in finance and holds a master’s degree in administration in political science from the University of Leiden.

Want to read more Gold Report interviews like this? Sign up for our free e-newsletter, and you’ll learn when new articles have been published. To see recent interviews with industry analysts and commentators, visit our Streetwise Interviews page.

DISCLOSURE:

1) JT Long conducted this interview for Streetwise Reports LLC, publisher of The Gold Report, The Energy Report, The Life Sciences Report and The Mining Report, and provides services to Streetwise Reports as an employee. She owns, or her family owns, shares of the following companies mentioned in this interview: None.

2) The following companies mentioned in the interview are sponsors of Streetwise Reports: Probe Mines Limited and Fission Uranium Corp. Goldcorp Inc. is not associated with Streetwise Reports. Streetwise Reports does not accept stock in exchange for its services.

3) Terence van der Hout: I own, or my family owns, shares of the following companies mentioned in this interview: None. I personally am, or my family is, paid by the following companies mentioned in this interview: None. My company has a financial relationship with the following companies mentioned in this interview: None. The Commodity Discovery Fund owns shares in Asanko Gold Inc., Detour Gold Corp., Midas Gold Corp., Fission Uranium Corp., Osisko Mining Corp., OceanaGold Corp., Lake Shore Gold Corp., Goldcorp Inc., Yamana Gold Inc., Probe Mines Limited, Reservoir Minerals Inc., NexGen Energy Ltd., Falco Pacific Resource Group and Platinum Group Mining Ltd. I was not paid by Streetwise Reports for participating in this interview. Comments and opinions expressed are my own comments and opinions. I had the opportunity to review the interview for accuracy as of the date of the interview and am responsible for the content of the interview.

4) Willem Middelkoop: I own, or my family owns, shares of the following companies mentioned in this interview: None. I personally am, or my family is, paid by the following companies mentioned in this interview: None. My company has a financial relationship with the following companies mentioned in this interview: None. The Commodity Discovery Fund owns shares in Asanko Gold Inc., Detour Gold Corp., Midas Gold Corp., Fission Uranium Corp., Osisko Mining Corp., OceanaGold Corp., Lake Shore Gold Corp., Goldcorp Inc., Yamana Gold Inc., Probe Mines Limited, Reservoir Minerals Inc., NexGen Energy Ltd., Falco Pacific Resource Group and Platinum Group Mining Ltd. I was not paid by Streetwise Reports for participating in this interview. Comments and opinions expressed are my own comments and opinions. I had the opportunity to review the interview for accuracy as of the date of the interview and am responsible for the content of the interview.

5) Interviews are edited for clarity. Streetwise Reports does not make editorial comments or change experts’ statements without their consent.

6) The interview does not constitute investment advice. Each reader is encouraged to consult with his or her individual financial professional and any action a reader takes as a result of information presented here is his or her own responsibility. By opening this page, each reader accepts and agrees to Streetwise Reports’ terms of use and full legal disclaimer.

7) From time to time, Streetwise Reports LLC and its directors, officers, employees or members of their families, as well as persons interviewed for articles and interviews on the site, may have a long or short position in securities mentioned. Directors, officers, employees or members of their families are prohibited from making purchases and/or sales of those securities in the open market or otherwise during the up-to-four-week interval from the time of the interview until after it publishes.

Streetwise – The Gold Report is Copyright © 2014 by Streetwise Reports LLC. All rights are reserved. Streetwise Reports LLC hereby grants an unrestricted license to use or disseminate this copyrighted material (i) only in whole (and always including this disclaimer), but (ii) never in part.

Streetwise Reports LLC does not guarantee the accuracy or thoroughness of the information reported.

Streetwise Reports LLC receives a fee from companies that are listed on the home page in the In This Issue section. Their sponsor pages may be considered advertising for the purposes of 18 U.S.C. 1734.

Participating companies provide the logos used in The Gold Report. These logos are trademarks and are the property of the individual companies.

101 Second St., Suite 110

Petaluma, CA 94952

Tel.: (707) 981-8999

Fax: (707) 981-8998

Email: [email protected]


Stock Market Review 21th April

By HY Markets Forex Blog

Following the Easter break, some of the market resumed as stocks in the Europe posted a higher weekly gain while stocks in the Asian region were mostly mixed, with stocks in China falling.

In China, stocks were seen falling as the benchmark index dropped to its lowest in five weeks, on worries new shares sales could draw funds from existing equities. In Asia, most of the markets across the region are closed for a holiday.

Meanwhile in Russia, stocks were seen climbing the most in over three weeks after the country held talks with representatives from Ukraine, the US and the European Union finalizing an agreement to ease tensions.

In Europe, France’s CAC 40 climbed 1.5% higher, while the German DAX index gained 1% at the time of writing. At the same time the Europe Stoxx 600 Index rose 1.1% to 332.43, while the UK benchmark FTSE 100 advanced 1%.

Market – Asia

The benchmark Nikkei closed flat at 14,512.38, after rising to 14,649.50 on April 8. While Tokyo’s Topix index edged 0.2% lower to 1,171.40, with trading volume 27% lower than average in the last 100 sessions. The new JPX-Nikkei Index 400 fell 0.2% lower to 10,655.42.

The MSCI Asia Pacific Index edged 0.1% lower to 139.03 at the time of writing, while the yen weakened further against the greenback after Japan reported its trade deficit widened more than estimated last month.

China

In China, the Shanghai Composite Index fell 1.5% to 2,065.83, the most since March 10. The gauge slid by 1.5% last week following the release of a data that showed that the country’s economy growth slowed down to it’s weakest in six quarters.

“Investors are still mainly concerned about the resumption of IPOs,” said Zhou Lin, an analyst at Huatai Securities Co. in Nanjing. “There are worries about tighter liquidity from the IPOs and that the pace of approvals will be faster than expected. Stocks are likely to fall for the rest of the month.”


At close of trading the main World Stock Markets were as follows:

FTSE 100                                                      6,625.11

Dow Jones I.A                                          16,408.54

Nasdaq Composite Index                 4,095.52

Nikkei225                                                   14,512.38

Hang Seng                                                  22,760.24

CAC 40                                                          4,431.81


Visit www.hymarkets.com   to find out more about our products and start trading today with only $50 using the latest trading technology today

The post Stock Market Review 21th April appeared first on | HY Markets Official blog.

Article provided by HY Markets Forex Blog