Not All Debt Is Created Equal

By Dennis Miller

Optimal diversification: We all want it. Diversification is, after all, the holy grail of portfolio management. Our senior research analyst Andrey Dashkov has said that many times before, and he echoes that refrain in his editorial guest spot below.

A brief note before I hand over the reins to Andrey. The last time the market tanked, many of my friends suffered huge losses. They all thought their portfolios were well diversified. Many held several mutual funds and thought their plans were foolproof. Sad to say, those funds dropped in tandem with the rapidly falling market. Our readers need not suffer a similar fate.

Enter Andrey, who’s here to explain what optimal diversification is and to share concrete tools for implementing it in your own portfolio.

Take it away, Andrey…

Floating-Rate Funds Bolster Diversification

By Andrey Dashkov

Floating-rate funds as an investment class are a good diversifier for a portfolio that includes stocks, bonds, and other types of investments. Here’s a bit of data to back that claim.

The chart below shows the correlation of floating-rate benchmark to various subsets of the debt universe.

As a reminder, correlation is a measure of how two assets move in relation to each other. This relationship is usually measured by a correlation coefficient that ranges from -1 to +1. A coefficient of +1 says the two securities or asset types move in lockstep. A coefficient of -1 means they move in opposite directions. When one goes up, the other goes down. A correlation coefficient of 0 means they aren’t related at all and move independently.

Why Correlation Matters

Correlation matters because it helps to diversify your portfolio. If all securities in a portfolio are perfectly correlated and move in the same direction, we are, strictly speaking, screwed or elated. They’ll all move up or down together. When they win, they win big; and when they fall, they fall spectacularly. The risk is enormous.

Our goal is to create a portfolio where securities are not totally correlated. If one goes up or down, the others won’t do the same thing. This helps keep the whole portfolio afloat.

As Dennis mentioned, diversification is the holy grail of portfolio management. We based our Bulletproof strategy on it precisely because it provides safety under any economic scenario. If inflation hits, some stocks will go up, while others will go down or not react at all.

You want to hold stocks that behave differently. Our mantra is to avoid catastrophic losses in any investment under any scenario, and the Bulletproof strategy optimizes our odds of doing just that.

When “Weak” is Preferable

Now, a correlation coefficient may be calculated between stocks or whole investment classes. Stocks, various types of bonds, commodities—they all move in some relationship to one another. The relationship may be positive, negative, strong, weak, or nonexistent. To diversify successfully and make our portfolio robust, we need weak relationships. They make it more likely that if one group of investments moves, the others won’t, thereby keeping our whole portfolio afloat.

Now, back to our chart. It shows the correlation between investment types in relation to floating-rate funds of the sort we introduced into the Money Forever portfolio in January. For corporate high-yield debt, for example, the correlation is +0.74. This means that in the past there was a strong likelihood that when the corporate high-yield sector moved up or down, the floating-rate sector moved in the same direction. You have to remember that correlation describes past events and can change over time. However, it’s a useful tool to look at how closely related investment types are.

I want to make three points with this chart:

  • Floating-rate loans are closely connected to high-yield bonds. The debt itself is similar in nature: credit ratings of the companies issuing high-yield notes or borrowing at floating rates are close; both are risky (although floating-rate debt is less so, and recoveries in case of a default are higher).Floating-rate funds as an investment class are not as good a diversifier for a high-yield portfolio. They can, on the other hand, provide protection against rising interest rates. When they go up, the price of floating-rate instruments remains the same, while traditional debt instruments lose value to make up for the increase in yield.
  • Notice that the correlation to the stock market is +0.44. If history is a guide, a falling market will have less effect on our floating-rate investment fund.
  • The chart shows that floating-rate funds serve as an excellent diversifier for a portfolio that’s reasonably mixed and represents the overall US aggregate bond market. The correlation is close to zero: -0.03. This means that movements of the overall US bond market do not coincide with the movements of the floating-rate universe.Imagine two people walking down a street, when one (the overall debt market) turns left, the other (floating-rate funds) would stop, grab a quick pizza, get a message from his friend, catch a cab, and drive away. No relationship at all… at least, not in the observed time period. This is the diversification we’re looking for.

Floating-rate funds provide a terrific diversification opportunity for our portfolio. This gives us safety, and that is the key takeaway.

Our Bulletproof income portfolio offers a number of options for diversification above and beyond what’s mentioned here. You can learn all about our Bulletproof Income – and the other reasons it’s such an important one for seniors and savers – here.


The article Not All Debt Is Created Equal was originally published at millersmoney.com.

Turkey holds repo rate but trims late liquidity rate 150 bps

By CentralBankNews.info
    Turkey’s central bank maintained its benchmark one-week repo rate at 10.0 percent but cut the lending rate at its late liquidity window by 150 basis points to 13.5 percent, saying the “recent decline in uncertainties and partial improvement in the risk premium indicators have reduced the need for an additional tightening in liquidity policy.”
    The Central Bank of the Republic of Turkey (CBRT), which raised its repo rate by a sharp 550 basis points on Jan. 28 in response to a sharp fall in the lira currency, said its “strong and front loaded monetary tightening” had helped contain the adverse impact on inflation expectations.
    “Inflation expectations and pricing behavior will be closely monitored and the tight monetary policy stance will be maintained until there is a significant improvement in the inflation outlook,” the bank said, repeating its guidance from February when rates were held steady.
    In addition to raising the repo rate to its current level of 10.0 percent, the CBRT in January also shifted its overnight interest rate corridor upwards by raising the marginal funding rate, or the ceiling in the corridor, to 12.0 percent from 7.75 percent, and the borrowing rate, or the floor in the corridor to 8.0 percent from 3.5 percent.

    The impact of the January rate rise helped stabilize the lira currency and the central bank said loan growth was continuing to slow in response to its tight policy and there are signs of a deceleration of private domestic demand in the first quarter of 2014.
    Based on a recovery in foreign demand, the CBRT expects exports to support economic growth and disinflation and “lead to a significant improvement in the current account deficit in 2014.”
    Turkey was among the emerging market countries that were most heavily hit last year when financial markets started to prepare for the shift in monetary policy by the U.S. Federal Reserve, which started to reduce its asset purchases in January.
    The Fed’s injection of liquidity into global markets since the global financial crises led to large capital inflows into many emerging market countries but this flow started to reverse last year due to the prospect of stronger economic growth in advanced economies.
    Turkey’s current account deficit and external debt rose in recent years but the current account deficit narrowed in January and February, hitting US$3.191 billion, down from $4.930 in January and $8.322 in December 2013.
    Turkey’s inflation rate accelerated further in March to 8.39 percent in March, the fourth consecutive month of rising prices, but on April 17 the central bank’s governor, Erdem Basci, said inflation was expected to peak in May but still remain well above the bank’s 5.0 percent target for 2014.
    Turkey’s economy slowed in 2012 and 2013 after strong growth of 8.5 percent in 2011 and Basci last week also maintained his forecast for 4.0 percent growth this year, the same as in 2013 and up from 2.1 percent in 2012.
    The International Monetary Fund (IMF) has cut its 2014 growth forecast to 2.3 percent from a previous forecast of 3.5 percent, citing lower public consumption, and forecast inflation at 7.8 percent by the end of the year. The current account deficit is forecast to narrow to 6.3 percent.
    Turkey’s Gross Domestic Product expanded by 0.5 percent in the fourth quarter from the third quarter for annual growth of 4.4 percent, slightly up from 4.3 percent in the third quarter.
    The central bank has been under pressure recently to cut rates to help stimulate economic growth. On April 4 Turkish Prime Minister Tayyip Erdogan, days after strong showing in local elections, called on Basci to convene an emergency meeting of the bank’s monitor policy committee and cut rates.
    Basci responded a few days later by saying measured rate cuts were possible, but there was no reason for an emergency meeting and the bank alone would decide on the timing of the rate cuts. The central bank’s rate rise in January had come shortly after Erdogan spoke out against higher rates.
    The rate rise in January was in response to a fall in the Turkish lira to a record low of 2.39 to the U.S. dollar on Jan. 27. Since then it has strengthened, helped by a more favorable view of emerging markets by global investors.
    Today the lira rose in response to the central bank’s decision to maintain rates, hitting 2.13 to the dollar from 2.15 yesterday, the same rate as at the end of 2013.

    http://ift.tt/1iP0FNb

EUR/AUD Has Plenty More Upside Potential

Technical Sentiment: Bullish

Key Takeaways
• EUR/AUD broke a triangle formation to the upside;
• Price closed above the 200-Day Moving average;
• EUR/AUD bullish towards 1.4490 / 1.5100.
After a prolonged downtrend, the Euro appears ready to recover more ground against the Australian Dollar. The pair finally managed to break the downtrend configuration by establishing a Higher Low (1.4715) and a Higher High (1.4928).

Technical Analysis

Half-way through the European session, EUR/AUD is trading around the 1.4900 handle. The triangle breakout, due to its size, led to the formation of a Bullish Engulfing Bar on the Daily timeframe. This price action pattern has not been confirmed yet, as price never broke above Wednesday’s high at 1.4928.

Since the pair has not reached any major resistance levels, a continuation towards the upside is likely in the coming sessions. Before moving higher, EUR/AUD can still correct from the current levels in order to test the support areas and form a fresh Higher Low.

Support begins at 1.4837, marked by the 200-Day Moving Average and the previous resistance area. A second support area is located around the 1.4790, where the 50 and 100 Simple Moving Averages from the 4H timeframe meet the old triangle resistance. The third support is at 1.4715 – if price breaks below this level all bullish scenarios will be invalidated.

Towards the upside, for a bullish continuation above 1.4928, EUR/AUD has immediate targets at 1.4955 and more importantly at 1.4490. The latter represents a strong resistance confluence between:
– the 4H 200 Simple Moving Average;
– the 38.2% Fibonacci Retracement between 1.5536 down to 1.4653;
– February 2013 Low.
The third resistance, just as valid, is the Fibonacci confluence around 1.5100, where the 50-Day Moving Average is also located.


*********
Prepared by Alexandru Z., Chief Currency Strategist at Capital Trust Markets


Silver Slips Again; Tests 2014’s Low

Technical Sentiment: Bearish

Key Takeaways
• After consolidating for a week, Silver tripped stop losses below $19.22;
• 2014’s low of $18.98, was reached and the market respected it;
• Silver in serious trouble below $18.90;
• Upside potential based on year old triangle formation.

As investors flee the safe haven provided by precious metals, gold and silver continue to take hit after hit. Silver went on another selling frenzy during the European session, only to hit 2014’s Low of $18.98 before rising back above the $19.00 handle. Silver is at an interesting cross-road now, with more losses expected if the current low fails; with some chances for bullish potential due to a year old triangle formation.

Technical Analysis

The Silver Daily chart shows a large triangle formation. The support trendline is based on 28th June 2013 Low and 31st December 2013 Low, while the resistance trendline dates back to 28th August.

Silver almost touched the support of the triangle formation at $18.91. Hence, we could state this is a crucial location for the commodity. A break and close below the support $18.91 could spell trouble as it opens the way towards $18.20. If the multi-year downtrend from 2011 also comes into play, it will be very hard for Silver to resuscitate and end the year on a positive note.

The only intermediary support level between $18.91 and $18.20 is December’s Low of $18.64. If price drops accelerate heavily below $19.00, these support levels are not likely to present any bottom-catching opportunities.

For any upside potential to be viable, the Daily bars should close above $18.91. There is still a long way up until price can beat the most notable recent swing high, priced at $19.54. Only a higher high would change short-medium term outlook to bullish.

*********
Prepared by Alexandru Z., Chief Currency Strategist at Capital Trust Markets


Stock Market Review 24 April

By HY Markets Forex Blog

Europe

European markets saw gains on Thursday, as stocks in the region bounced back from yesterday’s losses. Meanwhile, traders are focusing on earning deliveries from some major companies in the region.

The Euro Stoxx 50 climbed 0.59% higher to 3,194.56, while the German DAX rose 0.54% to 9,596.06 at the time of writing. At the same time, the French CAC 40 edged 0.56% higher to 4,475.90, while the UK benchmark FTSE 100 gained 0.35% to 6,697.82.

The release of the Purchasing Managers’ Index (PMI) data for Germany, France and the eurozone sent shares in Europe lower on Wednesday.

The Ifo business climate indicator for Germany is expected to be released later in the day with analysts expecting to see a drop from the previous reading of 110.7 to 110.4 in April.

Stocks – Asia

In Asia, stocks were seen mixed on Tuesday after a sharp drop was seen in US home sales and investors weighed upbeat earnings from Apple and Facebook.

The Japanese benchmark Nikkei 225 index edged 0.97% lower at 14,404.99 points at the time of writing, at the same time Tokyo’s broader Topix index dropped 0.76% to 1,164.90 points.

The carmaker giants, Toyota Motor Corp, shed 1.4%, while Toshiba Corp slid 4% and Kansai Electric Power sank 4.2% in Tokyo.

In China, the Hong Kong Hang Seng index rose 0.21%, trading at 22,558.59 points at the time of writing, while the mainland benchmark Shanghai Composite edged 0.50% lower to 2,057.03 points at the mark close.

Telecom provider, China Unicorn gained 3.6%, while China Resources Land added 3%. Meanwhile, the energy company, Power Assets Holdings fell 2.8%. Korea’s benchmark Kospi index lost 0.10% to 1,998.34 points. According to the Bank of Korea, Korea’s gross domestic product edged 0.9% higher in the first quarter; while on an annual basis, the country climbed 2.9% in the quarter.

Stocks – Australia

In Sydney, the benchmark S&P/ASX 200 index rose 0.10% higher at 5,523.40 at the closing bell. Among the top gainers were Alacer Gold Corp climbed 5.8%, while the Resolute Mining rose 3.2%, in contrast; the Bank of Queenland lost 2.98%.

Meanwhile, New Zealand benchmark NZX 50 index rose 0.21% to 5,153 points. The Reserve Bank of New Zealand increased its policy rate 25 basis points to 3% on Thursday.


Visit www.hymarkets.com   to find out more about our products and start trading today with only $50 using the latest trading technology today

The post Stock Market Review 24 April appeared first on | HY Markets Official blog.

Article provided by HY Markets Forex Blog

Crude Prices Near Two-Week Low as Stockpiles Climbs

By HY Markets Forex Blog

Crude prices were seen trading lower on Thursday, as prices fell near its lowest level in two week, while crude inventories in the US rose to the highest in 83 years. Meanwhile the escalated tension in Ukraine continues to remain in spotlight.

The North American West Texas Intermediate crude for June delivery edged 0.24% higher to $101.70 per barrel on the New York Mercantile Exchange at the time of writing, near the lowest level in two weeks.

While Futures for the European benchmark Brent crude for June settlement rose 0.18% to $109.31 a barrel on the ICE Futures Europe exchange at the time of writing.

US Crude stockpiles

Oil stockpiles in the US climbed 3.52 million barrels, compared to analysts forecast of 2.27 million barrels, according to data from the Energy Information Administration (EIA). US crude stockpiles climbed to the highest since May 1931, according to government data dated back to 1920.

Stockpiles at Cushing, Oklahoma, fell by 788,000 barrels to 26 million, the EIA said. Supplies at the storage hub dropped since when the southern port of the Keystone XL pipeline started moving oil to the Gulf of Mexico.

Meanwhile reports from the American Petroleum Institute released on Tuesday showed that US crude oil inventories climbed by 519,000 barrels in the week ending April 18, below estimates of a rise of 2.3 million barrels.

Russia

On Tuesday, the Russian Prime Minister Medvedev said that Russia should prepare for self-reliance, as the country faces warnings of additional sanctions from the Western nations.


Visit www.hymarkets.com   to find out more about our products and start trading today with only $50 using the latest trading technology today

The post Crude Prices Near Two-Week Low as Stockpiles Climbs appeared first on | HY Markets Official blog.

Article provided by HY Markets Forex Blog

Forex Technical Analysis 24.04.2014 (EUR/USD, GBP/USD, USD/CHF, USD/JPY, AUD/USD, GOLD)

Article By RoboForex.com

Analysis for April 24th, 2014

EUR USD, “Euro vs US Dollar”

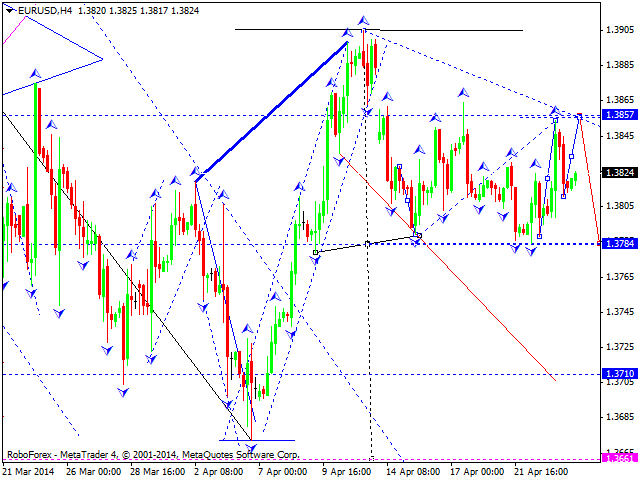
Euro is trying to return to level of 1.3857. After reaching it, price may start forming another descending structure with predicted target at level of 1.3750. During this descending movement, pair is expected to form continuation pattern, which may help us to specify the target.

GBP USD, “Great Britain Pound vs US Dollar”

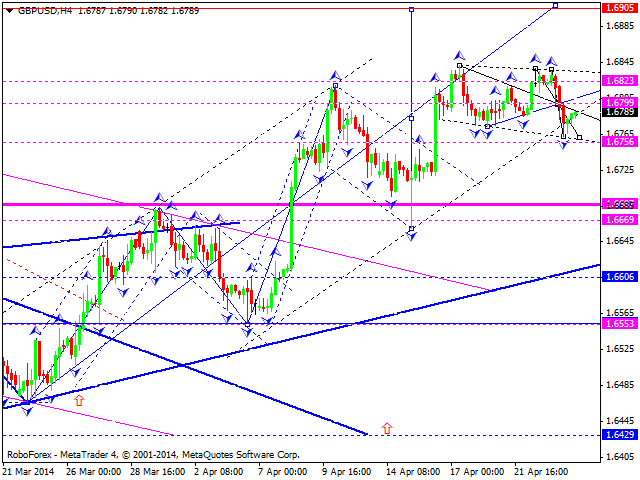
Pound is moving downwards to reach level of 1.6756. Later, in our opinion, instrument may start new ascending movement towards level of 1.6905 and then start more serious correction.

USD CHF, “US Dollar vs Swiss Franc”

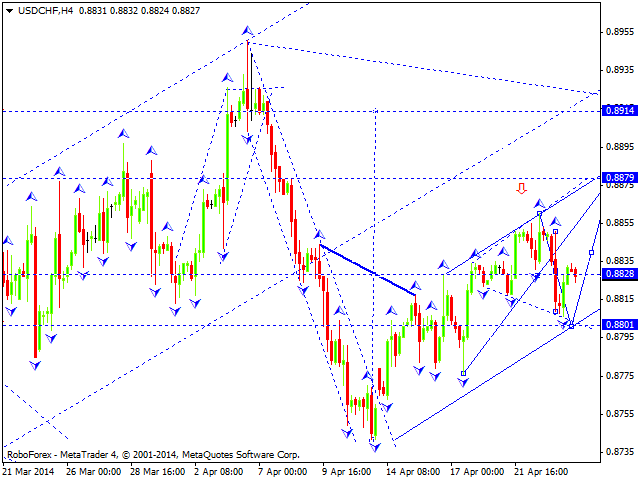
Franc is falling down towards level of 0.8800. After reaching it, price may grow up to reach level of 0.8880 and then return to level of 0.8830.

USD JPY, “US Dollar vs Japanese Yen”

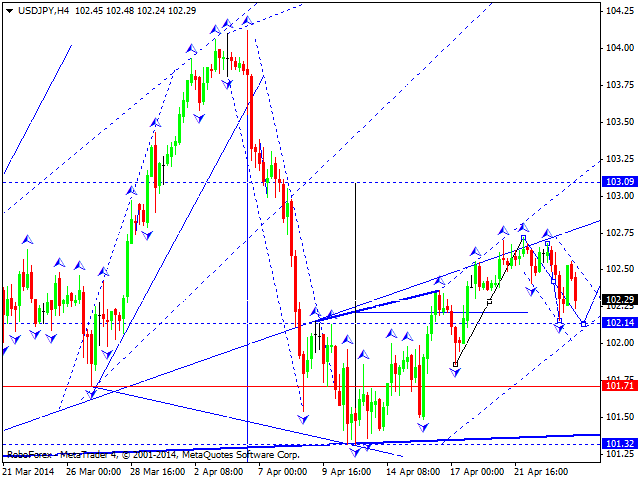
Yen is forming descending structure with target at level of 102.15. Later, in our opinion, instrument may move upwards to reach level of 103.10and then continue falling down towards level of 100.00.

AUD USD, “Australian Dollar vs US Dollar”

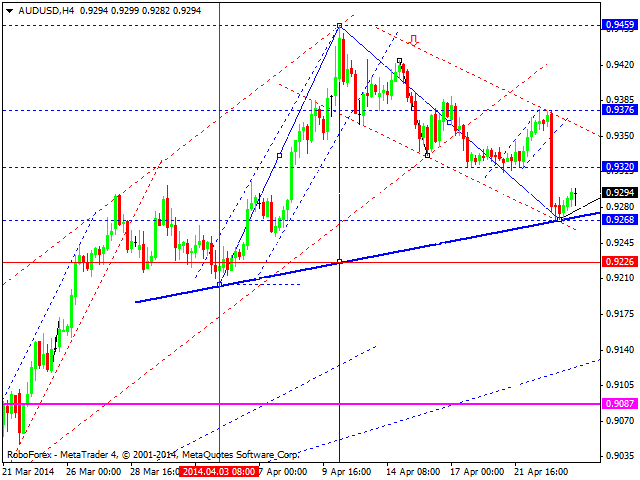
Australian Dollar is forming ascending structure to return to level of 0.9375; market is expected to form five-wave bearish flag pattern. Later, in our opinion, instrument may continue moving inside descending trend towards level of 0.8400.

USD RUB, “US Dollar vs Russian Ruble”

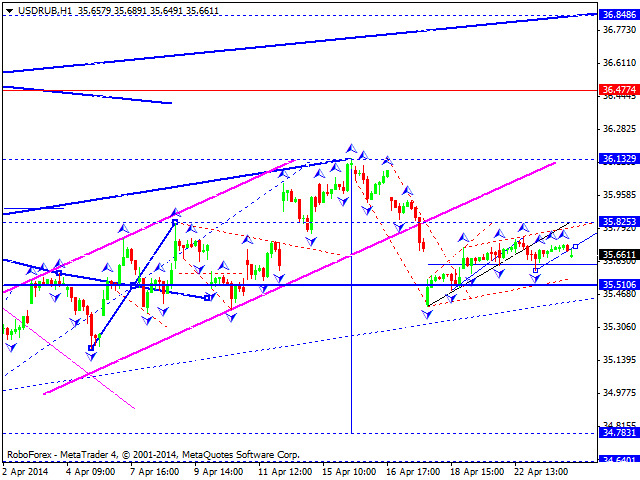
Ruble continues moving upwards to reach level of 35.82. Later, in our opinion, instrument may form another descending structure towards level of 34.78 and then continue growing up to reach level of 36.60.

XAU USD, “Gold vs US Dollar”

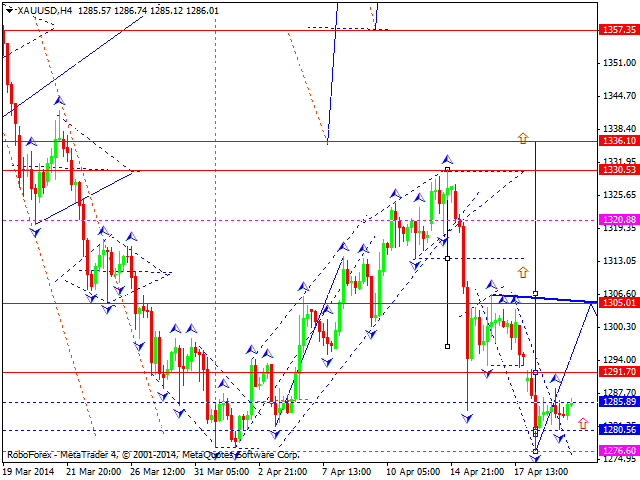
Gold completed the first ascending impulse and corrected it. We think, today price may grow up to reach level of 1300 and then continue forming this ascending wave with target at level of 1357.

RoboForex Analytical Department

Article By RoboForex.com

Attention!
Forecasts presented in this section only reflect the author’s private opinion and should not be considered as guidance for trading. RoboForex LP bears no responsibility for trading results based on trading recommendations described in these analytical reviews.


Japanese Candlesticks Analysis 24.04.2014 (EUR/USD, USD/JPY)

Article By RoboForex.com

Analysis for April 24th, 2014

EUR USD, “Euro vs US Dollar”

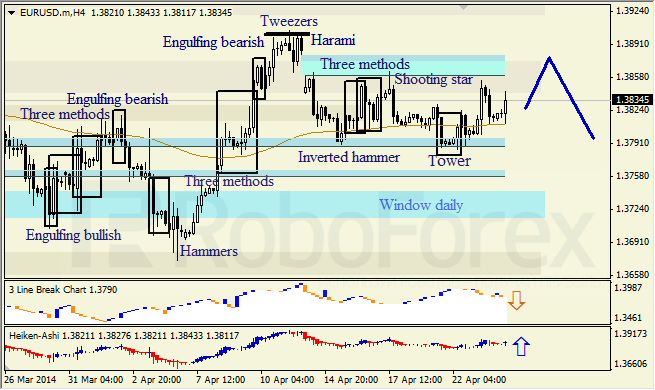
H4 chart of EUR USD shows ascending movement, which is indicated by Tower pattern near middle Window, which is support level. Three Line Break chart indicates correction; Heiken Ashi candlesticks confirm ascending movement towards open Window.

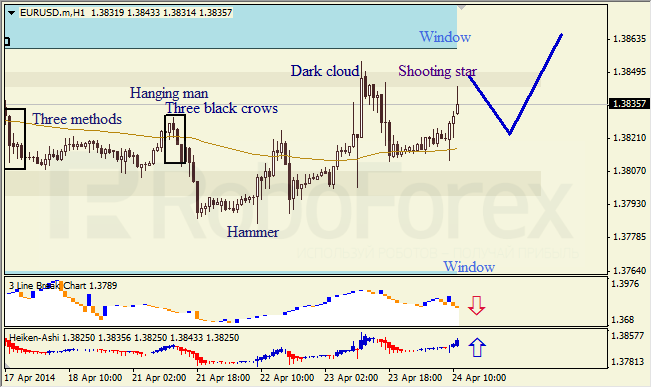
H1 chart of EUR USD shows sideways correction between two Windows. Shooting Star pattern and Three Line Break chart confirm bearish pullback; Heiken Ashi candlesticks indicate bullish movement.

USD JPY, “US Dollar vs Japanese Yen”

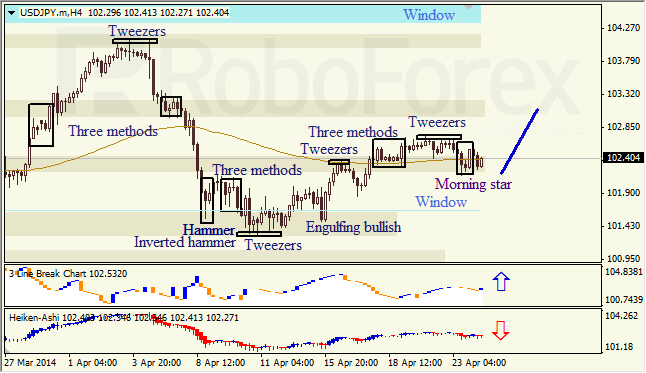
H4 chart of USD JPY shows ascending movement, which is indicated by Morning Star pattern and Three Line Break chart. Heiken Ashi candlesticks indicate possibility of sideways correction.

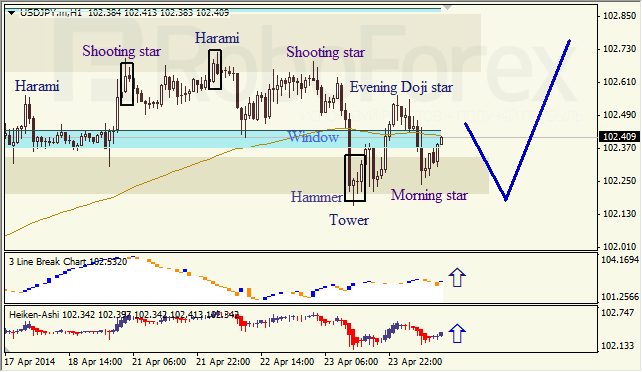
H1 chart of USD JPY shows sideways correction within ascending trend. Closest Window is resistance level. Hammer, Tower, and Morning Star patterns, along with Three Line Break chart and Heiken Ashi candlesticks confirm ascending movement.

RoboForex Analytical Department

Article By RoboForex.com

Attention!
Forecasts presented in this section only reflect the author’s private opinion and should not be considered as guidance for trading. RoboForex LP bears no responsibility for trading results based on trading recommendations described in these analytical reviews.


Gold Prices Decline on Strengthening US Economy

By HY Markets Forex Blog

An improving U.S. economy is not a good thing for gold prices, as it usually generates more confidence in the stock market. As a result, there is less demand for the safe haven gold offers as an investment, which drives down prices.

Investors who trade gold should be paying close attention to U.S. economic indicators, such as the housing market. This indicator showed signs of strength in better than expected home sales in March and price increases. Coupled with the fact that stocks posted gains, gold prices recently dropped to the lowest level in more than two months.

Upcoming economic releases that could impact gold prices include durable goods orders and jobless claims. According to Reuters, traders said these reports will set the tone for gold moving forward.

“If those numbers come out better than expected or show continued improvement in the U.S. economy, you should start looking at the $1,250 area as the next support level for gold,” Thomas Capalbo, precious metals trader at brokerage Newedge, told the news source.

One factor that could prevent gold from falling too much is new home sales, which fell to an eight-month low, according to the U.S. Department of Housing and Urban Development. The 14.5 percent decrease from March was much lower than the 2.3 percent improvement predicted, according to Bloomberg.

If durable goods and jobless claims come in lower than expected as well, investors may not have to flee gold out of fear of significant declines.

The post Gold Prices Decline on Strengthening US Economy appeared first on | HY Markets Official blog.

Article provided by HY Markets Forex Blog

The Australian Tech Company that Gives You Two Ways to Make Money

By MoneyMorning.com.au

Across most of the world overnight it was a pretty meek and meagre day on the markets. The S&P 500 snapped a six day run of gains to finish slightly in the red.

It’s earnings time in the US, so it was bound to end at some stage.

Apple and Facebook actually had decent earnings and improved, but it still wasn’t enough for either to finish up for the day. Overall it led to a pretty poor day which flowed on around Europe also.

Back home on domestic soil things are warming up for the Federal Budget, which is now just a few weeks away. And although the outlook for the Australian economy remains wobbly, the Aussie market hit a post GFC high yesterday, with the benchmark S&P/ASX 200 Index up 0.7%.

One of the interesting topics of conversation in the last few weeks has been on wages and standards of living.

Graham Burke, co–executive chairman of Village Roadshow, made an interesting comment this week about it all.

He said the increase in movie ticket prices is a reflection of increasing Australian wages. So now we know why you need to re–mortgage the house to see the new Spiderman movie.

And in early April, BHP made an interesting comment about its workforce. They said some of its coal–mining workers get paid 50% more than the equivalent employees in the US.

Dalla Vale, BHP Billiton Coal President specifically said,

‘Using our systems, I can identify that it costs our business approximately 1.5 times more for a truck operator in the Bowen Basin compared to the same truck in New Mexico in the USA.’

He continued to say,

‘This highlights the productivity and cost challenge we have in Australia. We must always remember that the world sets our prices and Australia sets our costs.’

However, this week CBA Chief Economist Michael Blythe said,

Wages are running behind CPI inflation with real wages falling,’

He also remarked that a lack of job security was leading to a fall in wages growth.

Effectively prices in Australia’s economy are outpacing wages. In other words, Australia is continuing to be an expensive place to live. And it’s been excessive wage increases over the last decade that’s driven it, and is now coming back to bite us.

With these factors in play, the standard of living has begun to fall, as you will see below.

Another way to look at the unaffordability of Australia is to look at the change in average house prices versus average wages.

In 1967 the average annual income was $2,964 and the median house price in Melbourne was $9,400. A ratio of 3.2 to 1.

In 2010 the average income was $51,610, and the average house price in Melbourne? $555,000.

That’s a ratio of 10.8 to 1.

So although both Mr Burke and Mr Vale are correct, the real fact of the matter is Australia is simply becoming unaffordable.

Wages are too high for too little productivity and the whole country is starting to feel the pinch. The result is a falling standard of living as people simply can’t afford things anymore.

Now I’m not going to go into the complexity of the economics behind it all and potential paths to domestic economic freedom.

I’m going to tell you what you can do to make more money. And despite this current state of affairs in the world there’s surprisingly a lot of work around, if you’ve got the motivation to go and get it.


Work for yourself; it’s far easier than you think

Of course there’s also potentially a great investment opportunity as well as a way to add some extra funds in your pocket to afford to live in Australia.

Freelancer.com is, ‘the world’s largest freelancing, outsourcing and crowdsourcing marketplace by number of users and projects.

And when they say the world’s largest, they’re not kidding. Freelancer records over 10.9 million verified users. There have also been in excess of 5.8 million projects posted to the site in the last 13 years.

Matt Barrie is the man who founded and runs Freelancer. He also took the company onto the ASX last year. Freelancer currently has a market cap of about $523 million.

And if the growth in the business is anything to go by, that’s only going to get larger. Barrie has been in London to launch freelancer’s European HQ. In a Forbes interview he said, ‘Today, all the white collar jobs are done on computers, so anyone, anywhere, can do a job for you.

He went on to say, ‘We’re the eBay for jobs.

And therein lies a great point. Freelancer is a pure marketplace, where anyone can register and bid for work. You can make as little as a few dollars a job up to a few thousand a job.

All it depends on is your skill, pricing and value for money. In other words it’s the perfect free market system.

It’s globalising white–collar jobs and bringing competition to the jobs marketplace. Not artificial competition, but global competition.

Here’s a good example of what I mean.

Under the Category ‘Legal Research’ on the Freelancer website someone has posted a job titled ‘privacy policy’.

The brief is, ‘I want a writer who can write a privacy policy and terms of use for my website’. The project budget is $30—$250 Canadian Dollars.

There have been 18 bids for the project with an average bid of CA$149.

Now the skills required for this are specific legal skills. And that’s one of the prerequisites to secure the job. 18 people bidding for a job might sound like a lot, but if you’re skilled enough, have a good enough reputation and are good value for money, you’re a good shot of getting the job, and what would seem to be a good bit of cash for a not excessive amount of work.

The beauty is there are low bids, and there are high bids. But the person who’s posted the project will get to make the ultimate decision of if they want something cheap or something of higher quality.

And the thing is most people are willing to pay a premium for expertise and a higher standard of work.

The other thing to protect job posters is they only pay once the work is satisfied. And because freelancers get ratings after each job, it’s in their interest to do good work. The reputation freelancers build from successful jobs is the essence of how Freelancer.com works so well in today’s times.

Freelancer makes money from a US$3 or 3% fee of the project (whichever is greater) for people on free memberships. And for people who pay a monthly subscription…well it’s obvious how Freelancer make their money there.

Reputation is everything in the 21st century economy

Freelancer is a great example of a technology driven network based on a system of reputation and an online social community.

This is something we’ve talked about for some time now. These reputation networks like Freelancer, AirBnb, Uber and eBay will drive the new online economy of the 21st century.

We went into detail on this point with John Robb at our World War D conference in a special one–on–one interview. John even went so far as to say reputation will be worth more than gold!

And as this trend of reputation networks continues, it’s companies like Freelancer that’ll be at the forefront of it.

So that gives you a couple of options.

You can get onto Freelancer.com, register and start browsing and bidding for jobs. This could mean potentially a few extra grand in your pocket over the space of a year. And it doesn’t necessarily have to impact your daily grind. It just depends on how much you want to work. And typically you can do it from the luxury of your home.

The other option is to consider Freelancer as an investment. They trade way over normal P/E ratios. And their valuation goes against pretty much every conventional financial principle. But to me, they’re one of the most interesting tech companies listed on the ASX.

Freelancer is a great company. Not too many companies out there genuinely provide two ways to make money from them. It just depends on which approach you might take.

Hopefully one way or another it pays off. And Freelancer can help make living in the 5th (Sydney) and 6th (Melbourne) most expensive cities in the world that little bit easier.

Regards,
Sam Volkering
Editor, Tech Insider

From the Port Phillip Publishing Library

Special Report: Mining Boom Act II 

Join Money Morning on Google+


By MoneyMorning.com.au