Value Investing and Money in the Australian Economy

By MoneyMorning.com.au

It’s one thing to be connected.

And it’s another thing to understand the philosophical meaning of money.

But it’s something completely different to put that into practical advice.

That’s where our colleague Greg Canavan enters the picture.

Greg knows more than just about anyone we know when it comes to the theory of money. But that’s not where Greg’s skills end. He’s also an accomplished value investor.

When you think about it, being a money theorist and a value investor are a natural combination — like gin and tonic or fish and chips.

In order to get a true understanding of a company’s worth it pays to understand the worth of the currency you’re using to value the company.

We doubt if there are more than a handful of value investors in the world who think just as much about the value of money as they do about the value of the stocks they analyse.

But if you’re a genuine value investor, it’s vitally important to think about the value of the currency.

Think about it, a company can grow its revenue and profits as much as it likes, but if the value of the currency declines at a faster rate than the company’s profit growth then it won’t count for much.

Are Australian stocks ‘fundamentally’ overvalued?

In the latest issue of Sound Money, Sound Investments Greg Canavan takes an in-depth look at the Australian dollar.

And to be frank, he isn’t doing somersaults at what he sees.

Put simply, Greg says that the Australian stock market and currency are heading towards what you could call ‘peak stimulus’. At the moment the market believes the Australian economy has successfully transitioned from a commodities economy to a real estate economy.

But according to Greg you can expect to see that optimism wane over the coming months. That’s especially likely in the Aussie housing market, which should weaken through the rest of this year.

Remember, rising house prices need credit to grow. That typically means interest rates have to stay low and perhaps go even lower. Greg doesn’t see that as likely.

The only other way Australian house prices can grow is if economic productivity improves. But as Greg says, ‘Australia’s productivity performance in recent years has been terrible.

It’s for that reason that he sees stocks as ‘fundamentally overvalued at this point.

In fact, Greg says that the stock valuation system he uses ‘suggests the ASX remains between 25% (best case) and 44% overvalued!

It’s a sobering thought if you’re thinking about buying stocks. So why are we telling you this? After all, by now you know that your editor has a bullish view on the market that’s almost directly opposed to Greg’s view.

What is your advisor hiding from you?

The reason for giving you both sides of the story is simple.

It’s up to you as a self-directed investor to take both views into account before making up your mind on what you should do next.

This is something that you’ll never get from most financial advisors or from the mainstream press. With most financial advisors you just get the ‘house’ view. That is, the company’s chief economist will set the market viewpoint and all the advisors must adhere to that view — even if they don’t agree with it.

That’s not the way we work. We don’t have a house view. We have a team of independent analysts who form their own views based on their research.

The analysts then present these views and the investments ideas to you. It’s up to you to decide which of the views have the most compelling argument. Once you’ve figured that out then you can invest accordingly.

And whatever you do the final decision will be yours. You’ll know that you’ve taken into account all the issues before you make up your mind. That puts you in a different league compared to most mainstream investors.

For the most part mainstream investors only ever see one point of view — the ‘house’ view. When things go wrong they wonder why they’d never heard about the big economic problems before. Mostly it’s because their advisor didn’t know about it or because the advisor kept it from them.

So when a key and potentially unexpected event happens, those investors are mostly completely unaware, unprepared…and their finances suffer accordingly.

That’s something we don’t want happening to you.

Our view and analysis is that Aussie stocks are heading into another huge bull market. But what if we’re wrong? By introducing you to well-thought out and varied views we can help reduce the chances that a key economic event will catch you unawares. Greg certainly makes an interesting case.

Cheers,
Kris+

From the Port Phillip Publishing Library

Special Report: Secure and Protect Family Wealth for Generations

Join Money Morning on Google+


By MoneyMorning.com.au

Rickards: Was This the ‘Most Blatant Case of Insider Trading’?

By MoneyMorning.com.au

At the recent World War D conference some of the speakers addressed one key element of the subtitle — Money, War and Survival in the Digital Age.

That is they spoke about the meaning of money and where the whole monetary system is right now.

One of those speakers was Jim Rickards.

He’s probably one of the most ‘connected’ financial gurus on the planet. And his just-released book highlights the level of those connections.

After all, who do you know who received an invitation from the US Central Intelligence Agency (CIA) to look into financial irregularities that may have taken place before the 9/11 terrorist attacks?

Jim Rickards was one man who got an invitation.

His latest book, The Death of Money, gives an insight into one of the meetings at the CIA’s Langley, Virginia headquarters:

On September 26, 2003, John Mulheren and I were seated side by side in a fourth-floor [meeting room] in the headquarters complex. Mulheren was one of the most legendary stock traders in Wall Street history. I was responsible for modeling terrorist trading for the CIA, part of a broad inquiry into stock trading on advance knowledge of the 9/11 attacks.

I looked in his eyes and asked if he believed there was insider trading in American Airlines stock immediately prior to 9/11. His answer was chilling: “It was the most blatant case of insider trading I’ve ever seen.”

Rickards explains in his book exactly how ‘inside’ traders (those within the terrorist network with intimate knowledge of the impending attacks) made millions.

You can find out how to get a copy of Jim Rickards’ book mailed to you here. It’s a fascinating read from a genuine establishment insider.

Cheers,
Kris+

From the Port Phillip Publishing Library

Special Report: Secure and Protect Family Wealth for Generations

Join Money Morning on Google+


By MoneyMorning.com.au

Currency Speculators increased bets against US Dollar last week for 3rd week

By CountingPips.com

Cot-Values

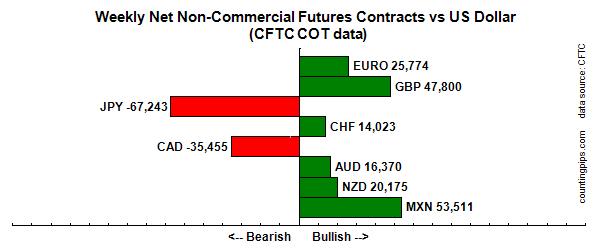
The latest data for the weekly Commitments of Traders (COT) report, released by the Commodity Futures Trading Commission (CFTC) on Friday, showed that large traders and speculators continued to decrease their bets in the US dollar last week as overall US dollar positions fell to their lowest level since October.

Non-commercial large futures traders, including hedge funds and large International Monetary Market speculators, had an overall US dollar short position totaling -$1.58 billion as of Tuesday April 22nd, according to the latest data from the CFTC and calculations by Reuters. This was a weekly change of -$0.41 billion from the -$1.17 billion total short position that was registered on April 15th, according to Reuters that totals the US dollar contracts against the combined contracts of the euro, British pound, Japanese yen, Australian dollar, Canadian dollar and the Swiss franc.

Last week’s data marks the highest short position in the US dollar since October 29th 2013 when bearish positions equaled -$3.14 billion.

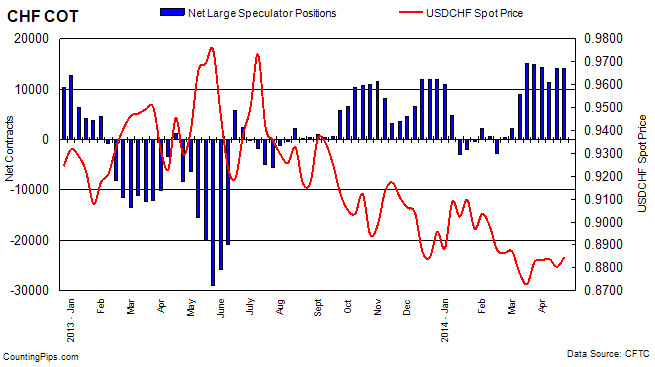
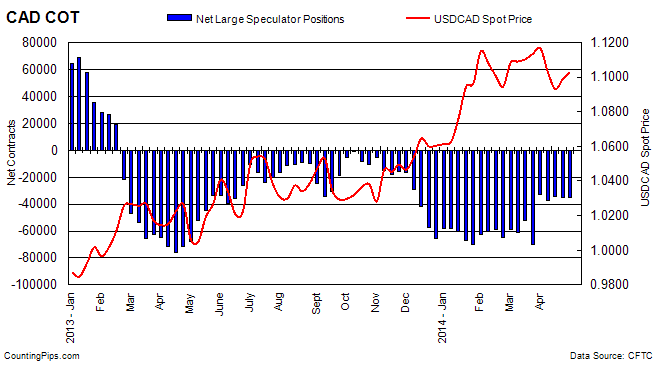
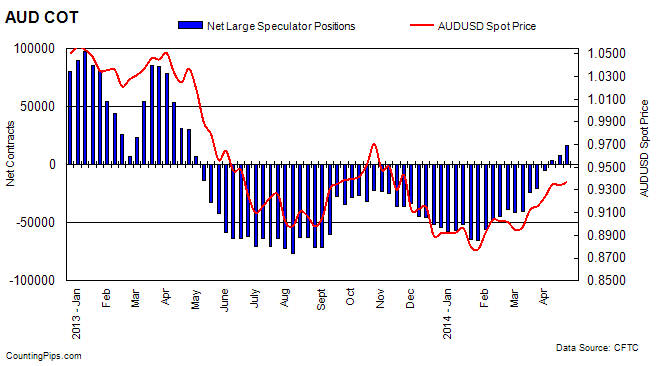
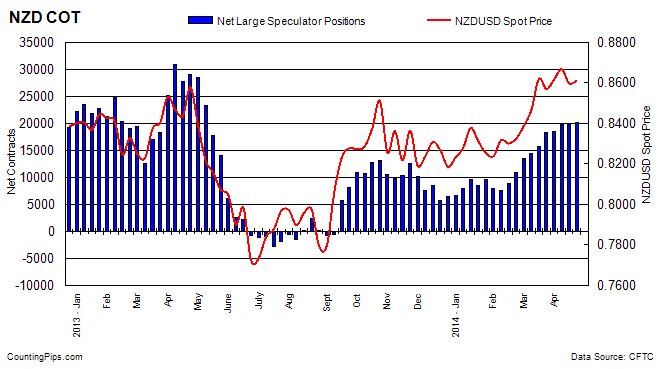
For the week, speculators increased their bets in favor of the Japanese yen, Australian dollar and the New Zealand dollar while there was weekly declines for the euro, British pound sterling, Swiss franc, Canadian dollar and the Mexican peso.

Cot-Standing

Notable changes:

  • Euro positions have fallen four out of the last five weeks to the lowest level since March 4th
  • British pound sterling positions fell slightly after five straight weeks of gains
  • Japanese yen positions rose for the third straight week
  • Swiss franc (-43), Canadian dollar (-29), New Zealand dollar (+328) and Mexican Peso (-726) positions saw little change for the week
  • Australian dollar net positions rose the most in the week (+8,273) as the Aussie had its third straight bullish position and highest bullish standing since April 2013


* All currency positions are in direct relation to the US dollar where, for example, a bet for the euro is a bet that the euro will rise versus the dollar while a bet against the euro will be a bet that the dollar will gain versus the euro. Please see charts and data below.


Weekly Charts: Large Speculators Weekly Positions vs Currency Spot Price

EuroFX:

EURFX

Last Six Weeks data for EuroFX futures

DateOpen InterestLong SpecsShort SpecsLarge Specs NetWeekly Change
03/18/2014264443117819648285299116606
03/25/20142621791069146728039634-13357
04/01/20142600751018496861133238-6396
04/08/2014261439926356933523300-9938
04/15/201427072210625278564276884388
04/22/20142662591012047543025774-1914


British Pound Sterling:

gbp

Last Six Weeks data for Pound Sterling futures

DateOpen InterestLong SpecsShort SpecsLarge Specs NetWeekly Change
03/18/20142089616414138605255363537
03/25/20142021156675137027297244188
04/01/20142114377596942397335723848
04/08/201422666791642451654647712905
04/15/20142266888747236874505984121
04/22/2014237055896924189247800-2798


Japanese Yen:

JPY

Last Six Weeks data for Yen Futures

DateOpen InterestLong SpecsShort SpecsLarge Specs NetWeekly Change
03/18/20141569222414485243-6109938257
03/25/20141582801760086487-68887-7788
04/01/201418846422162110800-88638-19751
04/08/201418181413340100802-874621176
04/15/20141648431435183067-6871618746
04/22/20141656741656483807-672431473


Swiss Franc:

chf

Last Six Weeks data for Franc futures

DateOpen InterestLong SpecsShort SpecsLarge Specs NetWeekly Change
03/18/2014493912531110195151166159
03/25/201447353250371021814819-297
04/01/201447228248001056914231-588
04/08/20144475219275794011335-2896
04/15/201448976239059839140662731
04/22/20144688821732770914023-43


Canadian Dollar:

cad

Last Six Weeks data for Canadian dollar futures

DateOpen InterestLong SpecsShort SpecsLarge Specs NetWeekly Change
03/18/20141867822775197556-69805-17614
03/25/20141332464044173656-3321536590
04/01/20141179662754964543-36994-3779
04/08/20141203362870463011-343072687
04/15/20141195252828863714-35426-1119
04/22/20141187072752962984-35455-29


Australian Dollar:

aud

Last Six Weeks data for Australian dollar futures

DateOpen InterestLong SpecsShort SpecsLarge Specs NetWeekly Change
03/18/2014817372157746040-2446316387
03/25/2014842322438744914-205273936
04/01/2014939993539840278-488015647
04/08/201496887376303432033108190
04/15/201498933404633236680974787
04/22/20141076964954033170163708273


New Zealand Dollar:

nzd

Last Six Weeks data for New Zealand dollar futures

DateOpen InterestLong SpecsShort SpecsLarge Specs NetWeekly Change
03/18/201431463246458894157511302
03/25/201432748262438030182132462
04/01/20143231325765728518480267
04/08/201432898265216755197661286
04/15/2014331002667168241984781
04/22/20143257926056588120175328


Mexican Peso:

mxn

Last Six Weeks data for Mexican Peso futures

DateOpen InterestLong SpecsShort SpecsLarge Specs NetWeekly Change
03/18/20141110571932020590-12706977
03/25/20141158582276924423-1654-384
04/01/201414527049893281092178423438
04/08/201413033170371138705650134717
04/15/2014131412710381680154237-2264
04/22/2014128932683291481853511-726


*COT Report: The weekly commitment of traders report summarizes the total trader positions for open contracts in the futures trading markets. The CFTC categorizes trader positions according to commercial hedgers (traders who use futures contracts for hedging as part of the business), non-commercials (large traders who speculate to realize trading profits) and nonreportable traders (usually small traders/speculators).

The Commitment of Traders report is published every Friday by the Commodity Futures Trading Commission (CFTC) and shows futures positions data that was reported as of the previous Tuesday (3 days behind).

Each currency contract is a quote for that currency directly against the U.S. dollar, a net short amount of contracts means that more speculators are betting that currency to fall against the dollar and a net long position expect that currency to rise versus the dollar.

(The graphs overlay the forex spot closing price of each Tuesday when COT trader positions are reported for each corresponding spot currency pair.)

See more information and explanation on the weekly COT report from the CFTC website.


Article by CountingPips.comForex Apps & News

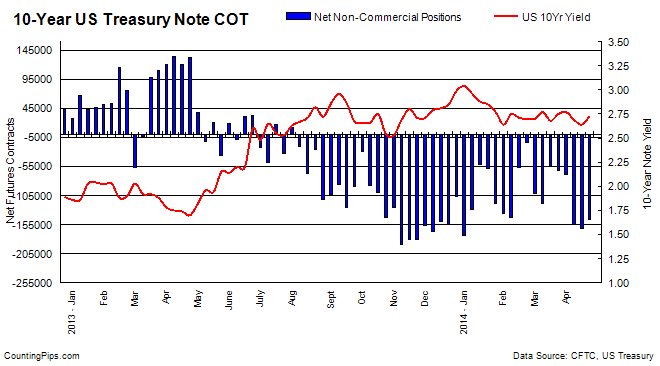
US 10-Year Treasury Note Speculators cut back on bearish positions from 2014 high

By CountingPips.com

Weekly CFTC Net Speculator Report


10-Year

Large Speculators bearish positions decline to a total of -145,865 contracts

10 Year Treasuries: Large futures market traders decreased their overall bearish bets in the 10-year treasury note futures last week after four straight weeks of rising bearish positions, according to the latest Commitment of Traders (COT) data released by the Commodity Futures Trading Commission (CFTC) on Friday.

The non-commercial futures contracts of the 10-year treasury notes, primarily traded by large speculators and hedge funds, totaled a net position of -145,865 contracts in the data reported for April 22nd. This was a change of +16,413 contracts from the previous week’s total of -162,278 net contracts that was recorded on April 15th.

The current level in the 10-year note futures contracts is the lowest bearish level in three weeks after reaching the highest bearish level of 2014 on April 15th.

Over the weekly reporting time-frame, from Tuesday April 15th to Tuesday April 22nd, the yield on the 10-Year treasury note advanced from 2.64 to a yield of 2.73, according to data from the United States Treasury Department.


Last 6 Weeks of Large Trader Non-Commercial Positions

DateOpen InterestLong SpecsShort SpecsNet Large SpecsWeekly Change10 Year Yield
03/18/20142441194360226415240-55014631962.68
03/25/20142490662333722395487-61765-67512.75
04/01/20142503964346901415677-68776-70112.77
04/08/20142572114327159482333-155174-863982.69
04/15/20142497347344056506334-162278-71042.64
04/22/20142493544349474495339-145865164132.73


*COT Report: The weekly commitment of traders report summarizes the total trader positions for open contracts in the futures trading markets. The CFTC categorizes trader positions according to commercial hedgers (traders who use futures contracts for hedging as part of the business), non-commercials (large traders who speculate to realize trading profits) and nonreportable traders (usually small traders/speculators). Find CFTC criteria here: (http://www.cftc.gov/MarketReports/CommitmentsofTraders/ExplanatoryNotes/index.htm).


Article by CountingPips.comForex Trading Apps


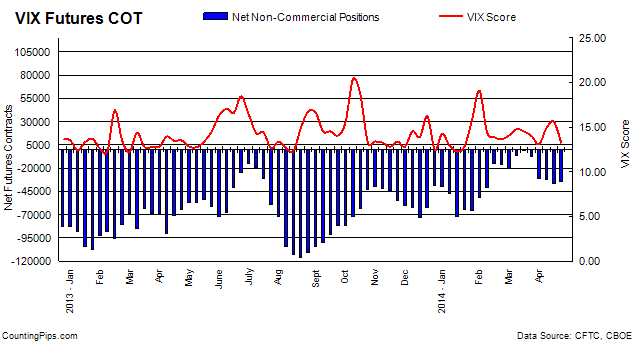
VIX Futures Market Speculators cut down on bearish positions last week

By CountingPips.com

Weekly CFTC Net Speculator Report


vix


VIX Futures Contracts: Large traders and speculators decreased their overall bearish bets in the VIX futures market last week after four consecutive weeks of rising bearish positions, according to the latest data from the Commodity Futures Trading Commission (CFTC) released on Friday.

The VIX non-commercial futures contracts, comprising of large speculator and hedge fund positions, totaled a net bearish position of -34,057 contracts in the data reported for April 22nd. This was a change of +1,889 contracts from the previous week’s total of -35,946 net contracts that was registered on April 15th.

The decline in large bearish positions brings contracts down from the highest bearish level since February 11th when overall positions stood at a level of -41,108 contracts.

The VIX index, meanwhile, declined last week from a 15.61 reading on Tuesday April 15th to a 13.19 reading on Tuesday April 22nd, according to the Chicago Board Options Exchange (CBOE) Volatility Index.


Last 6 Weeks of Large Trader Positions

DateOpen InterestLong SpecsShort SpecsNet Non-CommercialsWeekly ChangeVIX Score
03/18/2014336625107861108924-1063579114.52
03/25/2014335826109110116314-7204-614114.02
04/01/2014357046114839145412-30573-2336913.10
04/08/2014359952105096136842-31746-117314.89
04/15/201436888796296132242-35946-420015.61
04/22/2014362130106598140655-34057188913.19

*COT Report: The weekly commitment of traders report summarizes the total trader positions for open contracts in the futures trading markets. The CFTC categorizes trader positions according to commercial hedgers (traders who use futures contracts for hedging as part of the business), non-commercials (large traders who speculate to realize trading profits) and nonreportable traders (usually small traders/speculators). Find CFTC criteria here: (http://www.cftc.gov/MarketReports/CommitmentsofTraders/ExplanatoryNotes/index.htm).


Article by CountingPips.comForex Apps & Analysis


Gold Speculators added slightly to bullish positions after 4 weeks of decline

By CountingPips.com

Weekly CFTC Net Speculator Report

Gold

GOLD: Large futures market traders and speculators slightly added to their overall bullish bets in gold futures last week after decreasing positions for four straight weeks, according to the latest Commitment of Traders (COT) data released by the Commodity Futures Trading Commission (CFTC) on Friday.

The non-commercial futures contracts of Comex gold futures, traded by large speculators and hedge funds, totaled a net position of +81,833 contracts in the data reported through April 22nd. This was a change of +2,541 contracts from the previous week’s total of +79,292 net contracts on April 15th.

Over the weekly reporting time-frame, from Tuesday April 15th to Tuesday April 22nd, the gold price declined from approximately $1,302.90 to $1,284.90 per ounce, according to gold futures price data from investing.com.


Last 6 Weeks of Large Trader Non-Commercial Positions

DateOpen InterestLong SpecsShort SpecsNet Non-CommercialsWeekly ChangeGold Price
03/18/201442062618332446510136814179241359.00
03/25/201439826416908351766117317-194971311.00
04/01/201436345115815258007100145-171721279.60
04/08/20143654001496936109488599-115461310.10
04/15/20143695771474326814079292-93071302.9
04/22/2014372593146880650478183325411284.9

*COT Report: The weekly commitment of traders report summarizes the total trader positions for open contracts in the futures trading markets. The CFTC categorizes trader positions according to commercial hedgers (traders who use futures contracts for hedging as part of the business), non-commercials (large traders who speculate to realize trading profits) and nonreportable traders (usually small traders/speculators). Find CFTC criteria here: (http://www.cftc.gov/MarketReports/CommitmentsofTraders/ExplanatoryNotes/index.htm).

Article by CountingPips.comForex Trading Apps


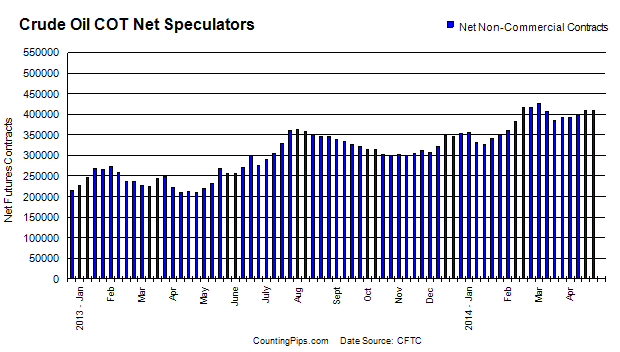
Crude Oil Speculators added to bullish positions for 5th straight week

By CountingPips.com

Weekly CFTC Net Speculator Report

Crude

CRUDE OIL: Large futures market traders and speculators slightly increased their overall bullish bets in crude oil futures for a fifth straight week and to the highest level since March 4th last week, according to the latest Commitment of Traders (COT) data released by the Commodity Futures Trading Commission (CFTC) on Friday.

The non-commercial contracts of crude oil futures, primarily traded by large speculators and hedge funds, totaled a net position of +410,125 contracts in the data reported for April 22nd. This was a change of just +574 contracts for the week. The previous week had seen a total of +409,551 net contracts in the data through April 15th.

The total level of +410,125 bullish positions brings crude oil positions to the highest standing since March 4th when total net positions reached +425,818 contracts.

Over the weekly reporting time-frame, from Tuesday April 15th to Tuesday April 22nd, the crude oil price declined from $103.78 to $101.92 per barrel, according to Nymex futures price data from investing.com. Brent crude prices, meanwhile, edged up from $109.20 to $109.44 per barrel from Tuesday April 15th to Tuesday April 22nd, also according to prices from investing.com.

Last 6 Weeks of Large Trader Non-Commercial Positions

DateOpen InterestLong SpecsShort SpecsNet Non-CommercialsWeekly ChangeOil Price
03/18/20141623266492620108335384285-2254798.88
03/25/20141604566498080106906391174688999.19
04/01/2014164450750238911060639178360999.61
04/08/201416554725120351122483997878004102.33
04/15/201416742765234901139394095519764103.78
04/22/20141619737517023106898410125574101.92

*COT Report: The weekly commitment of traders report summarizes the total trader positions for open contracts in the futures trading markets. The CFTC categorizes trader positions according to commercial hedgers (traders who use futures contracts for hedging as part of the business), non-commercials (large traders who speculate to realize trading profits) and nonreportable traders (usually small traders/speculators). Find CFTC criteria here: (http://www.cftc.gov/MarketReports/CommitmentsofTraders/ExplanatoryNotes/index.htm).

Article by CountingPips.comForex Trading News


Inside Story: What It Means When the DJIA Goes Post-Industrial

By Elliott Wave International

Every time you use a new app on your smartphone, you may utter a silent prayer of gratitude for living in a post-industrial age. No more back-breaking heavy labor. Now, it’s all about technology and brain power.

But what does it mean when the Dow Jones Industrial Average enters the post-Industrial Average age? Here’s a hint from The Elliott Wave Financial Forecast that was published last October:

The Dow Jones Post-Industrial Average
Changes in the components of the Dow Jones Industrial Average don’t always come at stock tops, but they do sometimes. And when they do, the nature of the change tends to say a lot about the decline that is about to unfold. Intel and Microsoft, for instance, were added to the Dow in November 1999, a few months before the technology bubble burst in March 2000. In February 2008, four months after the Dow’s October 2007 top, Bank of America was added to the index, just as the banking calamity started to unfold. On September 10, 2013, Bank of America, Hewlett-Packard and Alcoa were replaced by Goldman Sachs, Visa and Nike. We think the timing will prove prescient again… .

Why? Get the inside scoop on what kind of leadership the financial, consumer debt and fitness sectors will provide now that they have taken their place in the DJIA by reading The State of the U.S. Markets – 2014 Edition. This 24-page report brings you all the in-depth and behind-the-scenes news that you need to protect yourself from complacency about financial markets, once you see more clearly how they are over-reaching now.

Start reading The State of the U.S. Markets – 2014 Edition from Elliott Wave International for free now.


Thoughts from the Frontline: The Cost of Code Red

By John Mauldin

(It is especially important to read the opening quotes this week. They set up the theme in the proper context.)

 “There is no means of avoiding the final collapse of a boom brought about by credit expansion. The alternative is only whether the crisis should come sooner as the result of a voluntary abandonment of further credit expansion, or later as a final and total catastrophe of the currency system involved.”

– Ludwig von Mises

“No very deep knowledge of economics is usually needed for grasping the immediate effects of a measure; but the task of economics is to foretell the remoter effects, and so to allow us to avoid such acts as attempt to remedy a present ill by sowing the seeds of a much greater ill for the future.”

– Ludwig von Mises

“[Central banks are at] serious risk of exhausting the policy room for manoeuver over time.”

– Jaime Caruana, General Manager of the Bank for International Settlements

“The gap between the models in the world of monetary policymaking is now wider than at any time since the 1930s.”

– Benjamin Friedman, William Joseph Maier Professor of Political Economy, Harvard

To listen to most of the heads of the world’s central banks, things are going along swimmingly. The dogmatic majority exude a great deal of confidence in their ability to manage their economies through whatever crisis may present itself. (Raghuram Rajan, the sober-minded head of the Reserve Bank of India, is a notable exception.)

However, there is reason to believe that there have been major policy mistakes made by central banks – and will be more of them – that will lead to dislocations in the markets – all types of markets. And it’s not just the usual anti-central bank curmudgeon types (among whose number I have been counted, quite justifiably) who are worried. Sources within the central bank community are worried, too, which should give thoughtful observers of the market cause for concern.

Too often we as investors (and economists) are like the generals who are always fighting the last war. We look at bank balance sheets (except those of Europe and China), corporate balance sheets, sovereign bond spreads and yields, and say it isn’t likely that we will repeat this mistakes which led to 2008. And I smile and say, “You are absolutely right; we are not going to repeat those mistakes. We learned our lessons. Now we are going to make entirely new mistakes.” And while the root cause of the problems, then and now, may be the same – central bank policy – the outcome will be somewhat different. But a crisis by any other name will still be uncomfortable.

If you look at some of the recent statements from the Bank for International Settlements, you should come away with a view much more cautious than the optimistic one that is bandied about in the media today. In fact, to listen to the former chief economist of the BIS, we should all be quite worried.

I am of course referring to Bill White, who is one of my personal intellectual heroes. I hope to get to meet him someday. We have discussed some of his other papers, written in conjunction with the Dallas Federal Reserve, in past letters. He was clearly warning about imbalances and potential bubbles in 2007 and has generally been one of the most prescient observers of the global economy. The prestigious Swiss business newspaper Finanz und Wirtschaft did a far-reaching interview with him a few weeks ago, and I’ve taken the liberty to excerpt pieces that I think are very important. The excerpts run a few pages, but this is really essential reading. (The article is by Mehr zum Thema, and you can read the full piece here.)

Speculative Bubbles

The headline for the interview is “I see speculative bubbles like in 2007.” As the interviewer rolls out the key questions, White warns of grave adverse effects of ultra-loose monetary policy:

William White is worried. The former chief economist of the Bank for International Settlements is highly skeptical of the ultra-loose monetary policy that most central banks are still pursuing. “It all feels like 2007, with equity markets overvalued and spreads in the bond markets extremely thin,” he warns.

Mr. White, all the major central banks have been running expansive monetary policies for more than five years now. Have you ever experienced anything like this?

The honest truth is no one has ever seen anything like this. Not even during the Great Depression in the Thirties has monetary policy been this loose. And if you look at the details of what these central banks are doing, it’s all very experimental. They are making it up as they go along. I am very worried about any kind of policies that have that nature.

But didn’t the extreme circumstances after the collapse of Lehman Brothers warrant these extreme measures?

Yes, absolutely. After Lehman, many markets just seized up. Central bankers rightly tried to maintain the basic functioning of the system. That was good crisis management. But in my career I have always distinguished between crisis prevention, crisis management, and crisis resolution. Today, the Fed still acts as if it was in crisis management. But we’re six years past that. They are essentially doing more than what they did right in the beginning. There is something fundamentally wrong with that. Plus, the Fed has moved to a completely different motivation. From the attempt to get the markets going again, they suddenly and explicitly started to inflate asset prices again. The aim is to make people feel richer, make them spend more, and have it all trickle down to get the economy going again. Frankly, I don’t think it works, and I think this is extremely dangerous.

So, the first quantitative easing in November 2008 was warranted?

Absolutely.

But they should have stopped these kinds of policies long ago?

Yes. But here’s the problem. When you talk about crisis resolution, it’s about attacking the fundamental problems that got you into the trouble in the first place. And the fundamental problem we are still facing is excessive debt. Not excessive public debt, mind you, but excessive debt in the private and public sectors. To resolve that, you need restructurings and write-offs. That’s government policy, not central bank policy. Central banks can’t rescue insolvent institutions. All around the western world, and I include Japan, governments have resolutely failed to see that they bear the responsibility to deal with the underlying problems. With the ultraloose monetary policy, governments have no incentive to act. But if we don’t deal with this now, we will be in worse shape than before.

But wouldn’t large-scale debt write-offs hurt the banking sector again?

Absolutely. But you see, we have a lot of zombie companies and banks out there. That’s a particular worry in Europe, where the banking sector is just a continuous story of denial, denial and denial. With interest rates so low, banks just keep ever-greening everything, pretending all the money is still there. But the more you do that, the more you keep the zombies alive, they pull down the healthy parts of the economy. When you have made bad investments, and the money is gone, it’s much better to write it off and get fifty percent than to pretend it’s still there and end up getting nothing. So yes, we need more debt reduction and more recapitalization of the banking system. This is called facing up to reality.

Where do you see the most acute negative effects of this monetary policy?

The first thing I would worry about are asset prices. Every asset price you could think of is in very odd territory. Equity prices are extremely high if you at valuation measures such as Tobin’s Q or a Shiller-type normalized P/E. Risk-free bond rates are at enormously low levels, spreads are very low, you have all these funny things like covenant-lite loans again. It all looks and feels like 2007. And frankly, I think it’s worse than 2007, because then it was a problem of the developed economies. But in the past five years, all the emerging economies have imported our ultra-low policy rates and have seen their debt levels rise. The emerging economies have morphed from being a part of the solution to being a part of the problem.

Do you see outright bubbles in financial markets?

Yes, I do. Investors try to attribute the rising stock markets to good fundamentals. But I don’t buy that. People are caught up in the momentum of all the liquidity that is provided by the central banks. This is a liquidity-driven thing, not based on fundamentals.

So are we mostly seeing what the Fed has been doing since 1987 – provide liquidity and pump markets up again?

Absolutely. We just saw the last chapter of that long history. This is the last of a whole series of bubbles that have been blown. In the past, monetary policy has always succeeded in pulling up the economy. But each time, the Fed had to act more vigorously to achieve its results. So, logically, at a certain point, it won’t work anymore. Then we’ll be in big trouble. And we will have wasted many years in which we could have been following better policies that would have maintained growth in much more sustainable ways. Now, to make you feel better, I said the same in 1998, and I was way too early.

What about the moral hazard of all this?

The fact of the matter is that if you have had 25 years of central bank and government bailout whenever there was a problem, and the bankers come to appreciate that fact, then we are back in a world where the banks get all the profits, while the government socializes all the losses. Then it just gets worse and worse. So, in terms of curbing the financial system, my own sense is that all of the stuff that has been done until now, while very useful, Basel III and all that, is not going to be sufficient to deal with the moral hazard problem. I would have liked to see a return to limited banking, a return to private ownership, a return to people going to prison when they do bad things. Moral hazard is a real issue.

Do you have any indication that the Yellen Fed will be different than the Greenspan and Bernanke Fed?

Not really. The one person in the FOMC that was kicking up a real fuss about asset bubbles was Governor Jeremy Stein. Unfortunately, he has gone back to Harvard.

The markets seem to assume that the tapering will run very smoothly, though. Volatility, as measured by the Vix index, is low.

Don’t forget that the Vix was at [a] record low in 2007. All that liquidity raises the asset prices and lowers the cost of insurance. I see at least three possible scenarios how this will all work out. One is: Maybe all this monetary stuff will work perfectly. I don’t think this is likely, but I could be wrong. I have been wrong so many times before. So if it works, the long bond rates can go up slowly and smoothly, and the financial system will adapt nicely. But even against the backdrop of strengthening growth, we could still see a disorderly reaction in financial markets, which would then feed back to destroy the economic recovery.

How?

We are such a long way away from normal long-term interest rates. Normal would be perhaps around four percent. Markets have a tendency to rush to the end point immediately. They overshoot. Keynes said in late Thirties that the long bond market could fluctuate at the wrong levels for decades. If fears of inflation suddenly re-appear, this can move interest rates quickly. Plus, there are other possible accidents. What about the fact that maybe most of the collateral you need for normal trading is all tied up now? What about the fact that the big investment dealers have got inventories that are 20 percent of what they were in 2007? When things start to move, the inventory for the market makers might not be there. That’s a particular worry in fields like corporate bonds, which can be quite illiquid to begin with. I’ve met so many people who are in the markets, thinking they are absolutely brilliantly smart, thinking they can get out in the right time. The problem is, they all think that. And when everyone races for the exit at the same time, we will have big problems. I’m not saying all of this will happen, but reasonable people should think about what could go wrong, even against a backdrop of faster growth.

And what is the third scenario?

The strengthening growth might be a mirage. And if it does not materialize, all those elevated prices will be way out of line of fundamentals.

Which of the major central banks runs the highest risk of something going seriously wrong?

At the moment what I am most worried about is Japan. I know there is an expression that the Japanese bond market is called the widowmaker. People have bet against it and lost money. The reason I worry now is that they are much further down the line even than the Americans. What is Abenomics really? As far as I see it, they print the money and tell people that there will be high inflation. But I don’t think it will work. The Japanese consumer will say prices are going up, but my wages won’t. Because they haven’t for years. So I am confronted with a real wage loss, and I have to hunker down. At the same time, financial markets might suddenly not want to hold Japanese Government Bonds anymore with a perspective of 2 percent inflation. This will end up being a double whammy, and Japan will just drop back into deflation. And now happens what Professor Peter Bernholz wrote in his latest book. Now we have a stagnating Japanese economy, tax revenues dropping like a stone, the deficit already at eight percent of GDP, debt at more than 200 percent and counting. I have no difficulty in seeing this thing tipping overnight into hyperinflation. If you go back into history, a lot of hyperinflations started with deflation.

Many people have warned of inflation in the past five years, but nothing has materialized. Isn’t the fear of inflation simply overblown?

One reason we don’t see inflation is because monetary policy is not working. The signals are not getting through. Consumers and corporates are not responding to the signals. We still have a disinflationary gap. There has been a huge increase in base money, but it has not translated into an increase in broader aggregates. And in Europe, the money supply is still shrinking. My worry is that at some point, people will look at this situation and lose confidence that stability will be maintained. If they do and they do start to fear inflation, that change in expectations can have very rapid effects.

To continue reading this article from Thoughts from the Frontline – a free weekly publication by John Mauldin, renowned financial expert, best-selling author, and Chairman of Mauldin Economics – please click here.

 

Gold Bounces Back Above $1,300 as Ukraine Crisis Escalates

By Jason Hamlin, GoldStockBull.com

John Kerry and other U.S. officials and once again banging the war drums. In the most recent comments, Kerry said that the United States is “ready to act against Russia.” The truth is that the U.S. has been acting against Russia for quite some time in various ways. The implication here is that the U.S. government is now ready to act militarily, however subtly it may have been stated. To get an idea of just how quickly the conflict has been escalating, here are some of the headlines from the past week alone:

On the positive side of things, Obama says: “I would ‘absolutely’ save Putin from drowning.” Good to know, but you might want to put a leash on your overly zealous secretary of state that is threatening military action against a nuclear-armed Russia. Otherwise, we may all face the possibility of drowning in a sea of radiation.

obama-putin-economic_warfareThere is no justification for the United States to be interfering in the internal affairs of Ukraine or Russia. We are antagonizing a nation with a formidable military and newfound wealth via growing energy exports. Digging deeper, it seems clear that the U.S. involvement is nothing more than geopolitical positioning and a desperate attempt to save the world reserve petrodollar.

Russia, China and other BRICS have been moving to abandon the dollar in international trade. There are plans for a massive $30 billion oil pipeline from Russia through China to India that could shift the geopolitical balance of power in the world.

Back in the U.S., Treasury bond auctions are failing to attract foreign buyers, leaving the FED as the buyer of last resort. Put in laymen’s terms, nobody want to buy U.S. debt anymore and the financially insolvent government must now rely upon debt monetization by the Federal Reserve in order to continue functioning. In essence, they are stealing wealth from dollar holders around the globe in order to continue with an insanely-bloated military budget and kickbacks for their political donors.

There isn’t too much that U.S. citizens can do about this theft, other than buying gold to protect from inflation or renouncing their citizenship and moving abroad. But sovereign nations around the globe are no longer putting up with it. They are publicly discussing dumping their U.S. debt and dollar holdings in favor of gold, amongst other assets. They are also trading in local currencies, decreasing the global demand for Federal Reserve notes.

The U.S. may have been able to squash this threat to the petrodollar’s reserve status by attacking Iraq and Libya when they started trading oil outside of the dollar or discussing a gold-backed currency. But there are limits to the military dominance of the United States and chicken-hawk politicians are now finding this out via the confrontation with Russia. Bullying tactics will also not work on China or a growing list of other nations that are no longer willing to cowtow to U.S. military might.

Further damaging the standing of the United States in the eyes of the world were the revelations of the NSA spying scandal by Edward Snowden. Apparently, even allies have a limited tolerance when their personal phone conversations are being recorded by U.S. government agencies. Once the envy of the world, there is now a growing perception of the U.S. as a bullying, hypocritical superpower skirting international law and order for their own benefit. Unfortunately, this criminal element within the U.S. government appears to be increasingly desperate to hold onto their power and willing to risk war with nuclear-armed nations in order to keep the banking system afloat and the benefits of being able to print the world reserve currency intact.

Anyone studying international politics or contemplating how to best allocate assets has to consider just how serious the implications would be if the rest of world stopped using dollars and stopped buying U.S. debt. In the short-term, how will the dollar and stock market react to an escalation of the conflict between the United Stats and Russia?

Nuclear deterrence worked well during the Cold War for fear of mutually-assured destruction. Has anything changed? Would the U.S. really launch a military attack against Russia? Could a minor miscommunication, rogue agent or unforseen accident plunge the human race into another world war? Would both sides restrain from using nuclear weapons?

In addition to a series of toothless sanctions, the rating agency S&P downgraded Russia to just above junk status this week. In response, Russia has proposed what amounts to all-out economic warfare against NATO countries. ZeroHedge reports:

Ahead of yet another round of western sanctions which appears imminent unless Obama is to look even more powerless than he currently is (granted, a difficult achievement), Russian presidential adviser Sergei Glazyev proposed plan of 15 measures to protect country’s economy if sanctions applied, Vedomosti newspaper reports, citing Glazyev’s letter to Finance Ministry. According to Vedomosti as Bloomberg reported, Glazyev proposed:

  • Russia should withdraw all assets, accounts in dollars, euros from NATO countries to neutral ones
  • Russia should start selling NATO member sovereign bonds before Russia’s foreign-currency accounts are frozen
  • Central bank should reduce dollar assets, sell sovereign bonds of countries that support sanctions
  • Russia should limit commercial banks’ FX assets to prevent speculation on ruble, capital outflows
  • Central bank should increase money supply so that state cos., banks may refinance foreign loans
  • Russia should use national currencies in trade with customs Union members, other non-dollar, non-euro partners

Whether the conflict escalates solely via economic means or turns into physical warfare, investors are likely to flee to safe-haven assets such as precious metals. Gold and silver prices have been very volatile thus far in 2014. After an initial rally from $1,200 to around $1,400, gold has since given back half of the gain. The metal was slammed down yesterday to $1,270 briefly, but quickly bounced back above $1,300. There appears to be strong buying support around $1,300 and I continue to believe that gold has plenty of upside remaining.

gold chart

The silver slamdown and recovery was even more pronounced, with the price dipping below $19 before recovering back towards $20.

silver-1

The longer-term chart remains bullish for silver as support at $19 has held on four occasions in the past year. The price is below the key moving averages, but a general trend of higher lows has been established and the RSI is pointing higher with plenty of room to run. This appears to be an excellent entry point for long-term investors.

silver chart

Lastly, gold mining stocks remain severely oversold and undervalued relative to the metal. After a bounce in early 2014, the HUI/Gold ratio is back to 0.17. This represents how much gold you could buy with one unit of the HUI Gold Bugs Mining Stock Index and the ratio is roughly half of the average level seen since the start of the gold bull market in 2001.

HUI Gold

In other words, there appears to be significant upside potential in gold stocks with limited downside risk at current prices. With several mining companies suspending operations due to the low gold prices, supplies should drop and force prices higher over the next few years.

In my view, precious metals appear to be one of the only asset classes that is not currently overvalued. Stocks, real estate, bonds and just about every other asset class looks to be in bubble territory by most measurements.

By contrast, quality mining stocks with low costs, high growth profiles, strong management and stable political jurisdictions look incredibly undervalued. They are trading at a fraction of their previous highs and at their lowest levels relative to gold since the start of this bull market. Even a moderate rise in the prices of gold and silver should send many of these stocks soaring. If the crisis in Ukraine continues on the current path of escalation, we are likely to see continued weakness in the stock market and much higher prices for gold, silver and the companies that mine these metals.

I am hopeful that cooler heads will prevail and a military conflict with Russia will be avoided. However, I believe it makes sense to hope for the best and prepare for the worst. And regardless of what happens in the current conflict over Ukraine, the fundamentals for gold and silver remain bullish. Increasing debt levels, runaway spending, money printing, quantitative easing, growing demand from China and several other factors are likely to push prices much higher in the coming years.

Newsletter_Cover_Small_3DIf you would like to view the Gold Stock Bull portfolio, see our top stock picks, receive the monthly newsletter and get email updates whenever we are buying or selling, click here to sign up for the premium membership.

DISCOUNT CODE: Use “gsb20″ when signing up to take 20% off your membership price!


Article By Jason Hamlin, GoldStockBull.com