By CentralBankNews.info
Hungary’s central bank, which earlier today cut its base rate for the 21st time in a row, said the “slight improvement in risk perceptions associated with the economy provided room for a cautions reduction in interest rates.”
The National Bank of Hungary, which cut its base rate by a further 10 basis points to 2.50 percent, repeated its guidance from March that the base rate had now approached a level that ensures price stability in the medium term and support for the economy.
But it added today that “over the coming period, changes in the domestic and international environment might influence this picture,” signaling that the bank now considers rates to be broadly neutral and future policy changes would depend on incoming data.
The central bank’s council said economic growth is likely to continue and while the pace of economic activity is strengthening, output remains below potential and is likely to return to close to that level during the next year.
“Inflationary pressures in the economy are likely to remain moderate over the medium term and inflation is likely to move into line with the medium-term inflation target from 2015,” the bank said.
(more to come)
USDJPY: Bullish, Extends Recovery
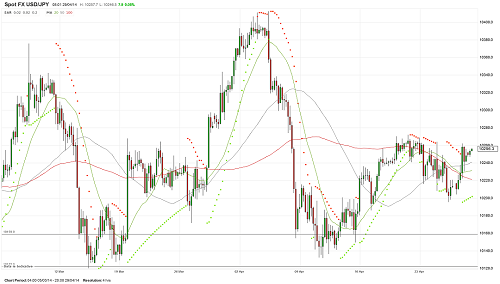
USDJPY: With USDJPY strengthening for a second day in a row today, further bullishness is envisaged. However, it requires a convincing break and hold above the 102.72 level to create scope for more upside. Resistance comes in at the 103.00 level where a breach will turn focus to the 103.50 level. Further out, resistance is seen at the 104.00 level and then the 104.50 level. On the other hand, support stands at the 102.00 level where a break if seen will aim at the 101.50 followed by the 101.00 and then the 100.75 level. Further down, support stands at the 100.00 level followed by the 99.00 level. On the whole, USDJPY remains exposed to the upside on corrective recovery risk.
Article by www.fxtechstrategy.com
Hungary cuts rate by 10 bps, 21st cut in a row
By CentralBankNews.info
Hungary’s central bank cut its base rate by a further 10 basis points to 2.50 percent, its 21st consecutive rate cut, but made no further immediate comment.
The National Bank of Hungary has now cut its rate by 450 basis points since embarking on an easing cycle in August 2012.
Last month the bank signaled that it was likely to pause with further cuts, saying the base rate had approached a level that would ensure prices stability and support for the economy.
From August 2012 until July 2013 the central bank cut its base rate in 25-basis point increments but starting in August 2013 the size of the cuts were trimmed to 20 basis points as the bank was aware of the need to keep rates high enough to attract global investors who had started to reassess their view of the attractiveness of investing in emerging markets.
In January and February this year, the central bank further reduced the size of rate cuts to 15 basis points and in March the cut was 10 basis points, as today.
Hungary’s headline inflation rate was steady at 0.1 percent in March and February and the central bank has said it expects inflation to remain below its 3.0 percent target this year at an average of 0.7 percent before moving into line with the target from next year.
Hungary’s economy dived into recession in 2012 but rebounded last year and the central bank has said it expects growth to continue this year, supported by exports that are expects to play an important source of growth in coming years and investments that are likely to pick up more gradually.
In March the central bank forecast 2.1 percent economic growth for 2014 and 2.5 percent for 2015, up from 1.1 percent in2013.
The country’s Gross Domestic Product expanded by 0.5 percent in the fourth quarter of 2013 from the third quarter for annual growth of 2.7 percent, up from 1.8 percent in the previous quarter.
Hungary’s forint currency has been weakening against the euro since mid-2012 and depreciated by 2 percent in 2013 and has continued to ease this year. Today it was quoted at 309.28 to the euro today, down 3.9 percent this year.
Last week the central bank changed its main instrument for managing liquidity, replacing the two-week bill with a two-week deposit facility from Aug. 1.
The move is an attempt to reduce the country’s external debt by motivating domestic banks to hold more forint-denominated government debt as deposits with the central bank will no longer be accepted as collateral against loans. The bank hopes that funds up to 1 trillion forints, including 600-800 billion held by foreign banks, would be swapped into government debt from two-week deposits.
Gold Trades Lower ; FOMC Meeting In Spotlight
Gold futures were seen trading below the $1,300 threshold on Tuesday, while US reported an upbeat housing data and investors focus on the two-day monthly policy meeting held by the US Federal Reserve (Fed) which will begin later in the day.
Bullion futures for June delivery edged 0.78% lower to $1,289.10 an ounce on the New York Comex at the time of writing, while silver futures fell 1.02% to $19.420 an ounce at the same time.
FOMC Meeting
Investors will be focusing on the outcome of the Federal Reserve two-day monthly policy meeting which will begin later in the day, with predictions that the Federal Reserve will announce another cut to its stimulus for the fourth time in a row.
Meanwhile, US Federal Reserve Chair Janet Yellen is expected to give a speech at the Independent Community Bankers of America’s Annual Policy Summit on Thursday.
Investors will also be focusing on the release of the non-farm payrolls figures due Friday, with estimates of 210,000 additional new jobs, compared to the previous figure of 192,000.
Gold’s net-long status climbed by 0.5% to 90,572 futures and options in the week ending April 22, the first rise since March 18, reports from the US Commodity Futures Trading Commission showed.
Gold has climbed by 8% this year, bouncing back from the 28% drop seen last year and boosted by the sustained physical demand. . “Although it is difficult to predict gold prices over short term, yet the increasing geo-political risks and increasing profit-taking pressure in US market are very visible and obvious as of now, hence fueling near-term positive sentiments towards gold price and gold stocks,” Helen Lau, a senior analyst at UOB Kay Hian (Hong Kong) Research, wrote in a note.
Visit www.hymarkets.com to find out more about our products and start trading today with only $50 using the latest trading technology today
The post Gold Trades Lower ; FOMC Meeting In Spotlight appeared first on | HY Markets Official blog.
Article provided by HY Markets Forex Blog
Stocks Market Review 29th April
Stocks – Asia
Stocks in Asia were seen swinging between losses and gains on Tuesday after the corporate data releases with a regional gauge near its lowest close in a month and the markets in Japan were shut for a public holiday.
Hong Kong’s benchmark Hang Seng index climbed 0.09% to 22,152.00 at the time of writing, while the Chinese benchmark Shanghai Composite edged 0.84% higher to 2,020.34 on Tuesday.
The property developer China Vanke slid 1.82%, while China Petroleum & Chemical Corp fell 1.6% after the refiner reported its first-quarter profit which came in lower than forecasted. China’s biggest carrier, China Unicorn climbed 3.60% higher, while the real estate company Hang Lung Properties gained 3.14%.
Stocks – Australia
In Sydney, the benchmark S&P/ASX 200 index fell 0.92%, to close at 5,485.30. Australia’s largest gold producer, Newcrest Mining, lost 3.1% while the food company, Goodman Fielder added 4.25%.
Stocks – Europe
In Europe, stocks were trading higher, following the release of several earning reports from major companies as the market wait for important macroeconomic reports from Germany, the UK and Italy.
The European Euro Stoxx climbed 0.54% to 3,182.85 at the time of writing while the German DAX rose 0.85% to 9,526.35. At the same time the French CAC 40 edged 0.29% higher to 4,473.57, while the UK benchmark FTSE 100 index gained 0.55% to 6,737.02.
In Spain, the Labour Ministry reported the unemployment rate for the first quarter, which climbed to 25.93%, up from the previous figure of 25.73%.
Italy’s retail sales are expected to show a flat reading in February month-on-month and expected to show a 0.7% drop on an annual basis.
FOMC Meeting
The Federal Reserve will begin its two-day monthly policy meeting later in the day with predictions that the Federal Reserve will announce another cut to its stimulus for the fourth time in a row.
Visit www.hymarkets.com to find out more about our products and start trading today with only $50 using the latest trading technology today
The post Stocks Market Review 29th April appeared first on | HY Markets Official blog.
Article provided by HY Markets Forex Blog
Pressure On The U.S. Dollar And The Yen Remaining
Demand For The EURUSD Remaining
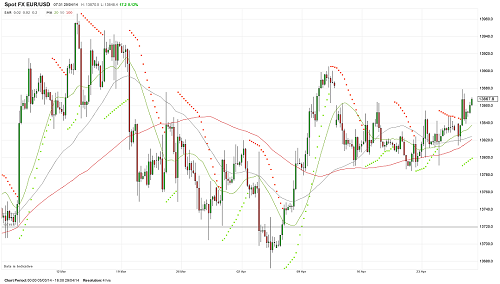
The EURUSD decreased to 1.3823 yesterday, where it was bough out and increased to 1.3879. It did not continue to rise, as having tested the level, the EURUSD retreated to 1.3839. Nevertheless, declines continue to attract steady interest to sales, and now the euro is approaching yesterday’s highs. The pair can continue rising, however it should overcome quite a few obstacles on the way to the psychological level of 1.4000. Falling to 1.3800 will increase a probability of a breakout through support with a further decline to 1.3720.
The GBPUSD Continuing to Be Bought
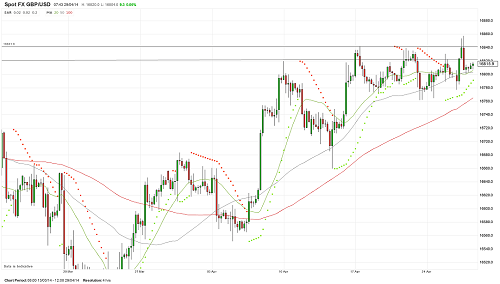
The British pound in pair with the U.S. dollar traded quite positively yesterday. On wane to 1.6777 the pair was bought out, and then it rose to 1.6857, having overcome the levels of 1.6822 and 1.6841. However, the pound failed to consolidate higher that led to a decline to 1.6800. Demand for the pair remains here, but its immediate inability to consolidate above the broken highs is a negative factor, increasing the risks of the development of a descending correction. Today, data on the GDP in Great Britain will be published, which can either support a rise in the pound or contribute to its decline below 1.6762.
The USDCHF Can Test 0.8700
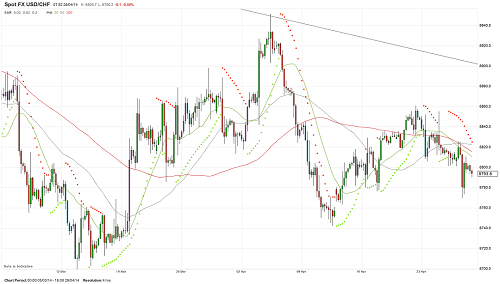
The USDCHF continued falling and tested the level of 0.8770, after that retreated to 0.8810. Nevertheless, the dollar remains under pressure along with the downside risks towards the 87th figure. A breakout of which will strengthen its falling. The dollar should rise and consolidate above 0.8951 to weaken a bearish impulse. A steady breakout through the resistance around 0.9118 will give a reason to imply a base formation with the development of a large ascending correction.
The USDJPY Increasing Again
The support around the 102nd figure held out and from which the USDJPY went steady upward. As a result of a rise, the dollar tested the resistance around 102.62, after that retreated to 102.30. Nevertheless, demand for it remains, and it approached to yesterday’s highs again. Thus, ability to consolidate above the 102nd figure increases the risks of a breakout through current resistance and further development of an upward momentum. In this case a rise to 103.40-104.00 should be expected. In turn, a breakout of the 102nd figure will lead to testing the support around 101.59.
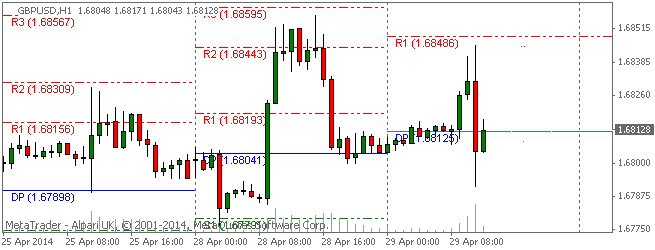
GBPUSD Forex Trading Pivot Point Levels for 2014.04.29
2014.04.29 12:30 6:30AM ET | GBPUSD Currency Pair
Here are the Pivot Points Levels with Support (S) and Resistance (R) for the GBPUSD currency pair today. Price action is currently trading slightly over the daily pivot point at the 1.68128 price level, according to data at 6:30 AM ET. The GBPUSD high for the day has been 1.68450 while the low of day has reached to 1.67914. The pair earlier today opened the Asian trading session below the daily pivot and has trended sideways after spiking higher and coming back to the pivot area.
Daily Pivot Point: 1.68125
— S1 – 1.67684
— S2 – 1.67324
— S3 – 1.66883
— R1 – 1.68485
— R2 – 1.68926
— R3 – 1.69286
Weekly Pivot Points: GBPUSD
Prices are currently trading over the weekly pivot point at time of writing. The GBPUSD has been on an overall slightly bullish trend this week after opening the trading week right near the weekly pivot.
Weekly Pivot Point: 1.67980
— S1 – 1.67575
— S2 – 1.67206
— S3 – 1.66801
— R1 – 1.68349
— R2 – 1.68754
— R3 – 1.69123
By CountingPips.com – Forex Trading Apps & Currency Trade Tools
Disclaimer: Foreign Currency trading and trading on margin carries a high level of risk and volatility and can result in loss of part or all of your investment. All information and opinions contained do not constitute investment advice and accuracy of prices, charts, calculations cannot be guaranteed.
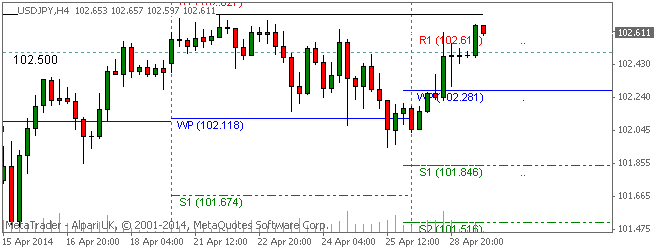
USDJPY Forex Trading Pivot Point Levels for 2014.04.29
2014.04.29 12:30 6:30AM ET | USDJPY Currency Pair
Here are the Pivot Points Levels with Support (S) and Resistance (R) for the USDJPY currency pair today. Price action is currently trading at the 102.611 price level and over the daily pivot point, according to data at 6:30 AM ET. The USDJPY high for the day has been 102.662 while the low of day has been reached at 102.436. The pair earlier today opened the Asian trading session above the daily pivot and has trended higher over the course of the day.
Daily Pivot Point: 102.377
— S1 – 102.137
— S2 – 101.798
— S3 – 101.558
— R1 – 102.716
— R2 – 102.956
— R3 – 103.295
Weekly Pivot Points: USDJPY
Prices are currently trading over the weekly pivot point and right at the R1 resistance level at time of writing. The USDJPY has been on an overall bullish trend this week after opening the trading week below the weekly pivot.
Weekly Pivot Point: 102.281
— S1 – 101.845
— S2 – 101.516
— S3 – 101.080
— R1 – 102.610
— R2 – 103.046
— R3 – 103.375
By CountingPips.com – Forex Trading Apps & Currency Trade Tools
Disclaimer: Foreign Currency trading and trading on margin carries a high level of risk and volatility and can result in loss of part or all of your investment. All information and opinions contained do not constitute investment advice and accuracy of prices, charts, calculations cannot be guaranteed.
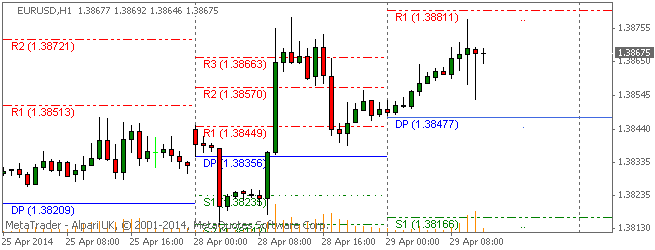
EURUSD Forex Trading Pivot Point Levels for 2014.04.29
2014.04.29 12:30 6:30AM ET | EURUSD Currency Pair
Here are the Pivot Points Levels with Support (S) and Resistance (R) for the EURUSD currency pair today. Price action is currently trading over the daily pivot point and at the 1.38675 price level, according to data at 6:30 AM ET. The EURUSD high for the day has been 1.38782 while the low of day has reached to 1.38484. The pair earlier today opened the Asian trading session slightly above the daily pivot and has trended higher today.
Daily Pivot Point: 1.38477
— S1 – 1.38166
— S2 – 1.37832
— S3 – 1.37521
— R1 – 1.38811
— R2 – 1.39122
— R3 – 1.39456
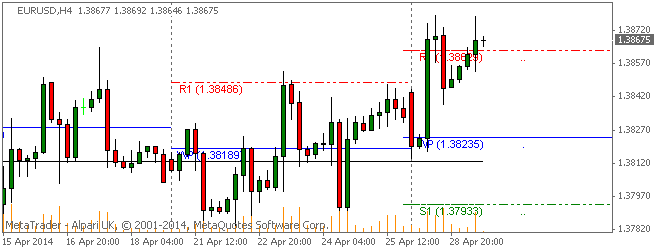
Weekly Pivot Points: EURUSD
Prices are currently trading over the weekly pivot point and above the R1 resistance level at time of writing. The EURUSD has been on an overall bullish trend this week after opening the trading week above the weekly pivot and finding support around the main pivot area.
Weekly Pivot Point: 1.38235
— S1 – 1.37933
— S2 – 1.37539
— S3 – 1.37237
— R1 – 1.38629
— R2 – 1.38931
— R3 – 1.39325
By CountingPips.com – Forex Trading Apps & Currency Trade Tools
Disclaimer: Foreign Currency trading and trading on margin carries a high level of risk and volatility and can result in loss of part or all of your investment. All information and opinions contained do not constitute investment advice and accuracy of prices, charts, calculations cannot be guaranteed.
AUD/CAD – Uptrend is systematically invalidated
Technical Sentiment: Bearish
Key Takeaways
- Pair trades below 200 Simple Moving Average on 4H;
- Breaks below bullish trendline;
- The 1.0150 support is next, followed by parity.
After last week’s trendline bounce, AUD/CAD bounced just enough to test the price pivot zone at 1.0254 and reject towards the downside. Since then, the pair has broken below the bullish trendline starting from January 2nd and easily crossed below the 200 Simple Moving Average on the 4H time frame, slowly invalidating all the support levels which held the 4-month uptrend intact.
Technical Analysis

The rejection off the 1.0254 pivot zone led to the formation of an engulfing bar on the daily chart, a bearish price action pattern which was activated during the Asian session. The pair is now heading lower to test a very strong support level at 1.0150. The 50-Day Moving Average, priced at 1.0133, is a nearby secondary support.
1.0150 is a crucial level on the Daily timeframe. It is the last barrier before the pair shows a complete bearish trend configuration. A Lower Low is required from AUD/CAD, otherwise future rallies might not be capped half-way and selling them will no longer be a viable option.
Daily Stochastic is heading into oversold territory, putting the pair at risk of a bullish bounce soon. If traders fail to break below 1.0150, AUD/CAD might begin another rally towards 1.0212 (200 SMA on 4H) and 1.0254. If the resistance levels won’t hold, the pair might resume the overall uptrend in the weeks to come.
*********
Prepared by Alexandru Z., Chief Currency Strategist at Capital Trust Markets
