Crude Prices Extends Losses as Stockpiles Rises

By HY Markets Forex Blog

Crude prices were seen trading lower on Wednesday, as it heads for a second monthly drop on speculation that crude inventories was at an 83-year high and after crude prices reached the $102 level on Thursday.

The North American West Texas Intermediate (WTI) crude for June delivery edged 0.81% at $100.46 a barrel on the New York Mercantile Exchange at the time of writing. At the same time, futures for the European benchmark Brent crude for June settlement traded $100.82 lower per barrel on the ICE Future Europe exchange.

Crude Supplies

Crude supplies in the US, the world’s biggest oil consumer; rose  2.2 million barrels to 399.9 million in the last week, the highest level since May 1931, reports from the US Energy Information Administration showed.

Reports from the American Petroleum Institute showed that US crude stockpiles at Cushing, Oklahoma, the delivery point for New York futures, climbed by 202,000 barrels last week.

Ukraine

Earlier this week Russia; the biggest energy exporter in the world, was imposed with new sanctions by the US and the European Union as Russian President Vladimir Putin warned that the new sanctions may lead to Russia to reconsider participation with companies in the US and the European Union in the energy sector and other key industries.

Officials from the EU, the US, Russia and Ukraine signed an agreement on April 17 in Geneva to ease tensions in Ukraine; however the agreement has been ignored as tensions between nations escalates.


Visit www.hymarkets.com   to find out more about our products and start trading today with only $50 using the latest trading technology today

The post Crude Prices Extends Losses as Stockpiles Rises appeared first on | HY Markets Official blog.

Article provided by HY Markets Forex Blog
HY MARKETS News: Forex Report: AUD/USD

By HY Markets Forex Blog

AUD/USD is currently trading close to the strong support zone surrounding the support level 0.9250. This support zone is strengthened by the lower support trendline of the daily up channel from January (which has enclosed the preceding primary corrective wave ②), the 38.2% Fibonacci Correction of the earlier upward (C)-wave and 200-day moving average.

If AUD/USD reverses up from this support zone it can be expected to rise to the next buy target at 0.9440. Alternatively, if the pair breaks below 0.9250, it can fall further to 0.9140.

30AprilForex

The post HY MARKETS News: Forex Report: AUD/USD appeared first on | HY Markets Official blog.

Article provided by HY Markets Forex Blog

GBPUSD Forex Trading Pivot Point Levels for 2014.04.30

2014.04.30 12:30 6:30AM ET | GBPUSD Currency Pair

SC GBPUSD 2014.04.30

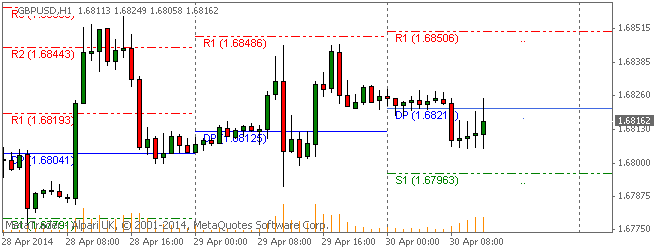
Here are the Pivot Points Levels with Support (S) and Resistance (R) for the GBPUSD currency pair today. Price action is currently trading under the daily pivot point at the 1.68162 price level, according to data at 6:30 AM ET. The GBPUSD high for the day has been 1.68284 while the low of day has reached to 1.68058. The pair earlier today opened the Asian trading session slightly above the daily pivot and has trended lower into the North American morning.

Daily Pivot Point: 1.68210
— S1 – 1.67962
— S2 – 1.67667
— S3 – 1.67419
— R1 – 1.68505
— R2 – 1.68753
— R3 – 1.69048


Weekly Pivot Points: GBPUSD

SC GBPUSD 2014.04.30

Prices are currently trading over the weekly pivot point at time of writing. The GBPUSD has been on an overall modest bullish trend this week after opening the trading week virtually on top of the weekly pivot.

Weekly Pivot Point: 1.67980
— S1 – 1.67575
— S2 – 1.67206
— S3 – 1.66801
— R1 – 1.68349
— R2 – 1.68754
— R3 – 1.69123


By CountingPips.com – Forex Trading Apps & Currency Trade Tools

Disclaimer: Foreign Currency trading and trading on margin carries a high level of risk and volatility and can result in loss of part or all of your investment. All information and opinions contained do not constitute investment advice and accuracy of prices, charts, calculations cannot be guaranteed.


HY MARKETS News: Commodities Report: Light Sweet Crude Oil (WTI)

By HY Markets Forex Blog

WTI is currently approaching the sell target 100.00 that was set in our earlier report for this instrument. The price recently broke the lower support trendline of the wide daily up channel from the start of this year. This was followed by one unsuccessful attempt to break back into this up channel (as you can see below).

The nearest price action close to 100.00 will determine how WTI will move in the coming sessions. If Light Sweet Crude Oil fails to break below 100.00 – it can retest the resistance at 102.00. If WTI breaks below 100.00 – expect it to fall to the next sell target at 97.30.

April30commodities

The post HY MARKETS News: Commodities Report: Light Sweet Crude Oil (WTI) appeared first on | HY Markets Official blog.

Article provided by HY Markets Forex Blog
HY MARKETS News: Index Report: S&P 500

By HY Markets Forex Blog

S&P 500 recently corrected strongly down after nearly reaching the buy target 1900.00 that was set in our previous report for this index. The latest downward correction from this resistance level stopped at the precise level of the 50% Fibonacci Correction of the preceding sharp upward impulse from the start of February.

The subsequent minor upward impulse wave 1 broke above the resistance level 1850.00. The latest minor corrective wave 2 reversed up from 1850.00 (acting as support now). S&P 500 is expected to rise to the nearest buy target 1900.00.


April30index

The post HY MARKETS News: Index Report: S&P 500 appeared first on | HY Markets Official blog.

Article provided by HY Markets Forex Blog
HY MARKETS News: Stocks Report: Apple Inc

By HY Markets Forex Blog

Apple recently rose sharply above the buy target 550.00 that was set in our previous technical analysis report for this company. The breakout of this buy target was preceded by the breakout of the daily down channel which has enclosed the earlier intermediate correction (2).

The breakout of 550.00 coincided with the breakout of the upper resistance trendline of the daily Triangle from December of last year and led to the breakout of the major resistance 570.00 (top of earlier primary wave ①). Apple is set to rise to the next buy target 600.00 – followed by 620.00.


April29stocks

The post HY MARKETS News: Stocks Report: Apple Inc appeared first on | HY Markets Official blog.

Article provided by HY Markets Forex Blog
USDJPY Forex Trading Pivot Point Levels for 2014.04.30

2014.04.30 12:30 6:30AM ET | USDJPY Currency Pair

SC USDJPY 2014.04.30

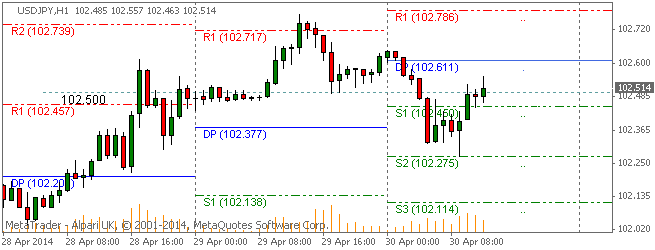
Here are the Pivot Points Levels with Support (S) and Resistance (R) for the USDJPY currency pair today. Price action is currently trading under the daily pivot point at the 102.514 price level, according to data at 6:30 AM ET. The USDJPY high for the day has been 102.646 while the low of day has reached to 102.274. The pair earlier today opened the Asian trading session above the daily pivot and has trended lower today with prices finding support at the S2 support area at 102.27.

Daily Pivot Point: 102.611
— S1 – 102.450
— S2 – 102.275
— S3 – 102.114
— R1 – 102.786
— R2 – 102.947
— R3 – 103.122


Weekly Pivot Points: USDJPY

SC USDJPY 2014.04.30

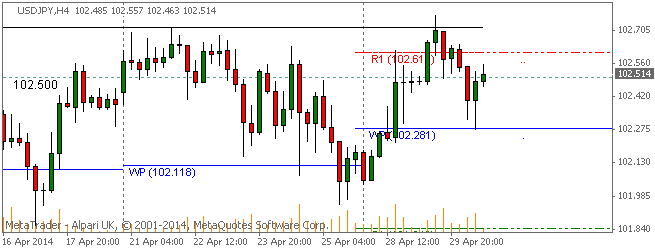
Prices are currently trading over the weekly pivot point at time of writing. The USDJPY has been on an overall bullish trend this week after opening the trading week below the weekly pivot.

Weekly Pivot Point: 102.281
— S1 – 101.845
— S2 – 101.516
— S3 – 101.080
— R1 – 102.610
— R2 – 103.046
— R3 – 103.375


By CountingPips.comForex Trading Apps & Currency Trade Tools

Disclaimer: Foreign Currency trading and trading on margin carries a high level of risk and volatility and can result in loss of part or all of your investment. All information and opinions contained do not constitute investment advice and accuracy of prices, charts, calculations cannot be guaranteed.


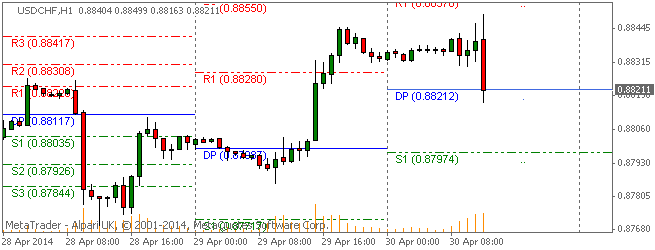
USDCHF Forex Trading Pivot Point Levels for 2014.04.30

2014.04.30 12:30 6:30AM ET | USDCHF Currency Pair

SC USDCHF 2014.04.30

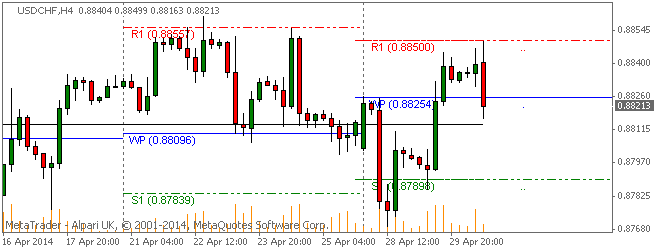
Here are the Pivot Points Levels with Support (S) and Resistance (R) for the USDCHF currency pair today. Price action is currently trading right on the daily pivot point at the 0.88211 price level, according to data at 6:30 AM ET. The USDCHF high for the day has been 0.88499 while the low of day has reached to 0.88163. The pair earlier today opened the Asian trading session above the daily pivot and has trended lower over so far today.

Daily Pivot Point: 0.88212
— S1 – 0.87974
— S2 – 0.87616
— S3 – 0.87378
— R1 – 0.88570
— R2 – 0.88808
— R3 – 0.89166


Weekly Pivot Points: USDCHF

SC USDCHF 2014.04.30

Prices are currently trading under the weekly pivot point at time of writing. The USDCHF has been on an overall slightly bullish trend this week after opening the trading week below the weekly pivot.

Weekly Pivot Point: 0.88254
— S1 – 0.87898
— S2 – 0.87652
— S3 – 0.87296
— R1 – 0.88500
— R2 – 0.88856
— R3 – 0.89102


By CountingPips.com – Forex Trading Apps & Currency Trade Tools

Disclaimer: Foreign Currency trading and trading on margin carries a high level of risk and volatility and can result in loss of part or all of your investment. All information and opinions contained do not constitute investment advice and accuracy of prices, charts, calculations cannot be guaranteed.


Silver Finds Temporary Support; Downside Risk Still Present

Technical Sentiment: Bearish

Key Takeaways

  • Buyers failed to capitalize on the Bullish Engulfing Bar from April 24th;
  • Trend configuration remains bearish ;
  • Fibonacci 61.8% – priced at $19.30 – is the current support level.

Last week Silver tested the support trendline dating back to June 2013 and immediately went on a 97 cents rally, forming a bullish engulfing bar on the daily chart. As traders preferred to take profit rather than follow through with the bullish signal, silver slipped back into a bearish lower low – lower high configuration on the hourly timeframe. If the $19.30 support level holds, buying momentum might pick in the coming sessions.


Technical Analysis

Silver 30th April

The double test of the 61.8% Fibonacci retracement level between $18.93 and $19.90 is a small clue that Silver might have completed the pull-back on last week’s rally. Price remains below the main moving averages on all timeframes, with a bearish trend configuration of lower highs and lower lows trend, consequently there is always risk for more downside.

While the support at $19.30 holds, the first resistance is located around $19.53 (most recent lower high in the short term configuration and the 200 Simple Moving Average on 1H). A rally above $19.53 will open the way towards $19.90, and only on a break above this level will Silver completely switch to a technically bullish trend.

Stochastic is in oversold territory on 1H and 4H, bringing up the possibility that the bearish cycle is complete, yet price action has to confirm the reversal with more bullish bars.

If Silver clears below $19.30 and the previous two lows in the $19.22/24 area, the sell-off will continue in similar fashion towards $18.93 in order to test the major support once again.

*********
Prepared by Alexandru Z., Chief Currency Strategist at Capital Trust Markets


Monthly Wave Analysis for May, 2014 (EUR/USD, GBP/USD, USD/CHF, USD/JPY)

By RoboForex.com

Forecast for May, 2014

EUR USD, “Euro vs US Dollar”

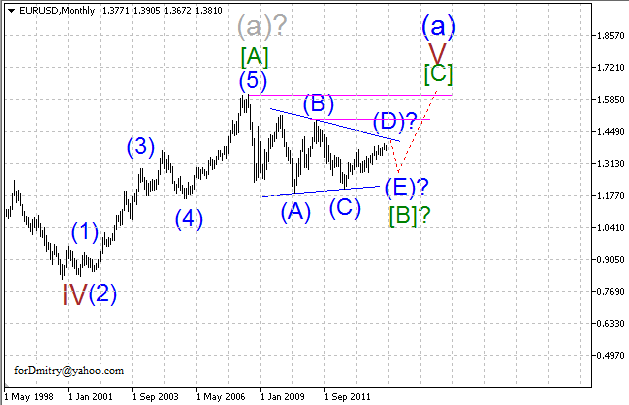
Probably, Euro is still forming a large ascending zigzag [A]-[B]-[C] of V of (a) and is about to finish its correction [B] of V in the form of horizontal running triangle.

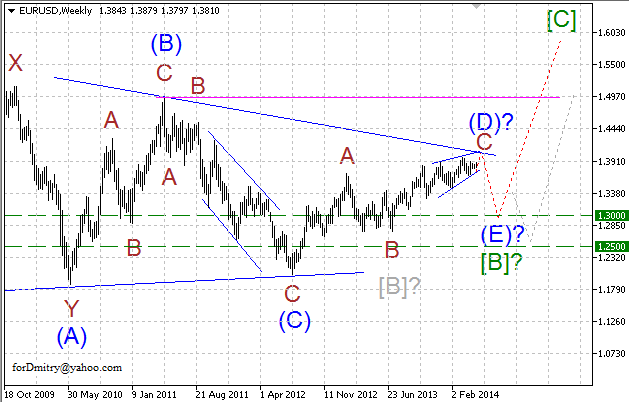
One of the possible scenarios at weekly chart implies that Euro is completing ascending zigzag (D) of [B] of triangle [B]. If this assumption is correct, then later price is expected to start final descending zigzag (E) of [B].

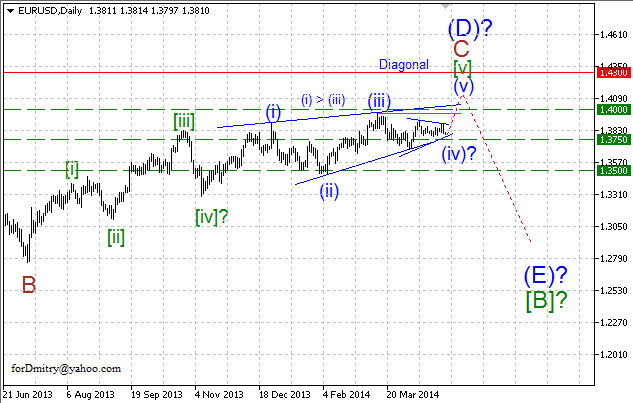
One of the possible scenarios at daily chart implies that price is finishing diagonal triangle [v] of C of (D) of the second “leg” C of [D] of ascending zigzag (D) of [B]. Right now, pair is completing horizontal correction (iv) of [v] of C of (D). Considering that wave (iii) of [v] was shorter than wave (i) of [v], price is expected to complete diagonal triangle [v] of C and make reverse downwards not higher than level of 1.43.

GBP USD, “Great Britain Pound vs US Dollar”

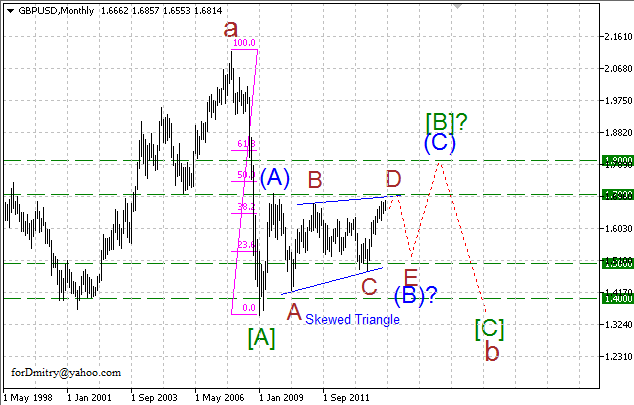
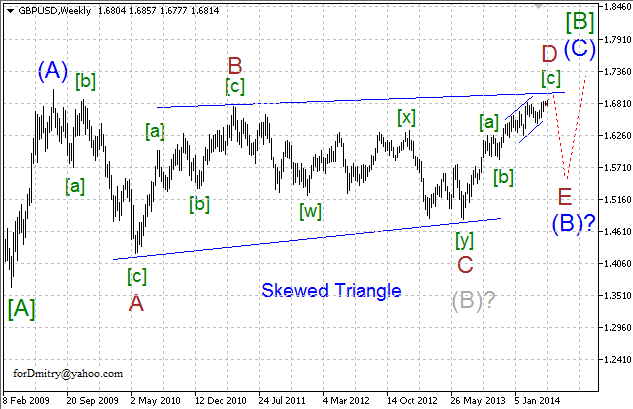
Probably, descending “leg” [A] of b of large zigzag b was completed, and at the moment pair is forming large ascending correction [B] of b, which may take the form of zigzag. Right now, price is completing descending correction (B) of [B] in the form of skewed triangle.

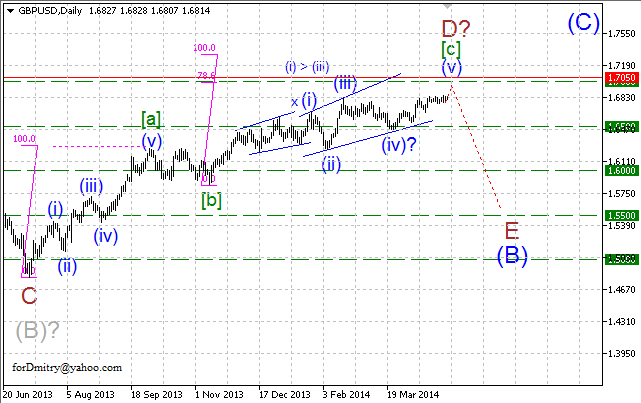
Probably, ascending correction [B] is taking the form of zigzag with skewed triangle (B) of [B] being completed inside it. If this assumption is correct, then right now pair is finishing ascending zigzag D of (B), which may be followed by final descending zigzag E of (B).

Probably, pair is finishing final wedge [c] of D of ascending zigzag D of (B). which may be followed by final descending zigzag E of (B). Considering that wave (iii) of [c] was shorter than wave (i) of [c], price is expected to complete wedge [c] of D and make reverse downwards not higher than level of 1.7050.

USD CHF, “US Dollar vs Swiss Franc”

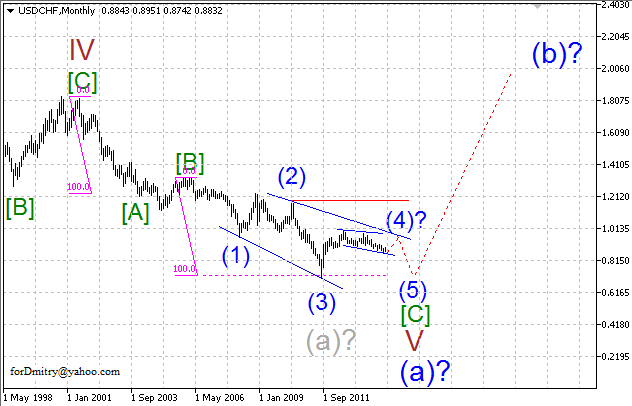
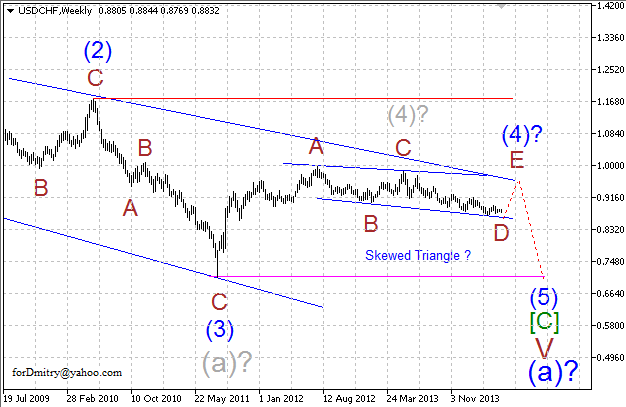
Probably, Swiss Franc is finishing global descending trend in the form of triangle (a). Right now, pair is completing its zigzag [A]-[B]-[C] of V of (a) with diagonal triangle [C] of V of (a) as its second “leg”. It may be confirmed by the fact that internal wave structure of this diagonal triangle looks completely formed.

Probably, right now price is completing ascending correction (4) of [C] in the form of skewed triangle, which may be followed by final descending movement inside zigzag (5) of [C].

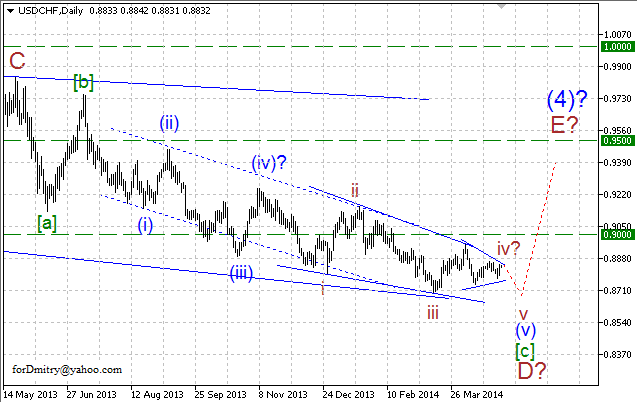
Possibly, pair is finishing diagonal triangle (v) of [c] of D of the second “leg” [c] of D of (4) of descending zigzag D of (4).  If this assumption is confirmed, then later pair is expected to form final ascending zigzag E of (4).

USD JPY, “US Dollar vs Japanese Yen”

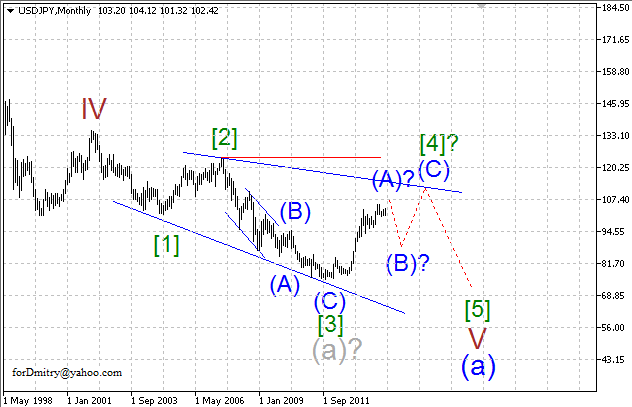
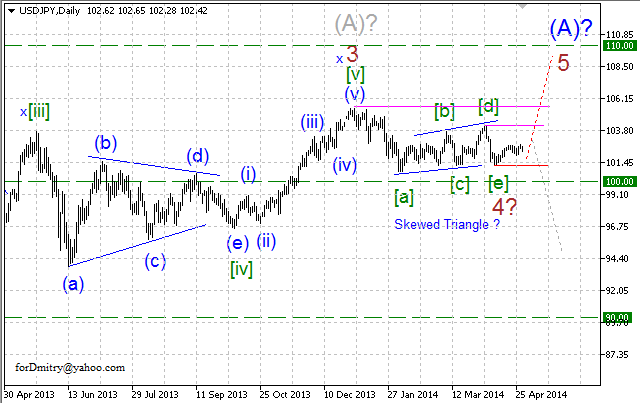
One of the possible scenarios implies that pair is forming final descending diagonal triangle V of (a). Right now, price is forming its ascending correction [4] of V of (a), may be in the form of zigzag.

Probably, ascending correction [4] may take the form of zigzag; price is completing its first “leg” (A) of [4] in the form of impulse.

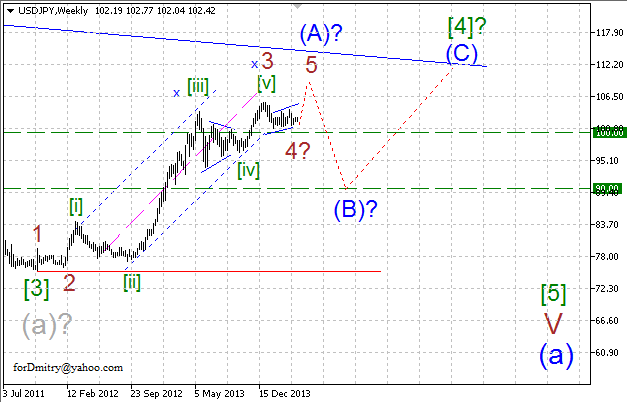
Possibly, descending correction 4 of (A) of ascending impulse (A) was completed in form of skewed triangle. If this assumption is correct, then later pair is expected to make final ascending movement inside wave 5 of (A).

RoboForex Analytical Department

Article By RoboForex.com

Attention!
Forecasts presented in this section only reflect the author’s private opinion and should not be considered as guidance for trading. RoboForex LP bears no responsibility for trading results based on trading recommendations described in these analytical reviews.