Why The Australian Stock Market Can Keep Going Up

By MoneyMorning.com.au

We’ve given you this message for over two years.

We most recently repeated the message at the World War D conference in Melbourne.

What was the message?

It was that you should ignore the fake crises that keep cropping up and instead focus on what’s really important. In this case we’re talking about investing.

And now, one of the world’s most famous legendary investors backs our view. He says the bull market won’t end ‘for a year or two’.

He’s close, but this bull market could last another five years at least…

The legendary investor we’re talking about is Jeremy Grantham. In his latest newsletter Grantham writes:

The bull market may come to an end any time, indeed as I write it may already have happened. It could be derailed by disappointing global growth, profits sagging as deficits are cut, a Russian miscalculation, or, perhaps most dangerous and likely, an extreme Chinese slowdown.

But I believe it probably will not end for at least a year or two and probably not before it reaches a level in excess of 2,250 on the S&P 500.

Today the S&P 500 is at 1,881. If Grantham is right the index would need to rise another 19.1% from this point to reach Grantham’s ‘peak’.

If that happens, it would be good news for our forecast of the Australian Share index hitting 7,000 points early next year. That would be on its way to taking out the 15,000 point mark over the next 3-5 years.

Three reasons stocks can keep going up

Of course, anything can happen.

Just because we say the Australian stock market is going up doesn’t mean it will go up.

And just because legendary investor Jeremy Grantham says the market is likely to go up doesn’t mean it will go up.

Like Grantham, we know there’s a whole bunch of trouble facing the world economy. And we mean real trouble, not the fake kind of trouble the mainstream press bombards you with each day.

But that doesn’t mean we’re prepared to sit on the bench and watch everything happen before us…waiting for the stock crash that could be years from happening.

For instance, despite a background of what many investors perceive as bad news, stocks can still keep going up.

There are two reasons for that. Either the news continues to be better than investors expect, or investors have already taken the bad news into account when making their investment decisions.

After all, if you want a 6% income from an investment and the only place to get that is stocks, then investors will hold their nose and buy the stocks. Naturally, when the bad news arrives they may wish they hadn’t — depending on if they can get out of the market in time.

There is a third reason. It’s that investors just don’t care. They don’t believe the bad news, they don’t know about the bad news, or given what has happened in recent years they assume the government will bail out the market.

We don’t mind warning you, stock market investing is risky. But it’s just as risky not to invest because of the risk of missing out on spectacular gains.

‘Dismal’ returns from stocks? Not so fast…

This is really important to remember. Just because things may look bad today, it doesn’t mean stock prices have to crash today.

Take this quote from Barron’s by famed value investor Seth Klarman:

Our view would be strongly that, on average, the returns from owning stocks are going to be very dismal over the next five or 10 years…

Right on page 150 of the current issue of Barron’s you find that the Dow Jones trailing P/E is now 29.1 times earnings. The dividend yield is 3%, and the market to book is 225%. Those are not the kinds of numbers that seem to me to be a launching pad for a new bull market. Nor the type of numbers that you would usually see when you are in the middle of a biting recession. Even if you looked at the more broad S&P 500, the P/E is approximately 20 and the dividend yield is about the same, the price to book is actually worse – 245%. So we cannot be optimistic about the returns from putting money into the stock market in general here.

Klarman’s interview with Barron’s was on 4th November 1991.

Five years later in November 1996 the S&P 500 and Dow Jones Industrial Average had gained 79.8% and 99.9% respectively. 10 years after the interview in November 2001 the indexes were still up 177.8% and 217.7% respectively.

In short, bad news doesn’t always mean bad news for stocks.

Don’t call this rally over yet

Oh, and if you think things are different today because the main indices have already rallied, then maybe you need to think again.

At the time of Klarman’s interview in November 1991 the US indices had gained over 50% since the big October 1987 stock market crash.

And while it’s fair to say that the US S&P 500 has gained much more than that since the 2009 low (it’s up 175%), the Aussie index has ‘only’ eked out a 73.5% gain.

And even if you had invested in the S&P 500 index in 1996 after it had made a 176% gain over the previous nine years, the index eventually went on to record a 529% from the 1987 crash through to the 2000 peak.

Could history repeat, just over a shorter timeframe?

The disclaimer will tell you that past performance isn’t always a reliable indicator of future performance. But it’s possible. It’s certainly not impossible.

All we’ll say is this: market crashes and rallies have a habit of lasting shorter or longer than you ever expect. Right now most of the so-called commentators and analysts claim this rally is over.

Maybe it is. But we’re prepared to bet that it isn’t. That’s why we’ve pegged the Aussie index to triple from this point over the next 3-5 years.

Cheers,
Kris+

From the Port Phillip Publishing Library

Special Report: Secure and Protect Family Wealth for Generations
Join Money Morning on Google+


By MoneyMorning.com.au

Why Not Everyone Need Fear the ‘Deficit Tax’

By MoneyMorning.com.au

You and I are in the stock market game for one reason. To make money.

Sure, it’s great to enjoy the journey. An education in the markets is its own reward.

But you can’t lose sight of the destination…your investment objective.

You want to finish the ‘game’ with as much money in your pocket as possible to fund your retirement and provide for your family.

That’s why it’s frustrating when a third party disadvantages you by ‘moving the goalposts’.

Well, it looks like that’s about to happen.

In less than two weeks, Australia’s Federal Government will hand down its annual budget.

Unless you spent the past three weeks sailing in the Bahamas without access to the news — in which case, well done! — you’ll know that the government has plans for a bit of budget belt-tightening.

One proposed measure is hogging the headlines. That’s the cleverly-titled ‘deficit levy’.

That’s the new tax that the government plans to impose on everybody with an annual taxable income of more than $80,000.

This tax might not affect you directly. You might be in a phase of your life that lets you escape unscathed.

But if and when this new tax gets the all-clear, it will punish many income earners and investors in their prime investing years.

It means you’ll potentially have to work harder for a comfortable retirement.

Now, there are a few ways you can do that. You could defer retirement for a few extra years. You could cut down on your expenses and moderate your quality of life. Or you can move further out on the risk spectrum and take a closer look at more speculative stocks for higher returns.

Personally, I like the third option best, although it is risky and won’t be suitable for all investors.

The fact is, with the government throttling investors’ take-home pay, a lot of people are going to find it increasingly hard to make ends meet.

That (for better or worse) will drive more demand for the services offered by short term money lenders. You may think that it’s a bit insensitive to talk about turning someone’s higher tax bill and financial hardship into an investment opportunity. But as an investor it’s important to consider the impact of various government policies on specific companies.

Investors do that all the time.

After all, what’s the alternative? That I don’t tell you about these opportunities? If I did that you should rightly be angry at me for failing to do so.

It’s for that reason I’ve recently increased the buy-up-to price on one of the stocks on the Australian Small-Cap Investigator buy list. It’s a company heavily involved in the short-term lending market.

Now, you might not think that these companies will be affected by a new tax on those who earn more than $80,000.

But here’s the reality: more than 30% of the borrowers who use this lender’s service earn more than $50,000 a year.

A percentage of those customers are likely to earn more than $80,000 a year. That means like it or not, the ‘deficit tax’ is likely to drive more business towards short-term lenders.

Add to that, recently this company also announced some exciting results. That makes now an ideal time to think about adding a company like this to your portfolio. You can find out how to get the full story here.

The simple fact is that there are always investing opportunities in the market. It’s just a case of spotting the opportunities and then taking advantage of them – even if sometimes it makes you slightly uncomfortable.

Cheers,
Tim Dohrmann+
Analyst, Australian Small-Cap Investigator

Join Money Morning on Google+


By MoneyMorning.com.au

USD/JPY Forecast For May 5-9

Article by Investazor.com

The week that passed was an undecided one for USDJPY; the quotation had a fluctuating path and closed the week almost at the same level it started. Monday and Tuesday, the bulls took the price around 102.80 so that Wednesday the bears to take control and push it down to 102.00. A better than expected NFP sent USDJPY sky rocketing towards 103.00 and beyond, but at the end of the day the quotation stabilized at 102.22.

On the macroeconomic side, the Japanese economy still sends mixed signals as the Manufacturing PMI and the Preliminary Industrial Production had a worse publication than last month while the Household Spending Indicator beat the expectations with a growth of 7.2%. Regarding BoJ Press Conference, the confidence Bank of Japan officials are showing in achieving their inflation target is lowering the chances of additional monetary easing this year even as the economy weakens.

On American soil we had another 10 billion dollars reduction of the QE program and the Federal Reserve said it will keep reducing the pace of bond purchases as the economy shakes off the winter hiccups, putting the central bank on a course to end the unprecedented stimulus program by the close of 2014.

Economic Calendar

Bank Holiday-Monday

Bank Holiday-Tuesday

Monetary Policy Meeting Minutes (0:50 GMT)-Wednesday. It is a detailed record of the BoJ Policy Board’s meeting that provides in-depth insights into the economic conditions which influenced their decision on where to set interest rates. The frequency is variable, about 14 times per year. A more hawkish tone than expected it is good for the currency.

10-y Bond Auction (4:45 GMT)-Thursday. The average yield on the 10 year bonds that government sell at this auction continued to be on a run. This month it isn’t expected any big change.

Leading Indicators (06:00 GMT)-Friday. It represents a level of a composite index based on 11 economic indicators that is released monthly, about 35 days after the month ends. This index is designed to predict the direction of the economy, but it tends to have a muted impact because most of the indicators used in the calculation are released previously.

Technical View

USDJPY, Daily

Support: 101.90, 101.10

Resistance: 103.00, 104.00

usdjpy-daily-resize-forecast-may-5-9-4.05.2014USDJPY continues the movement from the past 2 weeks and a half between the support level from 102.00 and the resistance line from 103.00, having a fluctuating path.  On the daily chart we still have some potential for a symmetrical triangle. The price had a spike Friday and was rejected from the 103.00 resistance level, failing to touch the superior line of the pattern. The MACD Histogram looks very calm and could be the silence before the storm which could be translated as the sideways movement before the upwards breakout.

USDJPY, H1

Support: 101.90, 101.40

Resistance: 103.00, 104.00

usdjpy-h1-resize-forecast-may-5-9-4.05.2014The price action on the hourly timeframe is a slightly ascending channel bounded by the resistance from 103.00 level and the support from 101.90. Hence, breakouts above or below these levels are crucial on short term and can set the direction for the respective trading session. The MACD Histogram shows us how the bears were unstoppable Friday in the end of the trading day and we could expect Monday to a recovery from the bulls who may push the price up.

Bullish or Bearish

This week is kind of poor in Japanese macroeconomic publications, so I expect that the price action to be driven by what it will happen in the United States and also how the situation from Ukraine it will work out. If the conflict does not get much more acute than it is in this moment, I have a moderately bullish sentiment on USDJPY for the week to come.


The post USD/JPY Forecast For May 5-9 appeared first on investazor.com.

EURUSD: Bear Threats Not Yet Over.

EURUSD: Our bias on EUR continues to point lower while holding below the 1.3905 level. Though closing marginally higher the past week, except it returns above the mentioned level, the risk remains lower. Support lies at the 1.3779 level where a break will aim at the 1.3737 level followed by the 1.3676 level. Further down, support stands at the 1.3600 level where a violation will target the 1.3550 level. Conversely, medium term outlook on EUR remains higher but it will have to recapture the 1.3905 level and 1.3966 level to resume that uptrend. Further out, resistance resides at the 1.4000 level, its big psycho level. All in all, EUR remains biased to the upside in the long term but faces corrective weakness threats.

Article by www.fxtechstrategy.com


Forex COT Speculators decreased US Dollar short bets last week, CAD bets rise

By CountingPips.com

cot-levels

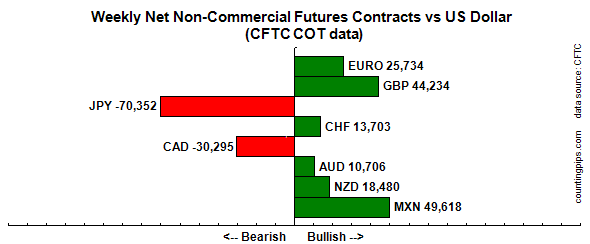
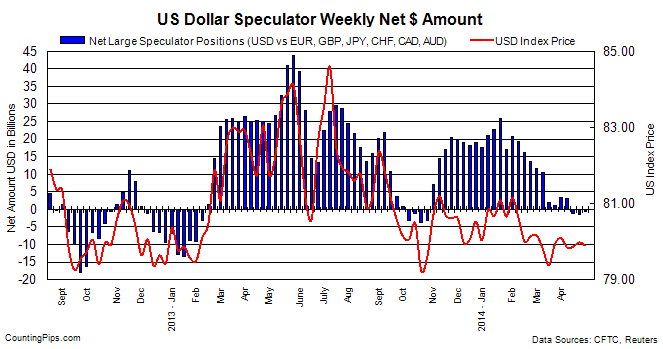
The latest data for the weekly Commitments of Traders (COT) report, released by the Commodity Futures Trading Commission (CFTC) on Friday, showed that large traders and speculators slightly decreased their overall bearish bets of the US dollar last week.

Non-commercial large futures traders, including hedge funds and large International Monetary Market speculators, had an overall US dollar short position totaling -$0.686 billion as of Tuesday April 29th, according to the latest data from the CFTC and calculations by Reuters. This was a weekly change of +$0.894 billion from the -$1.58 billion total short position that was registered on April 22nd, according to Reuters that totals the US dollar contracts against the combined contracts of the euro, British pound, Japanese yen, Australian dollar, Canadian dollar and the Swiss franc.

The USD position has been on the bearish side (slightly) for the past three weeks after having stayed in bullish territory since October 29th with the highest bullish position reached on January 21st with a +$25.89 total position.

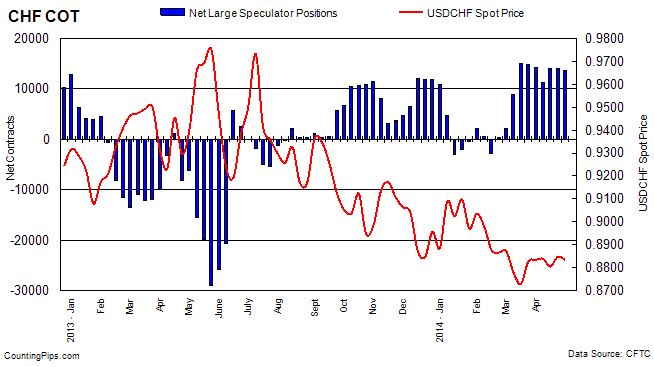
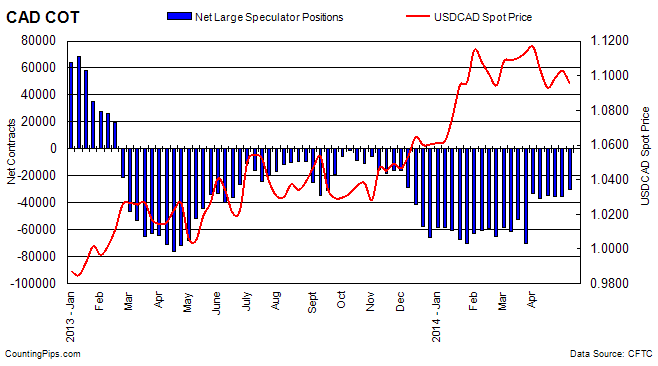
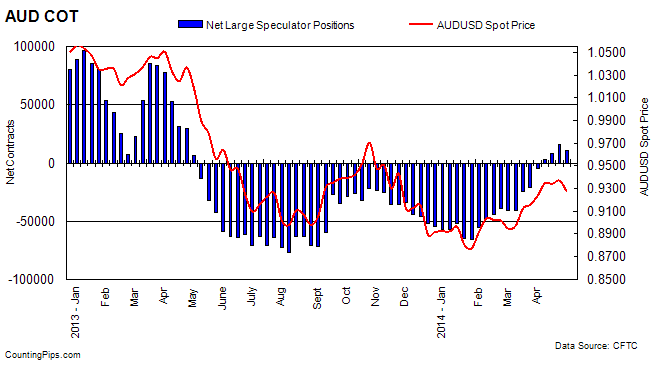
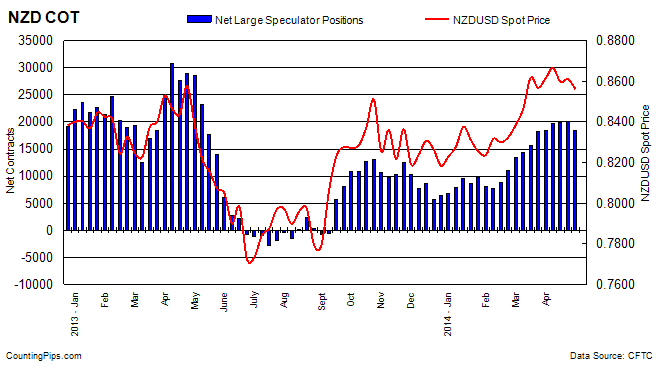
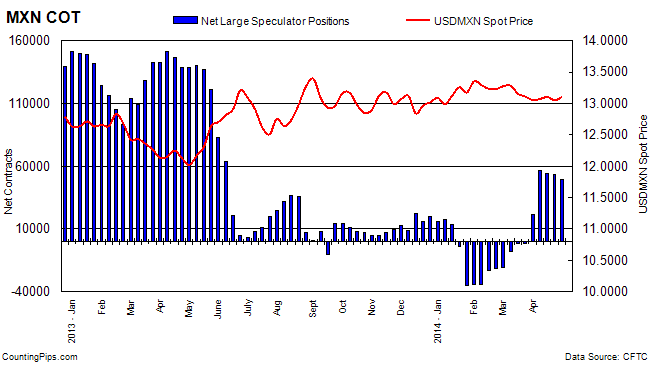
For the week, speculators increased their bets in favor of just the Canadian dollar while there was weekly declines for the euro, Japanese yen, British pound sterling, Swiss franc, Australian dollar, New Zealand dollar and the Mexican peso.


cot-standings

Notable changes:

  • The small Euro decline has pushed Euro positions to fall five out of the last six weeks (same with Swiss franc)
  • British pound sterling positions declined for 2nd week after a string of five straight weekly gains
  • Canadian dollar bearish positions are at their lowest level since November 26th 2013 when bearish net contracts were -28,780
  • Australian dollar net position decline broke a streak of 7 straight weekly advances


* All currency positions are in direct relation to the US dollar where, for example, a bet for the euro is a bet that the euro will rise versus the dollar while a bet against the euro will be a bet that the dollar will gain versus the euro. Please see charts and data below.


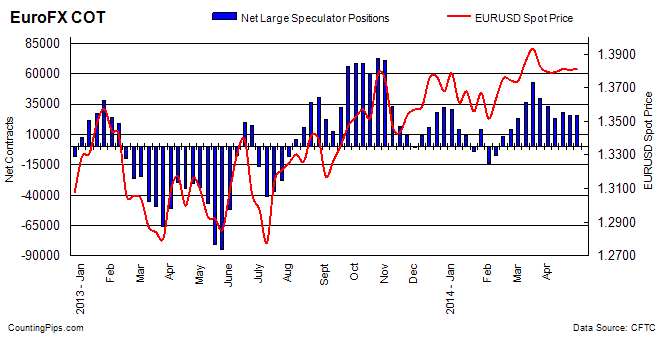
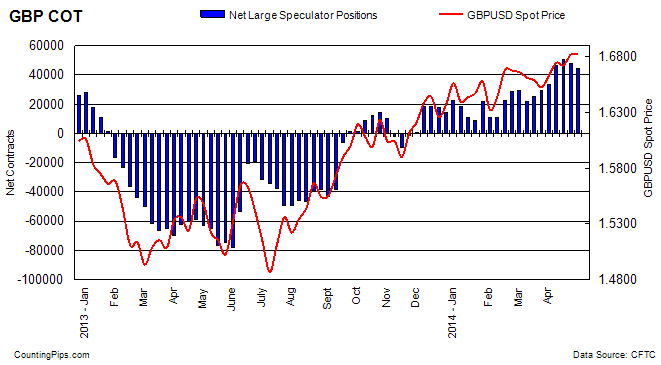
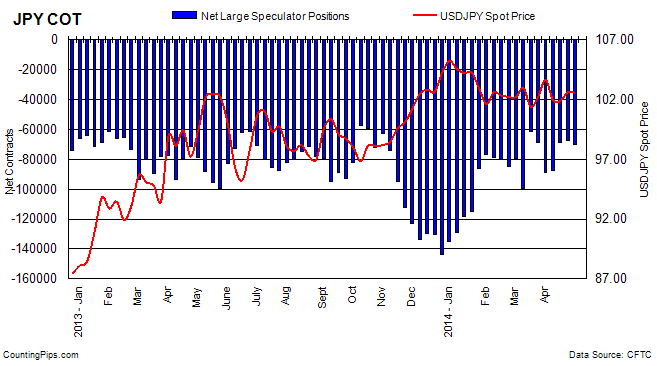
Weekly Charts: Large Speculators Weekly Positions vs Currency Spot Price

EuroFX:

eurofx

Last Six Weeks data for EuroFX futures

DateOpen InterestLong SpecsShort SpecsLarge Specs NetWeekly Change
03/25/20142621791069146728039634-13357
04/01/20142600751018496861133238-6396
04/08/2014261439926356933523300-9938
04/15/201427072210625278564276884388
04/22/20142662591012047543025774-1914
04/29/20142715151022857655125734-40


British Pound Sterling:

gbp

Last Six Weeks data for Pound Sterling futures

DateOpen InterestLong SpecsShort SpecsLarge Specs NetWeekly Change
03/18/20142089616414138605255363537
03/25/20142021156675137027297244188
04/01/20142114377596942397335723848
04/08/201422666791642451654647712905
04/15/20142266888747236874505984121
04/22/2014237055896924189247800-2798
04/29/2014236030859134167944234-3566


Japanese Yen:

jpy

Last Six Weeks data for Yen Futures

DateOpen InterestLong SpecsShort SpecsLarge Specs NetWeekly Change
03/25/20141582801760086487-68887-7788
04/01/201418846422162110800-88638-19751
04/08/201418181413340100802-874621176
04/15/20141648431435183067-6871618746
04/22/20141656741656483807-672431473
04/29/20141688201384684198-70352-3109


Swiss Franc:

chf

Last Six Weeks data for Franc futures

DateOpen InterestLong SpecsShort SpecsLarge Specs NetWeekly Change
03/25/201447353250371021814819-297
04/01/201447228248001056914231-588
04/08/20144475219275794011335-2896
04/15/201448976239059839140662731
04/22/20144688821732770914023-43
04/29/20144742421960825713703-320


Canadian Dollar:

cad

Last Six Weeks data for Canadian dollar futures

DateOpen InterestLong SpecsShort SpecsLarge Specs NetWeekly Change
03/25/20141332464044173656-3321536590
04/01/20141179662754964543-36994-3779
04/08/20141203362870463011-343072687
04/15/20141195252828863714-35426-1119
04/22/20141187072752962984-35455-29
04/29/20141235893009360388-302955160


Australian Dollar:

aud

Last Six Weeks data for Australian dollar futures

DateOpen InterestLong SpecsShort SpecsLarge Specs NetWeekly Change
03/25/2014842322438744914-205273936
04/01/2014939993539840278-488015647
04/08/201496887376303432033108190
04/15/201498933404633236680974787
04/22/20141076964954033170163708273
04/29/2014109934500193931310706-5664


New Zealand Dollar:

nzd

Last Six Weeks data for New Zealand dollar futures

DateOpen InterestLong SpecsShort SpecsLarge Specs NetWeekly Change
03/25/201432748262438030182132462
04/01/20143231325765728518480267
04/08/201432898265216755197661286
04/15/2014331002667168241984781
04/22/20143257926056588120175328
04/29/20142985822979449918480-1695


Mexican Peso:

mxn

Last Six Weeks data for Mexican Peso futures

DateOpen InterestLong SpecsShort SpecsLarge Specs NetWeekly Change
03/25/20141158582276924423-1654-384
04/01/201414527049893281092178423438
04/08/201413033170371138705650134717
04/15/2014131412710381680154237-2264
04/22/2014128932683291481853511-726
04/29/2014128100680731845549618-3893


*COT Report: The weekly commitment of traders report summarizes the total trader positions for open contracts in the futures trading markets. The CFTC categorizes trader positions according to commercial hedgers (traders who use futures contracts for hedging as part of the business), non-commercials (large traders who speculate to realize trading profits) and nonreportable traders (usually small traders/speculators).

The Commitment of Traders report is published every Friday by the Commodity Futures Trading Commission (CFTC) and shows futures positions data that was reported as of the previous Tuesday (3 days behind).

Each currency contract is a quote for that currency directly against the U.S. dollar, a net short amount of contracts means that more speculators are betting that currency to fall against the dollar and a net long position expect that currency to rise versus the dollar.

(The graphs overlay the forex spot closing price of each Tuesday when COT trader positions are reported for each corresponding spot currency pair.)

See more information and explanation on the weekly COT report from the CFTC website.


Article by CountingPips.comForex Apps & News

Gold Speculators added to bullish positions for 2nd week in latest COT data

By CountingPips.com

Weekly CFTC Net Speculator Report

gold

GOLD: Large futures market traders and speculators increased their overall bullish bets in gold futures last week for a second consecutive week, according to the latest Commitment of Traders (COT) data released by the Commodity Futures Trading Commission (CFTC) on Friday.

The non-commercial futures contracts of Comex gold futures, traded by large speculators and hedge funds, totaled a net position of +85,227 contracts in the data reported through April 29th. This was a change of +3,394 contracts from the previous week’s total of +81,833 net contracts on April 22nd.

The gold non-commercial net positions had fallen for four straight weeks through April 15th before turning around with small gains the past two weeks.

Over the weekly reporting time-frame, from Tuesday April 22nd to Tuesday April 29th, the gold price advanced from $1,284.90 to $1,296.20 per ounce, according to gold futures price data from investing.com.


Last 6 Weeks of Large Trader Non-Commercial Positions

DateOpen InterestLong SpecsShort SpecsNet Non-CommercialsWeekly ChangeGold Price
03/25/201439826416908351766117317-194971311.00
04/01/201436345115815258007100145-171721279.60
04/08/20143654001496936109488599-115461310.10
04/15/20143695771474326814079292-93071302.9
04/22/2014372593146880650478183325411284.9
04/29/2014378092147769625428522733941296.2

*COT Report: The weekly commitment of traders report summarizes the total trader positions for open contracts in the futures trading markets. The CFTC categorizes trader positions according to commercial hedgers (traders who use futures contracts for hedging as part of the business), non-commercials (large traders who speculate to realize trading profits) and nonreportable traders (usually small traders/speculators). Find CFTC criteria here: (http://www.cftc.gov/MarketReports/CommitmentsofTraders/ExplanatoryNotes/index.htm).

Article by CountingPips.comForex Trading Apps


VIX Futures Market Speculators raised bearish positions last week to highest level since Feb

By CountingPips.com

Weekly CFTC Net Speculator Report


vix


VIX Futures Contracts: Large traders and speculators added to their overall bearish bets in the VIX futures market last week after a decline the previous week, according to the latest data from the Commodity Futures Trading Commission (CFTC) released on Friday.

The VIX non-commercial futures contracts, comprising of large speculator and hedge fund positions, totaled a net bearish position of -45,486 contracts in the data reported for April 29th. This was a change of -11,429 contracts from the previous week’s total of -34,057 net contracts that was registered on April 22nd.

The increase in bearish positions brings overall net contracts to the highest bearish level since February 4th when net positions stood at a level of -51,230 contracts.

The VIX index over the same reporting time-frame last week edged higher from a 13.19 reading on Tuesday April 22nd to a 13.71 reading on Tuesday April 29th, according to the Chicago Board Options Exchange (CBOE) Volatility Index.


Last 6 Weeks of Large Trader Positions

DateOpen InterestLong SpecsShort SpecsNet Non-CommercialsWeekly ChangeVIX Score
03/25/2014335826109110116314-7204-614114.02
04/01/2014357046114839145412-30573-2336913.10
04/08/2014359952105096136842-31746-117314.89
04/15/201436888796296132242-35946-420015.61
04/22/2014362130106598140655-34057188913.19
04/29/2014365215110843156329-45486-1142913.71

*COT Report: The weekly commitment of traders report summarizes the total trader positions for open contracts in the futures trading markets. The CFTC categorizes trader positions according to commercial hedgers (traders who use futures contracts for hedging as part of the business), non-commercials (large traders who speculate to realize trading profits) and nonreportable traders (usually small traders/speculators). Find CFTC criteria here: (http://www.cftc.gov/MarketReports/CommitmentsofTraders/ExplanatoryNotes/index.htm).


Article by CountingPips.comForex Apps & Analysis


US 10-Year Treasury Note Speculators trim bearish positions for 2nd week

By CountingPips.com

Weekly CFTC Net Speculator Report


10Yr

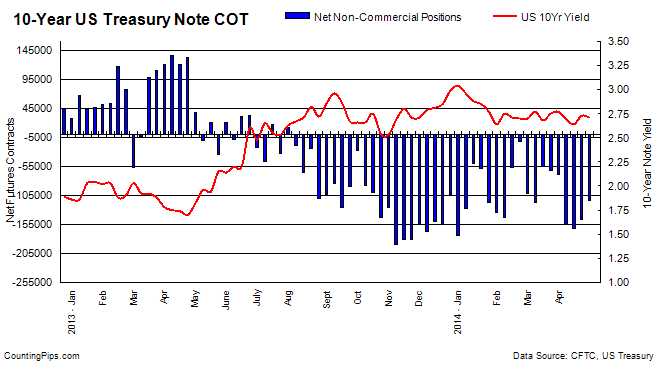
Large Speculators net bearish positions fell to a total of -114,425 contracts

10 Year Treasuries: Large futures market traders and speculators decreased their overall bearish bets in the 10-year treasury note futures for a second straight week last week, according to the latest Commitment of Traders (COT) data released by the Commodity Futures Trading Commission (CFTC) on Friday.

The non-commercial futures contracts of the 10-year treasury notes, primarily traded by large speculators and hedge funds, totaled a net position of -114,425
contracts in the data reported for April 29th. This was a change of +31,440 contracts from the previous week’s total of -145,865 net contracts that was recorded on April 22nd.

The 10-Year Note non-commercial bearish positions have now fallen for two straight weeks and to the lowest level since April 1st when net positions equaled -68,776 contracts.

Over the weekly reporting time-frame, from Tuesday April 22nd to Tuesday April 29th, the yield on the 10-Year treasury note slipped from 2.73 to a yield of 2.71, according to data from the United States Treasury Department.


Last 6 Weeks of Large Trader Non-Commercial Positions

DateOpen InterestLong SpecsShort SpecsNet Large SpecsWeekly Change10 Year Yield
03/25/20142490662333722395487-61765-67512.75
04/01/20142503964346901415677-68776-70112.77
04/08/20142572114327159482333-155174-863982.69
04/15/20142497347344056506334-162278-71042.64
04/22/20142493544349474495339-145865164132.73
04/29/20142528687332918447343-114425314402.71


*COT Report: The weekly commitment of traders report summarizes the total trader positions for open contracts in the futures trading markets. The CFTC categorizes trader positions according to commercial hedgers (traders who use futures contracts for hedging as part of the business), non-commercials (large traders who speculate to realize trading profits) and nonreportable traders (usually small traders/speculators). Find CFTC criteria here: (http://www.cftc.gov/MarketReports/CommitmentsofTraders/ExplanatoryNotes/index.htm).


Article by CountingPips.comForex Trading Apps


Crude Oil Speculators cut back on bullish positions after 5 weeks of gains

By CountingPips.com

Weekly CFTC Net Speculator Report

CrudeOil

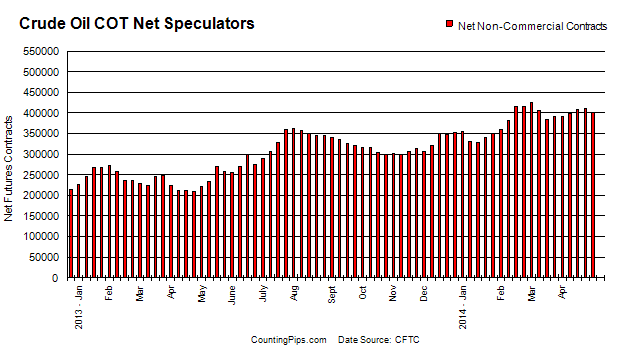
CRUDE OIL: Large futures market traders and speculators decreased their overall bullish bets in crude oil futures for the first time in six weeks last week, according to the latest Commitment of Traders (COT) data released by the Commodity Futures Trading Commission (CFTC) on Friday.

The non-commercial contracts of crude oil futures, primarily traded by large speculators and hedge funds, fell to a total net position of +402,327 contracts in the data reported for April 29th. This was a change of -7,798 contracts for the week. The previous week had seen a total of +410,125 net contracts in the data through April 22nd.

The decline was the first retreat in bullish positions since March 18th and stopped a string of five weekly advances that brought bullish positions to the highest standing since March 4th (+425,818 net contracts).

Over the same weekly reporting time-frame, from Tuesday April 22nd to Tuesday April 29th, the crude oil price fell from $101.92 to $100.58 per barrel, according to Nymex futures price data from investing.com. Brent crude prices, meanwhile, also showed a decline from $109.44 to $108.86 per barrel from Tuesday April 22nd to Tuesday April 29th, according to prices from investing.com.

Last 6 Weeks of Large Trader Non-Commercial Positions

DateOpen InterestLong SpecsShort SpecsNet Non-CommercialsWeekly ChangeOil Price
03/25/20141604566498080106906391174688999.19
04/01/2014164450750238911060639178360999.61
04/08/201416554725120351122483997878004102.33
04/15/201416742765234901139394095519764103.78
04/22/20141619737517023106898410125574101.92
04/29/20141651521522018119691402327-7798100.58

*COT Report: The weekly commitment of traders report summarizes the total trader positions for open contracts in the futures trading markets. The CFTC categorizes trader positions according to commercial hedgers (traders who use futures contracts for hedging as part of the business), non-commercials (large traders who speculate to realize trading profits) and nonreportable traders (usually small traders/speculators). Find CFTC criteria here: (http://www.cftc.gov/MarketReports/CommitmentsofTraders/ExplanatoryNotes/index.htm).

Article by CountingPips.comForex Trading News


Malawi holds rate, sees inflation down to 16% end-year

By CentralBankNews.info
    Malawi’s central bank maintained its policy rate at 25 percent but signaled it may change the rate in the near future, saying its monetary policy committee “made a deliberate decision to review the policy rate at the next meeting” in order to balance the impact of the ongoing foreign exchange operations and liquidity, and the anticipated fiscal risks.
    The Reserve Bank of Malawi (RBM), which has held its rate steady since December 2012, said measures implemented last year had impacted positively on the inflation outlook and enabled the build up of reserves.
    Malawi’s inflation rate eased to 24 percent in March from 24.6 percent in February and 25.9 percent in January due to a deceleration in both food and non-food prices, the RBM said, adding that inflation is expected to continue to trend downwards and reach about 16 percent in December.
    Malawi’s economy expanded by 6.10 percent in 2013 and the central bank estimated growth at the same 6.1 percent rate this year, with all sectors forecast to grow except for the mining sector.
    Malawi’s central bank has been building up its foreign reserves during the tobacco season to provide it with a buffer against external shocks and allow it to intervene in the foreign exchange market to smooth out volatility in the exchange rate from a highly seasonal pattern of foreign exchange inflows.
    Foreign exchange reserves for the banking system as a whole amounted to US$ 754 million in March, or 3.9 months of imports, up from 3.4 months end-December.
    Malawi’s kwacha currency eased 9.4 percent against the U.S. dollar in 2013 but has firmed this year, trading at 385.7 on Friday, up 10.2 percent since the end of 2013.
    The International Monetary Fund said last month that the RBM’s purchase of foreign exchange was boosting liquidity, complicating the disinflation process and recommended that “the RBM tighten monetary policy more aggressively.”
    The bank said money market liquidity remained high, leading to a reduction in the interbank rate to 8.4 percent in April from 25.2 percent in December, and this calls for an “intensification of monetary operations which could lead to a reversal of both the Treasury bill yields and the interbank rates.”
    Net domestic borrowing fell to K7 billion in the first quarter, but the bank expects this to reserve by the end of June due to uncertainty in donor funding and likely financing pressures in connection with elections.
    “Based on the highlighted pressures, the Committee observed that risks to inflation remain,” the central bank said.

    http://ift.tt/1iP0FNb