HY MARKETS News: Commodities Report: Silver

By HY Markets Forex Blog

Silver recently reversed up sharply from the sell target 19.00 that was set in our earlier report for this instrument. Given the strength of the support level 19.00 (which has earlier reversed the price strongly in last December and in January, February and April of this year, as you can see below) – Silver immediately corrected up from 19.00 – continuing the upward moment from today’s open.

The price just broke the resistance trendline from March and is expected to rise further to the next correction target at 20.50 (upper boundary of the sideways price range from December).

May05commodities

The post HY MARKETS News: Commodities Report: Silver appeared first on | HY Markets Official blog.

Article provided by HY Markets Forex Blog

HY MARKETS News: Index Report: HANG SENG CHINA ENTERPRISES IND

By HY Markets Forex Blog

HSCE recently fell below the downward correction target 10000.00 what was set in our previous report for this index. The breakout of this round support level accelerated the (C)-wave of the latest intermediate corrective wave (2) from April.

The index is currently trading close to the support level 9750.00. The support zone near this support level is strengthened by 61.8% Fibonacci Correction of the preceding sharp intermediate impulse wave (1). If HSCE breaks below 9750.00 – it can be expected to fall further to the next sell target at 9500.00. Alternately, HSCE might retest the broken support at 10000.00.

May05Index

The post HY MARKETS News:Index Report: HANG SENG CHINA ENTERPRISES IND appeared first on | HY Markets Official blog.

Article provided by HY Markets Forex Blog

HY MARKETS News : Stocks Report:Bank of America Corp

By HY Markets Forex Blog

Bank of America recently fell strongly inside the intermediate ABC correction (4) from March. The (C)-wave of this ABC correction stopped at the strong support level 15.00 (former strong resistance level which reversed Bank of America down in July of last year, acting as support now after it was broken in last November).

The support area surrounding 15.00 is strengthened by 50% Fibonacci Correction of the upward impulse from last June and the support trendline of the daily down channel from March.Bank of America is set to rise further to the next buy target at 16.00.


May05stocks

The post HY MARKETS News : Stocks Report:Bank of America Corp appeared first on | HY Markets Official blog.

Article provided by HY Markets Forex Blog

The Senior Strategist: The conflict in Ukraine is escalating

The Senior Strategist with his outlook for the week ahead.

Strongest US Job report for more than 2 years. U.S. economy added 288.000 jobs in April.

This week markets might keep an eye with Ukraine, where the conflict is escalating.

Other than that we can look forward to ECB meeting, Ecofin meeting, and on Wednesday Fed Chief Janet Yellen is testifying in Congress.

Legal information

Video courtesy of en.jyskebank.tv


Selling Pressure Pulls EUR/JPY Near Breaking Point

Technical Sentiment: Neutral

Key Takeaways

  • Heavy selling on CNY data miss puts pressure on JPY pairs as well;
  • Euro zone GDP growth and inflation outlook cut by European Commission;
  • EUR/JPY still moves within bullish channel, testing the support area.

The long term landscape still shows EUR/JPY stuck in a large triangle formation, however in the last month the pair has been respecting a tight bullish channel more than anything else. This week, irrespective of the preferred direction, EUR/JPY is bound to trade outside the triangle formation, which in turn will increase volatility and daily moving ranges.


Technical Analysis
EURJPY 5th May
 

EUR/JPY is trading just around 141.50 after testing the support trendline of April’s bullish channel which coincides with the support of the larger triangle formation. The 50-Day and 100-Day Simple Moving Averages offer support between 141.27 and 141.43. On the 4H chart, all major moving averages are close to the support area as well.

On the 4H timeframe, Stochastic is in oversold territory, bringing up the possibility that the current dip might reverse here, allowing EUR/JPY to continue higher within the bullish channel. The first target towards the upside is marked by last week’s highs around 142.40. A rally above 142.70, the resistance represented by two trendlines, will open the way towards 143.45 (April’s high) and 143.77 (top from early March).

The bullish continuation will be invalidated if price drops below 141.27, breaking the bullish channel configuration. Further confirmation towards the downside comes on a cross below 140.96. Once a lower low is formed, the preferred strategies will be selling support breaks and rallies since the short term trend will be bearish. Below 140.96, EUR/JPY will first eye the large psychological level 140.00. The support from February, priced at 139.10, is the secondary target.

*********
Prepared by Alexandru Z., Chief Currency Strategist at Capital Trust Markets


Weekly Forex Pivot Points EURUSD, GBPUSD, USDJPY, USDCHF for 2014.05.05

2014.05.05 12:30 6:30AM ET

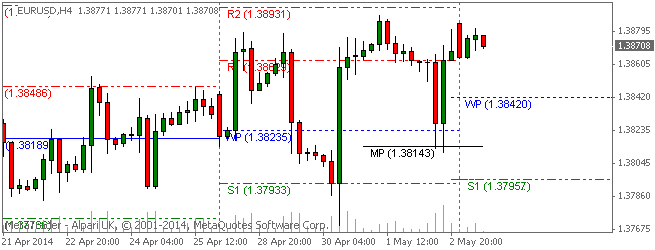
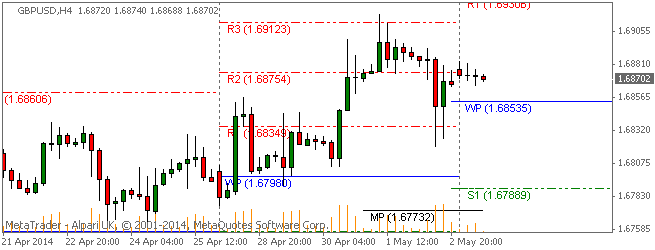
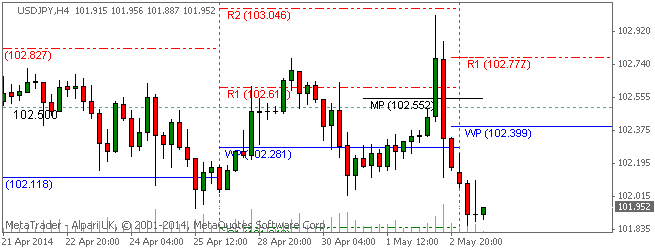
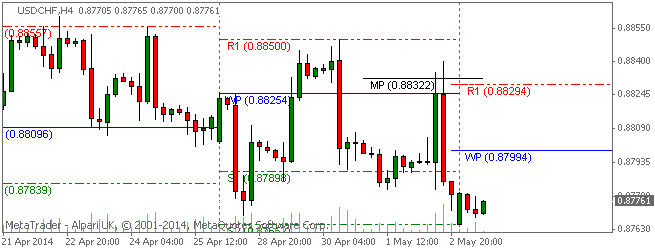
Here are the Weekly Pivot Points Levels with Support (S) and Resistance (R) for the EURUSD, GBPUSD, USDJPY, USDCHF currency pairs.

Weekly Pivot Points: EURUSD

SC EURUSD 2014.05.05

Price action is currently trading over the weekly pivot point at the 1.38708 price level, according to data at 6:30 AM ET. The EURUSD high for the day has been 1.38839 while the low of day has reached to 1.38641.

Weekly Pivot Point: 1.38420
— S1 – 1.37957
— S2 – 1.37233
— S3 – 1.36770
— R1 – 1.39144
— R2 – 1.39607
— R3 – 1.40331


Weekly Pivot Points: GBPUSD

SC GBPUSD 2014.05.05

Prices are currently trading at the 1.68702 price level and over the weekly pivot point to start the week for cable. Today’s GBPUSD high for the day has been 1.68837 while the low of day has reached to 1.68654.

Weekly Pivot Point: 1.68535
— S1 – 1.67890
— S2 – 1.67118
— S3 – 1.66473
— R1 – 1.69307
— R2 – 1.69952
— R3 – 1.70724


Weekly Pivot Points: USDJPY

SC USDJPY 2014.05.05

Price action is currently trading at the 101.952 price level and under the weekly pivot point to begin this week. The USDJPY high for the day has been 102.253 and the low of day has been reached at 101.855.

Weekly Pivot Point: 102.399
— S1 – 101.793
— S2 – 101.414
— S3 – 100.808
— R1 – 102.778
— R2 – 103.384
— R3 – 103.763


Weekly Pivot Points: USDCHF

SC USDCHF 2014.05.05

Price action in the USDCHF is currently trading at the 0.87761 price level and below the weekly pivot point. The USDCHF high for the day has been 0.87800 while the low of day reached to the 0.87653 exchange rate so far.

Weekly Pivot Point: 0.87994
— S1 – 0.87489
— S2 – 0.87189
— S3 – 0.86684
— R1 – 0.88294
— R2 – 0.88799
— R3 – 0.89099


By CountingPips.com – Forex Trading Apps & Currency Trade Tools

Disclaimer: Foreign Currency trading and trading on margin carries a high level of risk and volatility and can result in loss of part or all of your investment. All information and opinions contained do not constitute investment advice and accuracy of prices, charts, calculations cannot be guaranteed.


Wave Analysis 05.05.2014 (DJIA Index, Crude Oil)

Article By RoboForex.com

Analysis for May 5th, 2014

DJIA Index

Probably, Index is forming extension inside wave (3). Earlier, after completing double three pattern inside wave [2], Index formed bullish impulse inside wave (1). During the week, market is expected to reach new historic maximum.

More detailed wave structure is shown on H1 chart. Index finished ascending impulse inside wave 1 and then formed zigzag pattern inside wave (2). In the future, instrument is expected to complete flat pattern inside wave 2 and then start moving upwards inside the third wave.

Crude Oil

Oil continues falling down inside the third wave. Probably, earlier price formed bearish impulse inside wave 1. Most likely, in the nearest future instrument may start falling down again and break previous minimum.

As we can see at the H1 chart, Oil formed two first waves. During the day, price is expected to complete wave (2) and start new descending movement inside the third one. I’m planning to increase my short position as soon as instrument start forming initial descending impulse.

RoboForex Analytical Department

Article By RoboForex.com

Attention!
Forecasts presented in this section only reflect the author’s private opinion and should not be considered as guidance for trading. RoboForex LP bears no responsibility for trading results based on trading recommendations described in these analytical reviews.


Forex Technical Analysis 05.05.2014 (EUR/USD, GBP/USD, USD/CHF, USD/JPY, AUD/USD, USD/RUB, GOLD)

Article By RoboForex.com

Analysis for May 5th, 2014

EUR USD, “Euro vs US Dollar”

Euro is still moving close to upper border of divergent triangle pattern. We think, today price may continue moving upwards towards target at level of 1.3990. Later, in our opinion, instrument may return to level of 1.3890 and then move upwards again to level of 1.4100.

GBP USD, “Great Britain Pound vs US Dollar”

Pound started forming descending structure, which may be considered as correction. We think, today price may grow up to reach new maximum, consolidate for a while near it, and then form reversal pattern. Later, in our opinion, instrument may start new correction towards level of 1.6690.

USD CHF, “US Dollar vs Swiss Franc”

Franc is still moving downwards. We think, today price may fall down to reach level of 0.8700. Later, in our opinion, instrument may return to level of 0.8780 and then continue falling down towards level of 0.8630.

USD JPY, “US Dollar vs Japanese Yen”

Yen is falling down; market is forming another descending wave with target at level of 100.00. We think, today price may reach level of 101.00, return to level of 102.10, and then continue moving downwards to reach main target.

AUD USD, “Australian Dollar vs US Dollar”

Australian Dollar broke its consolidation channel downwards and tested it from below. We think, today price may continue moving downwards to reach level of 0.9080.

USD RUB, “US Dollar vs Russian Ruble”

Ruble wasn’t traded due to the holidays in Russia. After market opening, pair is expected to continue consolidating inside triangle pattern. Main scenario implies that price may continue falling down with target at level of 34.80. Later, in our opinion, instrument may start new ascending movement towards level of 37.50.

XAU USD, “Gold vs US Dollar”

Gold is still forming ascending impulse. We think, today price may continue growing up to reach level of 1340. Later, in our opinion, instrument may fall down towards level of 13010 and then start new ascending movement to reach level of 1350.

RoboForex Analytical Department

Article By RoboForex.com

Attention!
Forecasts presented in this section only reflect the author’s private opinion and should not be considered as guidance for trading. RoboForex LP bears no responsibility for trading results based on trading recommendations described in these analytical reviews.


FireEye Earnings Surprise in T-Minus 35 Hours

By WallStreetDaily.com FireEye Earnings Surprise Hits in T-Minus 35 Hours

With the recent pullback in the tech sector, this is your opportunity to scoop up strong industry leaders at insane bargains…

And one of the most compelling growth industries in the market today is data security.

Cyber attacks are increasing in regularity – and ferocity.

As Chief Political Analyst, Floyd Brown, mentioned in an interview on Friday, Target (TGT) and Neimen Marcus experienced massive data breaches last year. And recent reports show that cyber criminals were able to steal more than $300 million in Bitcoins from the now-defunct Mt. Gox Bitcoin exchange.

And these attacks result in severe collateral damage…

The attack on Niemen Marcus left 1.1 million customer credit cards vulnerable. Since then, 2,400 cards were used fraudulently… After the cyber barrage on Target, the company’s CIO was forced to resign… And the Mt. Gox debacle nearly sent the entire Bitcoin market in a death spiral.

Indeed, with the costs of cyber attacks on the rise, it’s absolutely vital that companies maintain strict cyber-security initiatives.

In other words, the market for cyber-security companies is only going to grow over the coming years.

Especially, considering the chilling statistic below…

Cyber Criminals Can Remain Invisible for Days

Traditional cyber-security products can scan a computer for viruses or protect against intrusions. But once a hacker has already found a way in, it’s much more difficult for most programs to detect the invasion.

That means hackers often sneak around in a company’s network for a while – completely unnoticed – before actually launching their attack.

Creepy, right?

They don’t just hang around for a few hours, either. According to Mandiant’s M-Trends report, in 2013, the median amount of time that attackers hung around in a victim’s network before being discovered was 229 days.

Luckily, one company has found a way to not only protect against initial intrusions, but also detect when a cyber thief makes it past a network’s defenses…

Preparing for a Major Share Price Explosion

If a hacker is snooping around on the network at any time, FireEye’s (FEYE) defense technology will spot it immediately.

It scans a network for unusual traffic, such as the IP address from a printer moving credit card information to a hidden part of the network.

So with FireEye’s software, companies can avoid the scenario described above.

Its advanced ability to spot malicious intrusions actually garnered some media attention recently, since FireEye was responsible for identifying the bug inside Microsoft’s (MSFT) Internet Explorer web browser.

Now, the company’s share price has been beaten down recently – with the stock dropping roughly 50% over the last few weeks.

What’s the problem?

Well, expectations for the company have been very high. But with the recent pullback in the tech sector – and the fact that FireEye is a young company that’s operating in the red – investors are selling off shares to reduce risk.

Rest assured, however, that’s the only reason that the shares have fallen so drastically.

When FireEye reports earnings tomorrow, I expect shares to blast higher, once again.

Fundamentals are likely to improve this quarter, as the integration of FireEye and its subsidiary, Mandiant, promises to increase revenue – with the sales teams for both companies now cross-selling each firm’s products.

Beyond growth, administrative costs will shrink as the two organizations combine – which will help improve profitability.

Bottom line: FireEye is the leader in a stable and growing industry. It benefits from a unique product, accelerating growth, improving profitability – along with a super-cheap share price.

I recommend that you act now before the earnings surprise hits tomorrow.

Good investing,

Tom Anderson

The post FireEye Earnings Surprise in T-Minus 35 Hours appeared first on Wall Street Daily.

Article By WallStreetDaily.com

Original Article: FireEye Earnings Surprise in T-Minus 35 Hours

Monetary Policy Week in Review – Apr 28-May 2, 2014: 2 central banks cut, but news reinforces hawkish trend

By CentralBankNews.info
    The central banks of Hungary and Azerbaijan cut interest rates last week but the trend toward tighter global monetary policy was reinforced by positive economic news and a growing sense of the need for major central banks to pull back from ultra-easy policy.
    The shift in tone was most glaring in the euro zone where news of a tick-up in April inflation to 0.7 percent from 0.5 percent reduced the chances of the European Central Bank embarking on extraordinary measures, a surprisingly sharp turnaround from the previous week when it seemed almost certain that the ECB would spring into action to fend off the threat of deflation.
    In the United States, a surprisingly strong jobs report that included a drop in the April unemployment rate to 6.3 percent, immediately caused traders to advance their rate rise expectations by six weeks to June 2015.
    And in the U.K. there were fresh warnings by two members of the Bank of England’s monetary policy committee of the risk of rising property prices and the risk of raising rates too late, illustrating just how the public debate has shifted toward the timing of a rate rise and away from the need to keep policy accommodative to boost the sluggish economy.
    And even in Japan, where any policy tightening is far off in the horizon, the confirmation that members of the Bank of Japan’s policy board in their latest outlook forecast rising inflation led to a decline in the chances of additional monetary easing this year.
    The Bank of Albania, which has maintained its rate since February after slashing it by 250 basis points since October 2011, summed up the positive mood, describing 2014 as a possible “turning point for economic activity.”
   
    Through the first 18 weeks of this year, central banks have now raised and cut their policy rates by the same number of times, a sign that the days of easier monetary policy are behind us but the trend toward tighter policy is still in its infancy.
    Rates have now been raised 17 times and cut 17 times by the 90 central banks followed by Central Bank News.

   LIST OF LAST WEEK’S CENTRAL BANK DECISIONS:

    TABLE WITH LAST WEEK’S MONETARY POLICY DECISIONS:

COUNTRYMSCI     NEW RATE           OLD RATE        1 YEAR AGO
ISRAELDM 0.75%0.75%1.75%
ANGOLA9.25%9.25%10.00%
EGYPT EM8.25%8.25%9.75%
MAURITIUSFM4.65%4.65%4.90%
HUNGARYEM2.50%2.60%4.75%
UNITED STATESDM 0.25%0.25%0.25%
JAPANDM                  N/A                 N/A                 N/A
ALBANIA 2.75%2.75%3.75%
KENYAFM8.50%8.50%9.50%
AZERBAIJAN4.25%4.75%4.75%
UZBEKISTAN10.00%10.00%12.00%
UGANDA11.50%11.50%12.00%
MALAWI25.00%25.00%25.00%
    
    This week (Week 19) 15 central banks will be deciding on monetary policy, including Australia, Romania, Poland, the Czech Republic, Georgia, the Euro Area, Serbia, the United Kingdom, Norway, the Philippines, Malaysia, Indonesia, Peru, Zambia and South Korea.
    In addition, on May 6 the OECD releases its latest economic outlook in Paris.
TABLE WITH THIS WEEK’S MONETARY POLICY DECISIONS:

COUNTRYMSCI             DATE CURRENT  RATE        1 YEAR AGO
AUSTRALIADM6-May2.50%2.75%
ROMANIAFM6-May3.50%5.25%
POLANDEM7-May2.50%3.00%
CZECH REPUBLICEM7-May0.05%0.05%
GEORGIA7-May4.00%4.25%
EURO AREADM8-May0.25%0.50%
SERBIAFM8-May9.50%11.25%
UNITED KINGDOMDM8-May0.50%0.50%
NORWAYDM8-May1.50%1.50%
PHILIPPINESEM8-May3.50%3.50%
MALAYSIAEM8-May3.00%3.00%
INDONESIAEM8-May7.50%5.75%
PERUEM8-May4.00%4.25%
ZAMBIA9-May12.00%9.25%
SOUTH KOREAEM9-May2.50%2.50%