Stocks Markets Report 7th May

By HY Markets Forex Blog

Stocks – Asia

Stocks in the Asian region were seen trading lower on Wednesday, falling to a seven-week low as shares in Japan were dropping due to the stronger yen while investors raise concerns over the Chinese economy slowdown deepening.

In Japan, the benchmark Nikkei 225 index slid 2.93% lower closing the session at 14,033.45 points, while Tokyo’s broader Topix index lost 2.58% ending at 1,152.01points as the nation’s yen traded at 101.51 against the dollar, after rising to a the highest in three weeks on Tuesday.  Members of the Bank of Japan concluded to keep easing monetary policy until the inflation rate remains steady at 2%, according to minutes from the April 7-8 policy meeting.

Hong Kong’s Hang Seng Index fell 1.3% lower at the time of writing, while the Shanghai Composite Index lost 0.88% to 2,010.22 as the key Chinese manufacturing gauge contracted for the fourth month in a row, raising concerns that the world’s second largest economy’s slowdown is deepening.

HSBC’s Purchasing Managers’ Index (PMI) for April came in at 48.1 from 48.3, coming in lower than analysts forecast of 48.4. Readings below 50 indicates contraction, while China’s services Purchasing Managers’ Index (PMI) for April fell to 51.4 points from 51.9 seen in March, according to reports from HSBC.

Exports in Japan saw the most losses due to the stronger yen. Yaskawa Electric lost 5.80%, while the Japanese electronics company, Panasonic slid by 3.4%. Softbank, which is a major stakeholder in Alibaba, fell by 4.39% after the e-commerce company filed for an US initial public offering.

Stocks -Europe

European stocks opened lower on Wednesday, falling for a fourth day as investors continue to weigh on the ongoing escalated tensions in Ukraine.

The European Euro Stoxx 50 lost 0.57% starting at 3,131.78, while German’s DAX index slid 0.45% opening at 9,425.11 at the time of writing. At the same time the French CAC 40 gave up 0.44% to 4,408.47 as the UK benchmark FTSE 100 edged 0.34% lower to 6,775.31.

In other news, investors will be focusing on the Federal Reserve Chair Janet Yellen speech, which she will be delivering before the Joint Economic Committee of Congress in Washington.

Ukraine

Ukraine received its first cut of $3.2 billion of the financial aid from the International Monetary Fund (IMF) on Wednesday. The first cut is from the $17 billion two year financial aid that was agreed by the IMF in March.

Meanwhile the German Chancellor Angela Merkel and US President Barack Obama have set May 25 to vote on whether to impose more sanctions against Russia if the country fails to withdraw its support for separatists.

Australia

Sydney’s benchmark S&P/ASX 200 index fell 0.83% lower, ending the session at 5,435.80 points as retail sales in Australia rose 0.1% higher in March, but was still below analysts’ estimates of a 0.4% rise, reports from the Australian Bureau of Statistics showed.


Visit www.hymarkets.com   to find out more about our products and start trading today with only $50 using the latest trading technology today

The post Stocks Markets Report 7th May appeared first on | HY Markets Official blog.

Article provided by HY Markets Forex Blog
Crude Futures Rise as US Stockpiles Drop

By HY Markets Forex Blog

Futures for crude climbed during the Asian trading session on Wednesday, rising for a second day after the weekly industry report from the American Petroleum Institute (API) showed that crude stockpiles in the US unexpectedly dropped in the last week.

Futures for the North American West Texas Intermediate (WTI) for June delivery increased by 0.62% to $100.12 a barrel on the New York Mercantile Exchange at the time of writing. While the European Brent crude gained 0.22% higher to %107.29 a barrel on the ICE Futures Europe exchange at the same time.

US Crude Supplies

Reports from the industry-fund American Petroleum Institute (API) showed that crude inventories in the US fell by 1.8 million barrels to 389.8 million in the week ending May2. Analysts were expecting to see a rise of 1.4 million barrels.

The US Energy Information Administration (EIA) is expected to release a report later in the day and expected to show a rise in supplies by 1.25 million barrels in the last week to approximately 400.6 million, according to market analysts’.

Ukraine

Over the weekend, the crises in Ukraine escalated, as Ukraine’s Interior Ministry forces were sent to drive out militants and release hostages, according to Minister Arsen Avakov.  The crises in Odessa left 46 dead.

Oil traders are concerned after Russia said it will reduce its natural gas supplies to Ukraine in June if there is no payment received this month, which could also weigh on the energy supplies to the European Union.


Visit www.hymarkets.com   to find out more about our products and start trading today with only $50 using the latest trading technology today

The post Crude Futures Rise as US Stockpiles Drop appeared first on | HY Markets Official blog.

Article provided by HY Markets Forex Blog
Czech holds rate, confirms use of FX intervention

By CentralBankNews.info
    The central bank of the Czech Republic kept its benchmark two-week repo rate at 0.05 percent, as expected, and confirmed its commitment “to intervene on the foreign exchange market to weaken the koruna so that the exchange rate of the koruna against the euro is kept close to CZK 27/eur.”
    The Czech National Bank (CNB) began using the exchange rate as an additional tool to ease monetary conditions to avoid deflation in November last year, 12 months after it cut the repo rate to the current level. The CNB has committed itself to defend the limit on the koruna until at least 2015.
    Inflation in March in the Czech Republic was steady for the third month in a row at 0.2 percent, well below the CNB’s target of 2.0 percent, plus/minus one percentage point. In its inflation report from February, the CNB forecasts CPI of 2.1 percent this year and 2.2 percent in 2015.
    Since the decision to weaken the koruna’s exchange rate on Nov. 7, 2013, the koruna currency has been steady around 27 to the euro, trading at 27.42 today compared with 27.33 end 2013.
    Gross Domestic Product in the Czech Republic jumped by 0.8 percent in the fourth quarter from the third, the third quarter in a row with expanding activity. On a year-on-year basis, GDP grew by 1.2 percent, the first quarter of growth since the fourth quarter of 2011.
    The CNB forecasts 2014 growth of 2.4 percent, up from a contraction of 0.9 percent in 2013, rising to 2.8 percent in 2015.

    http://ift.tt/1iP0FNb

HY MARKETS News: Forex Report: EUR/USD

By HY Markets Forex Blog

EUR/USD recently broke above the resistance level 1.3900 which is the first of the two buy targets that were set in our earlier report for this currency pair (1.3900 and 1.3970).  The breakout of this buy target was preceded by the reversal from the support zone surrounding the support level 1.3800 (highlighted on the daily EUR/USD chart below).

The latest upward impulse wave 3 from this support zone broke the daily Triangle from March – which accelerated the upward movement. EUR/USD is set to rise further to the next buy target 1.3970 – followed by 1.4000.

May07index

The post HY MARKETS News: Forex Report: EUR/USD appeared first on | HY Markets Official blog.

Article provided by HY Markets Forex Blog
HY MARKETS News: Commodities Report:Copper

By HY Markets Forex Blog

Copper recently reversed down from the resistance level 3.1000. The resistance zone near 3.1000 was strengthened by the resistance trendline from December, the upper daily Bollinger Band, 50% Fibonacci Correction of the preceding downward impulse from the end of primary wave ②and the upper channel line of the daily up channel from March.

The reversal from 3.1000 completed the previous intermediate wave (2).  Copper is expected to break the aforementioned up channel and then to fall to the next sell targets – 3.000 and 2.9700.

May07commodities

The post HY MARKETS News: Commodities Report:Copper appeared first on | HY Markets Official blog.

Article provided by HY Markets Forex Blog
HY MARKETS News: Index Report:S&P 100

By HY Markets Forex Blog

S&P 100 recently corrected down strongly after reaching the buy target 838.00 that was set in our earlier technical analysis report for this index. The resistance zone near the resistance level 838.00 (which previously created the top of the earlier intermediate impulse wave (1) at the start of April) formed the top of the latest minor impulse wave 1 of the currently active 3rd intermediate impulse (3).

S&P 100 might correct further down to the next correction target at 822.00 (low of the earlier minor correction 2). If S&P 100 breaks below 822.00 – it can fall further to 810.00.

May07Forex

The post HY MARKETS News: Index Report:S&P 100 appeared first on | HY Markets Official blog.

Article provided by HY Markets Forex Blog
HY MARKETS News : Stocks Report: Apple Inc

By HY Markets Forex Blog

Apple recently reached the buy target 600.00 that was set in our previous report for this company.  The price has been rising strongly in the last few trading sessions – following the earlier breakout of the extended daily Triangle from December of last year.

The price just reversed down from 600.00 and might correct down for some time – before resuming the currently active 3rd intermediate impulse wave (3). Next buy targets stand at 620.00 and 640.00 (the height of the broken Triangle projected from the level of the breakout).


May07stocks

The post HY MARKETS News : Stocks Report: Apple Inc appeared first on | HY Markets Official blog.

Article provided by HY Markets Forex Blog
USDJPY Forex Trading Pivot Point Levels for 2014.05.07

2014.05.07 12:30 6:30AM ET | USDJPY Currency Pair

SC USDJPY 2014.05.07

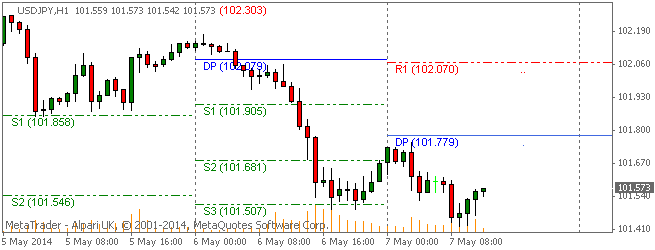
Here are the Pivot Points Levels with Support (S) and Resistance (R) for the USDJPY currency pair today. Price action is currently trading below the daily pivot point at the 101.573 price level, according to data at 6:30 AM ET. The USDJPY high for the day has been 101.755 while the low of day has reached to 101.422. The pair earlier today opened the Asian trading session below the daily pivot and has trended lower into the North American morning session.

Daily Pivot Point: 101.779
— S1 – 101.379
— S2 – 101.088
— S3 – 100.688
— R1 – 102.070
— R2 – 102.470
— R3 – 102.761


Weekly Pivot Points: USDJPY

SC USDJPY 2014.05.07

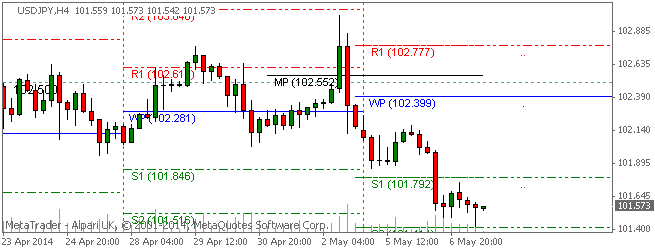
Prices are currently trading under the weekly pivot point and below the S1 support level at time of writing. The USDJPY has been on an overall bearish trend this week after opening the trading week below the weekly pivot.

Weekly Pivot Point: 102.399
— S1 – 101.793
— S2 – 101.414
— S3 – 100.808
— R1 – 102.778
— R2 – 103.384
— R3 – 103.763


By CountingPips.comForex Trading Apps & Currency Trade Tools

Disclaimer: Foreign Currency trading and trading on margin carries a high level of risk and volatility and can result in loss of part or all of your investment. All information and opinions contained do not constitute investment advice and accuracy of prices, charts, calculations cannot be guaranteed.


GBPUSD Forex Trading Pivot Point Levels for 2014.05.07

2014.05.07 12:30 6:30AM ET | GBPUSD Currency Pair

SC GBPUSD 2014.05.07

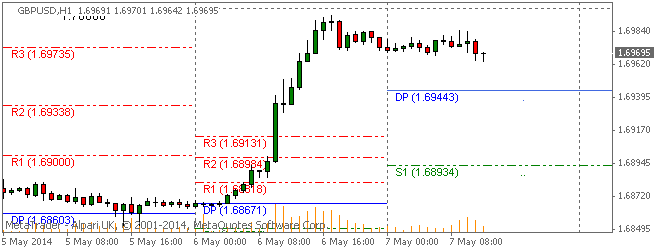
Here are the Pivot Points Levels with Support (S) and Resistance (R) for the GBPUSD currency pair today. Price action is currently trading at the 1.69695 price level and over the daily pivot point, according to data at 6:30 AM ET. The GBPUSD high for the day has been 1.69852 while the low of day has reached to 1.69642. The pair earlier today opened the Asian trading session above the daily pivot and has trended sideways so far today.

Daily Pivot Point: 1.69443
— S1 – 1.68933
— S2 – 1.68136
— S3 – 1.67626
— R1 – 1.70240
— R2 – 1.70750
— R3 – 1.71547


Weekly Pivot Points: GBPUSD

SC GBPUSD 2014.05.07

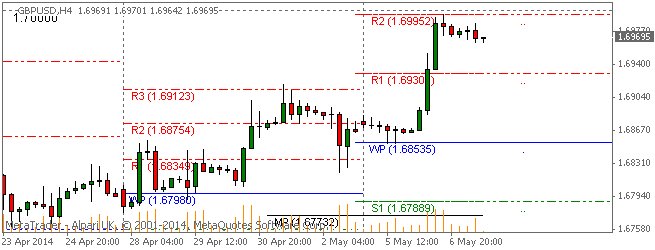
Prices are currently trading over the weekly pivot point and just below the R1 resistance level at time of writing. The GBPUSD has been on an overall bullish trend this week after opening the trading week slightly above the weekly pivot.

Weekly Pivot Point: 1.68535
— S1 – 1.67890
— S2 – 1.67118
— S3 – 1.66473
— R1 – 1.69307
— R2 – 1.69952
— R3 – 1.70724


By CountingPips.com – Forex Trading Apps & Currency Trade Tools

Disclaimer: Foreign Currency trading and trading on margin carries a high level of risk and volatility and can result in loss of part or all of your investment. All information and opinions contained do not constitute investment advice and accuracy of prices, charts, calculations cannot be guaranteed.


USDCHF Forex Trading Pivot Point Levels for 2014.05.07

2014.05.07 12:30 6:30AM ET | USDCHF Currency Pair

SC USDCHF 2014.05.07

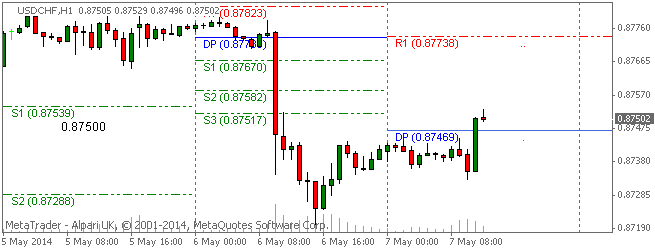
Here are the Pivot Points Levels with Support (S) and Resistance (R) for the USDCHF currency pair today. Price action is currently trading over the daily pivot point at the 0.87502 price level, according to data at 6:30 AM ET. The USDCHF high for the day has been 0.87529 while the low of day has reached to 0.87329. The pair earlier today opened the Asian trading session below the daily pivot and trended sideways before popping higher over daily pivot.

Daily Pivot Point: 0.87469
— S1 – 0.87145
— S2 – 0.86877
— S3 – 0.86553
— R1 – 0.87737
— R2 – 0.88061
— R3 – 0.88329


Weekly Pivot Points: USDCHF

SC USDCHF 2014.05.07

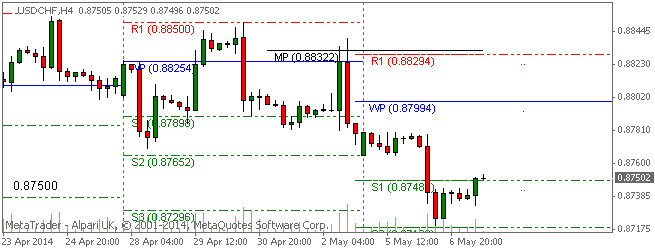
Prices are currently trading under the weekly pivot point at time of writing. The USDCHF has been on an overall bearish trend this week after opening the trading week below the weekly pivot.

Weekly Pivot Point: 0.87994
— S1 – 0.87489
— S2 – 0.87189
— S3 – 0.86684
— R1 – 0.88294
— R2 – 0.88799
— R3 – 0.89099


By CountingPips.comForex Trading Apps & Currency Trade Tools

Disclaimer: Foreign Currency trading and trading on margin carries a high level of risk and volatility and can result in loss of part or all of your investment. All information and opinions contained do not constitute investment advice and accuracy of prices, charts, calculations cannot be guaranteed.