GBPUSD is facing channel support

GBPUSD is facing the support of the lower line of the price channel on 4-hour chart. A clear break below the channel support will confirm that the uptrend from 1.6465 (Mar 24 low) had completed at 1.6996 already, then the following downward movement could bring price back to 1.6600 area. On the upside, as long as the channel support holds, the fall from 1.6996 would possibly be consolidation of the uptrend, and one more rise to 1.7200 area is still possible.

gbpusd

Provided by ForexCycle.com

Why Resource Stocks are a Great Investment Opportunity

By MoneyMorning.com.au

How many Ben?

You won’t like it.

Go on, just tell me.

Five. Five new people joined up.

Hmmm. I guess it would be an understatement to say we didn’t do a good enough job of convincing them that now was a good time to buy resource stocks!

And who can blame anyone for being sceptical about resource stocks? The S&P/ASX 200 Metal & Mining index is still 46.2% below the 2008 high.

But couldn’t it go even lower if China’s growth stalls? It could, but we wouldn’t bet on that happening. Because this could also be the single biggest opportunity to buy into resource stocks since late 2008…

Not everyone likes our advertising material.

For some reason some people don’t like a plain English document that lays out in detail everything about a particular stock or investment opportunity (except the stock name), the risks of the opportunity, the cost of the service, and even our upfront pledge to provide a 30-day money back guarantee.

That last point seems to attract the most anger from some readers. Don’t ask why, because we don’t know.

But all up, it seems that most people prefer cryptic or opaque advertising, or glossy magazine advertising. The kind with small print or no print. The kind where you need to refer to a 100-page legal document where there’s still no chance of finding out the full terms and conditions.

Even so, when only five people respond to one of our advertising emails, it tells us there’s something wrong. Either the idea is wrong, or we haven’t properly highlighted the huge potential in resource stocks. We think it’s the latter.

Maybe we can go one step further today to convince you of the scale of this opportunity…

The demand for resources won’t stop tomorrow

The past six years have been brutal for Australian resource stocks.

There was a small ray of sunshine from 2009 to 2010 when stocks rebounded as stimulus programs worldwide kicked into effect.

But as with all stimulus programs, the benefits were short-lived. Stimulus simply brings forward future revenue and spending, it doesn’t actually add to revenue and spending over the long term.

That means when the stimulus ends and politicians and mainstream economists expect the effects of the stimulus to continue, it doesn’t. The economy is back where it was before the stimulus, only now they’ve added on a bunch of government spending and debt.

As the old saying goes, ‘When you’ve dug yourself into a hole, it’s a good idea to stop digging.’

The fact is that contrary to conventional wisdom, a recession is the necessary follow-on from a boom. The recession helps to purge the economy of bad investments and bad decisions.

Without that purge the bad investments continue to spread like weeds in a nicely manicured lawn…and you don’t want that.

But eventually, well, a bad business is a bad business. Providing there isn’t further stimulus, the bad businesses will die. It’s just a longer process due to the temporary stimulus.

That’s why we see such a great opportunity in the beaten-down resources market. Companies have gone bust. They’ve cancelled projects, and stopped investing in capital.

But one fact remains — the demand for raw materials won’t stop tomorrow. In fact, the demand for raw materials is increasing and isn’t likely to stop increasing anytime soon.

Crude oil demand and supply continues to rise

Let’s take one of our favourite commodities, crude oil.

We like to follow the International Energy Agency’s data on world oil demand and supply. As this chart shows, over the past four years, the demand for oil has continued to rise:

International Energy Agency's data on world oil demand.
Source: International Energy Agency
Click to enlarge

But it’s not just the demand that has continued to rise, it’s the supply too. As this chart shows. And although it doesn’t show the average for 2014, IEA data says for the first quarter this year the average daily supply of oil was 92.3 million barrels per day. That’s higher than the 2013 average:

International Energy Agency's data on world oil supply.
Source: International Energy Agency
Click to enlarge

So, are these increases the impact of genuine unstimulated demand? Or is it all down to stimulus? Or is it a mix of both?

The reality is that it’s a mix of both. But it’s not a 50/50 split. The vast majority is due to genuine demand. Only a small portion is likely to be stimulus driven.

And yet the way the stock markets have punished mining stocks, you would think the second the US Federal Reserve ends its money printing program later this year that all mining and drilling will grind to a halt.

It’s a crazy thought, and it won’t happen.

Don’t wait until these stocks are higher

But that’s what markets do. When things look bad investors tend to price in the worst. Only when things don’t turn out to be so bad does the market do an about turn and surge into the unfairly beaten down stocks.

When that happens — as we expect it to this year — investors will do two things.

The speculators will hit the market first, looking for the best value stocks with the best opportunities for the biggest gains (these stocks are the hallmark of Jason’s work).

Once these stocks start to move then the more conservatively minded investor will look at the bigger and supposedly safer blue-chip resource stocks.

Few investors can see that opportunity right now. Why? Because most investors like to buy high. They buy when stocks have already gone up because it makes them feel more secure.

The trouble is it means they miss out on some of the market’s biggest gains.

Buying high and then watching the Australian share market go higher is an OK strategy. But in our view it’s much better to buy low — right at the depths of despair in a particular sector — and then watch the stock go high.

Right now Jason has handpicked a number of stocks in this zone. He calls them ‘bounce back’ stocks. Check out the details here…

Cheers,
Kris+

PS: Australia’s biggest miners, BHP and RIO, have fallen with the rest of the mining sector. But though their future is looking bright, are they a good buy at these prices? Check out the Money Morning Premium Notes to discover whether it’s time to stock up, or to look elsewhere.

Join Money Morning on Google+


By MoneyMorning.com.au

The Truth About Quantitative Easing

By MoneyMorning.com.au

QE is a tax.

That’s an odd thing to say about the Federal Reserve’s bond-buying stimulus program, known as quantitative easing, or QE. But the reality of QE is different than what most people think.

To talk about this, I sought out Warren Mosler, a former hedge fund manager and now trailblazing economist. So on one Sunday afternoon, with Mosler in Italy and me in Gaithersburg, Md., we chatted on Skype about the Federal Reserve and its doings.

Mosler was also a successful banker, and he talks about this stuff with the ease that comes from deep familiarity with the plumbing of the system. The US system, importantly, is one of floating exchange rates and a nonconvertible currency. Meaning the government does not fix the price of the dollar against anything (contra what is done in Hong Kong, where they peg their currency to the dollar). And it is not convertible into anything except itself. (You can’t present your dollars to the Federal Reserve and demand gold, for instance.)

With those parameters, we started with a simple question: What would the natural rate of interest be if the government didn’t try to interfere in the interest rate market? (‘Natural rate’ in this context means the risk-free, nominal rate of interest.)

Well, before we can answer that, think about the ways the government interferes in the interest rate market. There are two ways, Mosler points out. The first is that the government pays interest on bank reserves, which are essentially checking accounts held at the Fed. Currently, that rate is 25 basis points, or 0.25%.

The second is to offer ‘alternative accounts at the Fed called Treasury securities’. These are essentially savings accounts and pay higher interest than the checking accounts (or reserve accounts).

If we eliminated these things, there would no interest paid on reserves, and there would be no securities,’ Mosler says. ‘So the natural rate of interest would be zero.’ Like in Japan for 20 years.

Note this doesn’t mean there would be no interest rates. It means absent these interventions, the market would determine interest rates based on credit risk, etc. But there would be no floor — no risk-free rate, no natural rate — put in place by the government.

Not that you should do it that way,’ Mosler says, ‘but that’s the way to look at it. The base case is zero. Then the Treasury comes in and offers $17 trillion in securities. And that’s a distortion, to some degree. If the Fed did QE and bought them all back, it would put you back to where you started. In some sense, QE is undoing what the Treasury has done.’ When the Fed buys securities, it is as if the Treasury never issued them in the first place.

Or as Mosler puts it:

It can be argued that asset pricing under a zero interest rate policy is the ‘base case’ and that any move away from a zero interest rate policy constitutes a (politically implemented) shift from this ‘base case’.

In other words, the government doesn’t have to pay 3% on a 10-year note, as it does today. It doesn’t have to issue bonds at all. It creates dollar deposits (money) in member bank reserve accounts when it spends. By issuing securities/offering alternative interest-bearing accounts, the government pays a lot of interest to the economy.

So in that sense,’ Mosler says, ‘issuing securities means paying higher rates than the overnight rate. It is a spending increase and has an inflationary bias by adding net financial assets to the system.

The mainstream view says that when the government sells Treasury securities, it is taking money out of the system, that it’s a deflationary thing to do and it offsets the inflationary effect of deficit spending. ‘Not true at all,’ Mosler says. ‘Selling Treasuries does not take money out.’ What’s happening is akin to a shuffle between checking accounts and savings accounts.

Let’s turn back to the case of QE, where the Fed buys securities. In this case, the economy loses the interest income from those securities.

QE takes money out of the economy,’ Mosler says, ‘which is what a tax does.’ Hence, as noted above, QE is a tax.

The whole point of QE is to bring rates down,’ Mosler says. ‘If it does bring rates down, that means the rest of the securities the Treasury sells pay less interest too. So it lowers government interest expense even more. Because the government is a net payer of interest, lower rates mean it pays less interest.

But does it help the economy? Hard to see how it does. Mosler has an interesting take here. I’ll paraphrase as best I can.

Let’s say people ask why the Fed is buying securities. Well, to help the economy. So now people have to think about whether that policy will work or not. If it’s going to work, that means the Fed’s going to be raising rates, because the economy will be getting stronger. The only time QE will bring rates down is if investors think the policy won’t work. It’s a policy that works through expectations, and it works only if investors think it won’t work.

It’s a disgrace,’ he says.

On top of that, most investors don’t understand it,’ Mosler says. ‘You’ve got the Chinese reading about how the Fed is printing money. And they go and buy gold. There are knock-on effects all over the world, and portfolios are shifting based on perceptions.

QE, then, because it costs the private sector interest income and doesn’t add money to the economy, is not inflationary. ‘The evidence is that it is not inflationary,’ Mosler says.

Let’s look at it another way. The bank of Japan has been trying to create inflation for 20 years. The Fed’s been trying to create inflation as hard as it can. The European Central Bank too. ‘It is not so easy for a central bank to create inflation,’ he says, ‘or you’d think one of these guys would’ve succeeded.

People act like you have to be careful because one false move on inflation expectations and, bang, you have hyperinflation,’ Mosler chuckles. ‘If you know what that false move is, tell Janet Yellen [the current Fed chief], because she’s trying to find it.

Though he no longer runs a hedge fund, Mosler is still involved in financial markets. He has a portfolio he runs for himself and for other people. I asked him if he fears interest rates going up.

It could happen,’ he says. ‘It’s a political decision where rates go.

And that’s a good place to leave it. Because it brings us back to the beginning. Without the government wading into the interest rate market, the base rate would be zero. And everybody would be working off that. But instead, we have the Fed trying to find monetary nirvana.

As Mosler says, it’s a disgrace.

Chris Mayer,
Contributing Editor, Money Morning

Ed Note: The above article was originally published in The Daily Reckoning US.

Join Money Morning on Google+


By MoneyMorning.com.au

Gold Speculators raised bullish bets for 3rd straight week, highest level in 5 weeks

By CountingPips.com

Weekly CFTC Net Speculator Gold Report

gold

GOLD: Large futures market traders and speculators raised bullish bets in the gold futures market last week for a third consecutive week and to the highest level in over a month, according to the latest Commitment of Traders (COT) data released by the Commodity Futures Trading Commission (CFTC) on Friday.

The non-commercial futures contracts of Comex gold futures, traded by large speculators and hedge funds, totaled a net position of +97,956 contracts in the data reported through May 6th. This was a change of +12,729 contracts from the previous week’s total of +85,227 net contracts on April 29th.

The gold non-commercial net positions rose by the highest weekly amount since March 18th last week and the overall net speculator positions are at the highest weekly standing since April 1st when net positions equaled +100,145 contracts.

Over the weekly reporting time-frame, from Tuesday April 29th to Tuesday May 6th, the gold price climbed from $1,296.20 to $1,307.60 per ounce, according to gold futures price data from investing.com.


Last 6 Weeks of Large Trader Non-Commercial Positions

DateOpen InterestLong SpecsShort SpecsNet Non-CommercialsWeekly ChangeGold Price
04/01/201436345115815258007100145-171721279.60
04/08/20143654001496936109488599-115461310.10
04/15/20143695771474326814079292-93071302.90
04/22/2014372593146880650478183325411284.90
04/29/2014378092147769625428522733941296.20
05/06/20144047001609826302697956127291307.60

*COT Report: The weekly commitment of traders report summarizes the total trader positions for open contracts in the futures trading markets. The CFTC categorizes trader positions according to commercial hedgers (traders who use futures contracts for hedging as part of the business), non-commercials (large traders who speculate to realize trading profits) and nonreportable traders (usually small traders/speculators). Find CFTC criteria here: (http://www.cftc.gov/MarketReports/CommitmentsofTraders/ExplanatoryNotes/index.htm).

Article by CountingPips.comForex Trading Apps


Crude Oil Speculators pared bullish positions for 2nd week to lowest level since Feb.

By CountingPips.com

Weekly CFTC Net Speculator Crude Oil Report

CrudeOil

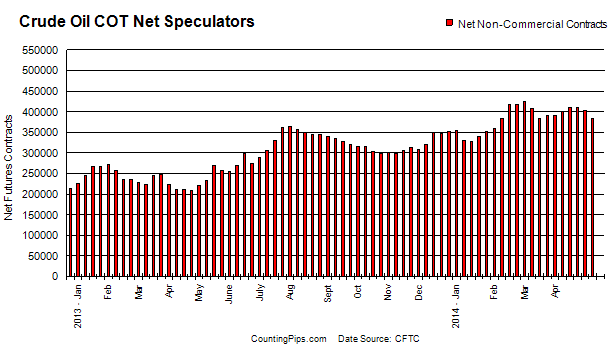
CRUDE OIL: Large futures market traders and speculators cut their overall bullish bets in crude oil futures last week for a second straight week and to the lowest level since February, according to the latest Commitment of Traders (COT) data released by the Commodity Futures Trading Commission (CFTC) on Friday.

The non-commercial contracts of crude oil futures, primarily traded by large speculators and hedge funds, declined to a total net position of +383,093 contracts in the data reported for May 6th. This was a change of -19,234 contracts from the previous week’s total of +402,327 net contracts for the data reported through April 29th.

Last week’s decline was the second straight weekly retreat in bullish positions and brought the overall bullish standing to the lowest level since February 11th when net positions totaled +382,334 contracts.

Over the same weekly reporting time-frame, from Tuesday April 29th to Tuesday May 6th, the crude oil price fell from $100.58 to $99.81 per barrel, according to Nymex futures price data from investing.com. Brent crude prices, meanwhile, also showed a decline from $108.86 to $107.12 per barrel from Tuesday April 29th to Tuesday May 6th, according to prices from investing.com.


Last 6 Weeks of Large Trader Non-Commercial Positions

DateOpen InterestLong SpecsShort SpecsNet Non-CommercialsWeekly ChangeOil Price
04/01/2014164450750238911060639178360999.61
04/08/201416554725120351122483997878004102.33
04/15/201416742765234901139394095519764103.78
04/22/20141619737517023106898410125574101.92
04/29/20141651521522018119691402327-7798100.58
05/06/20141638412492901109808383093-1923499.81

*COT Report: The weekly commitment of traders report summarizes the total trader positions for open contracts in the futures trading markets. The CFTC categorizes trader positions according to commercial hedgers (traders who use futures contracts for hedging as part of the business), non-commercials (large traders who speculate to realize trading profits) and nonreportable traders (usually small traders/speculators). Find CFTC criteria here: (http://www.cftc.gov/MarketReports/CommitmentsofTraders/ExplanatoryNotes/index.htm).

Article by CountingPips.comForex Trading News


Currency Speculators added to Dollar short bets, USD marks new 2014 low level

By CountingPips.com

Cot-Values

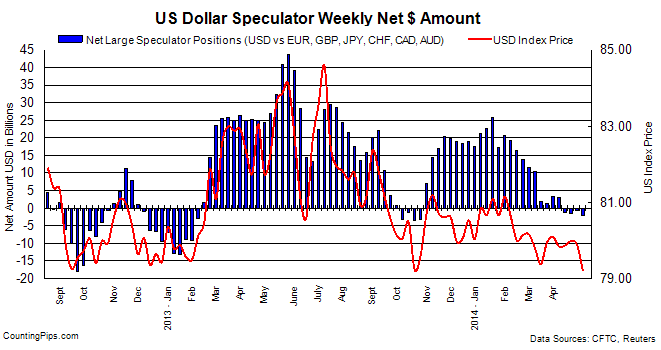
The latest data for the weekly Commitments of Traders (COT) report, released by the Commodity Futures Trading Commission (CFTC) on Friday, showed that large traders and speculators added to their bearish bets of the US dollar last week and brought the overall USD position to the lowest level of the year.

Non-commercial large futures traders, including hedge funds and large International Monetary Market speculators, had an overall US dollar short position totaling -$2.03 billion as of Tuesday May 6th, according to the latest data from the CFTC and calculations by Reuters. This was a weekly change of -$1.344 billion from the -$0.686 billion total short position that was registered on April 29th, according to Reuters that totals the US dollar contracts against the combined contracts of the euro, British pound, Japanese yen, Australian dollar, Canadian dollar and the Swiss franc.

The USD position has now been on the bearish side for the past four weeks after having crossed over into bearish territory on April 15th. The current level is the most bearish level in the dollar since October 29th 2013 when the bearish position equaled -$3.15 billion.

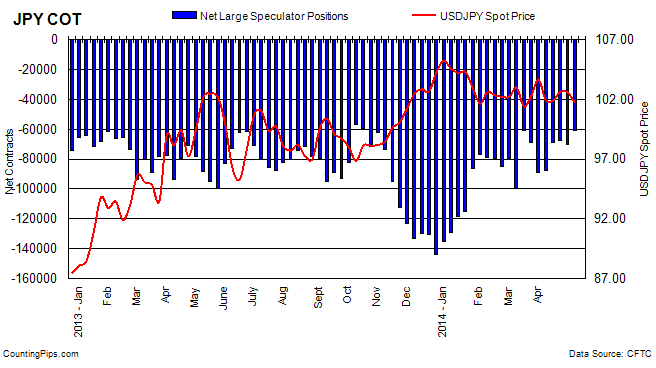
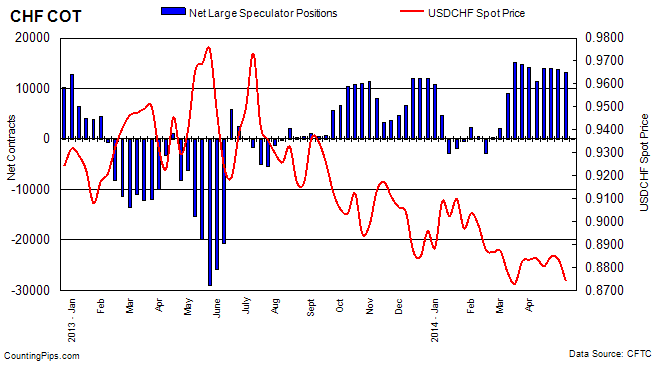
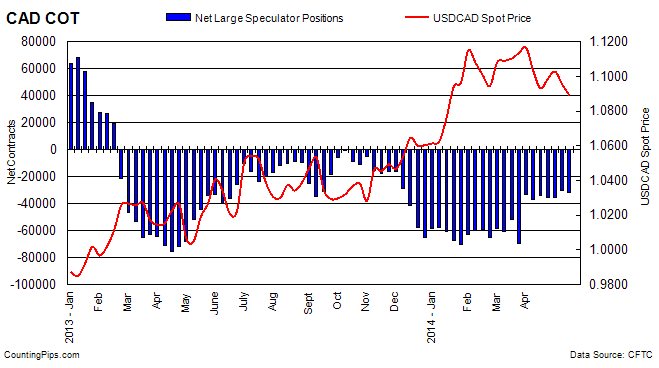
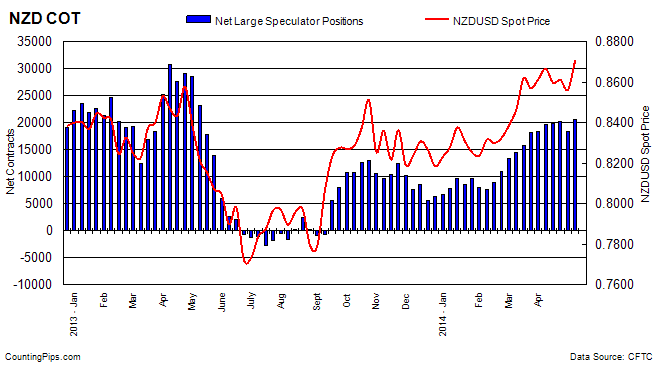
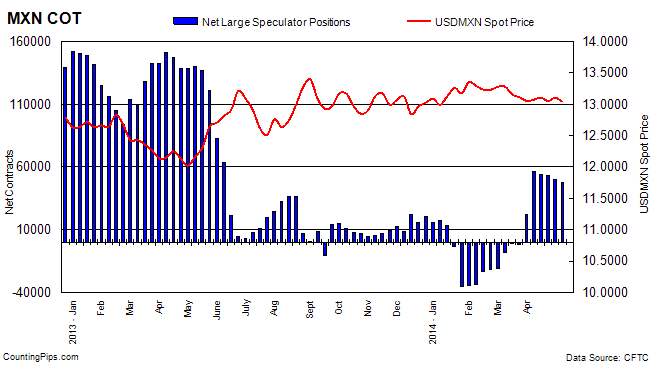
For the week, speculators increased their bets in favor the euro, Japanese yen and the New Zealand dollar while there were weekly declines for the Canadian dollar, British pound sterling, Swiss franc, Australian dollar and the Mexican peso.

cot-standings

Notable changes:

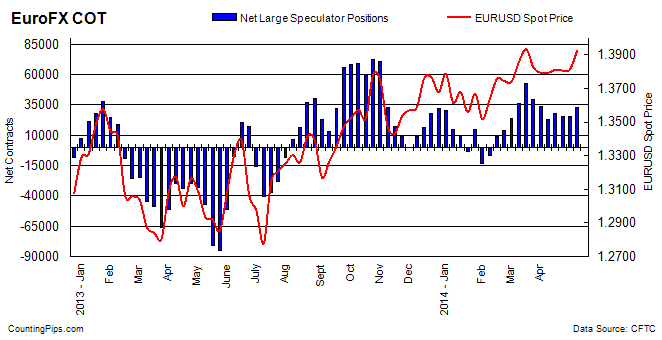
  • Euro positions rose to the highest level since April 1st although the data was recorded before the ECB rate decision on Thursday – where the ECB hinted at possible easing policy in June
  • Japanese Yen net positions fell to the lowest bearish level of 2014 (lowest level since October 15, 2013)
  • Australian dollar net positions fell for a 2nd week following a streak of 7 straight weekly increases & remain on bullish side for 5th week
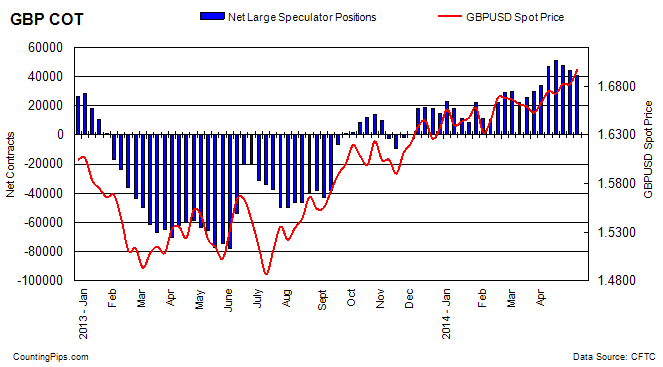
  • British pound sterling positions declined for a 3rd week


* All currency positions are in direct relation to the US dollar where, for example, a bet for the euro is a bet that the euro will rise versus the dollar while a bet against the euro will be a bet that the dollar will gain versus the euro. Please see charts and data below.


Weekly Charts: Large Speculators Weekly Positions vs Currency Spot Price

EuroFX:

eurofx

Last Six Weeks data for EuroFX futures

DateOpen InterestLong SpecsShort SpecsLarge Specs NetWeekly Change
04/01/20142600751018496861133238-6396
04/08/2014261439926356933523300-9938
04/15/201427072210625278564276884388
04/22/20142662591012047543025774-1914
04/29/20142715151022857655125734-40
05/06/201427701311067378122325516817


British Pound Sterling:

gbp

Last Six Weeks data for Pound Sterling futures

DateOpen InterestLong SpecsShort SpecsLarge Specs NetWeekly Change
04/01/20142114377596942397335723848
04/08/201422666791642451654647712905
04/15/20142266888747236874505984121
04/22/2014237055896924189247800-2798
04/29/2014236030859134167944234-3566
05/06/2014241264837944314840646-3588


Japanese Yen:

jpy

Last Six Weeks data for Yen Futures

DateOpen InterestLong SpecsShort SpecsLarge Specs NetWeekly Change
04/01/201418846422162110800-88638-19751
04/08/201418181413340100802-874621176
04/15/20141648431435183067-6871618746
04/22/20141656741656483807-672431473
04/29/20141688201384684198-70352-3109
05/06/20141670932038181109-607289624


Swiss Franc:

chf

Last Six Weeks data for Franc futures

DateOpen InterestLong SpecsShort SpecsLarge Specs NetWeekly Change
04/01/201447228248001056914231-588
04/08/20144475219275794011335-2896
04/15/201448976239059839140662731
04/22/20144688821732770914023-43
04/29/20144742421960825713703-320
05/06/201455538251021191813184-519


Canadian Dollar:

cad

Last Six Weeks data for Canadian dollar futures

DateOpen InterestLong SpecsShort SpecsLarge Specs NetWeekly Change
04/01/20141179662754964543-36994-3779
04/08/20141203362870463011-343072687
04/15/20141195252828863714-35426-1119
04/22/20141187072752962984-35455-29
04/29/20141235893009360388-302955160
05/06/20141222872804459644-31600-1305


Australian Dollar:

aud

Last Six Weeks data for Australian dollar futures

DateOpen InterestLong SpecsShort SpecsLarge Specs NetWeekly Change
04/01/2014939993539840278-488015647
04/08/201496887376303432033108190
04/15/201498933404633236680974787
04/22/20141076964954033170163708273
04/29/2014109934500193931310706-5664
05/06/201410493644805361688637-2069


New Zealand Dollar:

nzd

Last Six Weeks data for New Zealand dollar futures

DateOpen InterestLong SpecsShort SpecsLarge Specs NetWeekly Change
04/01/20143231325765728518480267
04/08/201432898265216755197661286
04/15/2014331002667168241984781
04/22/20143257926056588120175328
04/29/20142985822979449918480-1695
05/06/201433025250274334206932213


Mexican Peso:

mxn

Last Six Weeks data for Mexican Peso futures

DateOpen InterestLong SpecsShort SpecsLarge Specs NetWeekly Change
04/01/201414527049893281092178423438
04/08/201413033170371138705650134717
04/15/2014131412710381680154237-2264
04/22/2014128932683291481853511-726
04/29/2014128100680731845549618-3893
05/06/2014146455676631977947884-1734


*COT Report: The weekly commitment of traders report summarizes the total trader positions for open contracts in the futures trading markets. The CFTC categorizes trader positions according to commercial hedgers (traders who use futures contracts for hedging as part of the business), non-commercials (large traders who speculate to realize trading profits) and nonreportable traders (usually small traders/speculators).

The Commitment of Traders report is published every Friday by the Commodity Futures Trading Commission (CFTC) and shows futures positions data that was reported as of the previous Tuesday (3 days behind).

Each currency contract is a quote for that currency directly against the U.S. dollar, a net short amount of contracts means that more speculators are betting that currency to fall against the dollar and a net long position expect that currency to rise versus the dollar.

(The graphs overlay the forex spot closing price of each Tuesday when COT trader positions are reported for each corresponding spot currency pair.)

See more information and explanation on the weekly COT report from the CFTC website.


Article by CountingPips.comForex Apps & News

US 10-Year Treasury Note Speculators added to bearish positions as yield declines

By CountingPips.com

Weekly CFTC Net Speculator Report


10-Year

Large Speculators net bearish positions rise to a total of -129,409 contracts

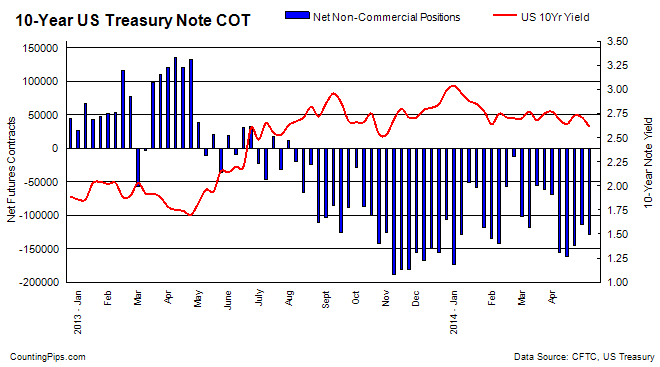
10 Year Treasuries: Large futures market traders and speculators added to their overall bearish bets in the 10-year treasury note futures last week following two weeks of declining bearish bets, according to the latest Commitment of Traders (COT) data released by the Commodity Futures Trading Commission (CFTC) on Friday.

The non-commercial futures contracts of the 10-year treasury notes, primarily traded by large speculators and hedge funds, totaled a net position of -129,409 contracts in the data reported for May 6th. This was a change of -14,984 contracts from the previous week’s total of -114,425 net contracts that was recorded on April 29th.

The 10-Year Note non-commercial net bearish positions had declined for two consecutive weeks and to the lowest level since April 1st before last week’s rise in bearish positions.

Over the weekly reporting time-frame, from Tuesday April 29th to Tuesday May 6th, the yield on the 10-Year treasury note decreased from 2.71 to a yield of 2.61, according to data from the United States Treasury Department.

Last 6 Weeks of Large Trader Non-Commercial Positions

DateOpen InterestLong SpecsShort SpecsNet Large SpecsWeekly Change10 Year Yield
04/01/20142503964346901415677-68776-70112.77
04/08/20142572114327159482333-155174-863982.69
04/15/20142497347344056506334-162278-71042.64
04/22/20142493544349474495339-145865164132.73
04/29/20142528687332918447343-114425314402.71
05/06/20142618485340698470107-129409-149842.61


*COT Report: The weekly commitment of traders report summarizes the total trader positions for open contracts in the futures trading markets. The CFTC categorizes trader positions according to commercial hedgers (traders who use futures contracts for hedging as part of the business), non-commercials (large traders who speculate to realize trading profits) and nonreportable traders (usually small traders/speculators). Find CFTC criteria here: (http://www.cftc.gov/MarketReports/CommitmentsofTraders/ExplanatoryNotes/index.htm).


Article by CountingPips.comForex Trading Apps


VIX Futures Speculators increased bearish positions last week to highest level since January

By CountingPips.com

Weekly CFTC Net Speculator VIX Report


vix


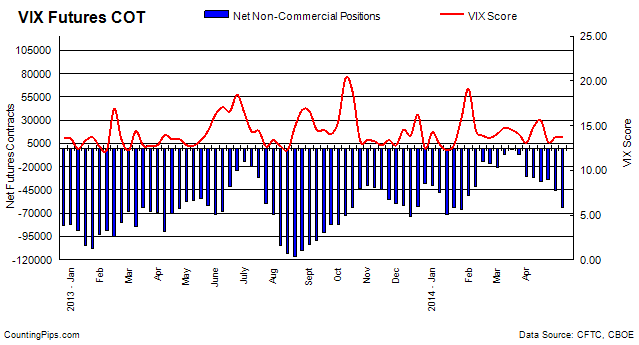
VIX Futures Contracts: Large traders and speculators raised their overall bearish bets in the VIX futures market last week for a second straight week and for the sixth time out of the last seven weeks, according to the latest data from the Commodity Futures Trading Commission (CFTC) released on Friday.

The VIX non-commercial futures contracts, comprising of large speculator and hedge fund positions, totaled a net bearish position of -63,466 contracts in the data reported for May 6th. This was a change of -17,980 contracts from the previous week’s total of -45,486 net contracts that was registered on April 29th.

The second straight increase in bearish positions brings overall net contracts to the highest bearish level since January 28th when net positions stood at a level of -65,504 contracts.

Meanwhile, the VIX index over the same reporting time-frame last week edged higher for a 2nd week from a 13.71 reading on Tuesday April 29th to a 13.80 reading on Tuesday May 6th, according to the Chicago Board Options Exchange (CBOE) Volatility Index.

Last 6 Weeks of Large Trader Positions

DateOpen InterestLong SpecsShort SpecsNet Non-CommercialsWeekly ChangeVIX Score
04/01/2014357046114839145412-30573-2336913.10
04/08/2014359952105096136842-31746-117314.89
04/15/201436888796296132242-35946-420015.61
04/22/2014362130106598140655-34057188913.19
04/29/2014365215110843156329-45486-1142913.71
05/06/2014391848104252167718-63466-1798013.80

*COT Report: The weekly commitment of traders report summarizes the total trader positions for open contracts in the futures trading markets. The CFTC categorizes trader positions according to commercial hedgers (traders who use futures contracts for hedging as part of the business), non-commercials (large traders who speculate to realize trading profits) and nonreportable traders (usually small traders/speculators). Find CFTC criteria here: (http://www.cftc.gov/MarketReports/CommitmentsofTraders/ExplanatoryNotes/index.htm).


Article by CountingPips.comForex Apps & Analysis


Thoughts from the Frontline: Are Valuations Really Too High?

By John Mauldin

The older I get and the more I research and study, the more convinced I become that one of the more important traits of a good investor or businessman is not simply to come up with the right answer but to be able to ask the right question. The questions we ask often reveal the biases in our thinking, and we are all prone to what behavioral psychologists call confirmation bias: we tend to look for (and thus to see, and to ask about) things that confirm our current thinking.

I try to spend a significant part of my time researching and thinking about things that will tell me why my current belief system is wrong, testing my opinions against the ideas of others, some of whom are genuine outliers.

I have done quite a number of media interviews and question-and-answer sessions with audiences in the past few months, and one question keeps coming up: “Are valuations too high?” In this week’s letter we’re going to try to look at the various answers (orthodox and not) one could come up with to answer that basic question, and then we’ll look at market conditions in general. This letter may print a little longer as there are going to be a lot of charts.

I am back in Dallas today, getting ready to leave Monday for San Diego and my Strategic Investment Conference. I’m really excited about the array of speakers we have this year. We’re going to share the conference with you in a different way this year. My associate Worth Wray and I are going to do a brief summary of the speakers’ presentations every day and send that out as a short Thoughts from the Frontline for four days running. Plus, for those who are interested in my more immediate reactions, I suggest you follow me on Twitter. There are still a few spots available at the conference, as we have expanded the venue, and if you would like to see who is speaking or maybe decide to show up at the last minute (which you should), just follow this link. Now let’s jump into the letter.

Take It to the Limit

First, let’s examine three ways to look at stock market valuations for the S&P 500. The first is the Shiller P/E ratio, which is a ten-year smoothed curve that in theory takes away some of the volatility caused by recessions. If this metric is your standard, I think you would conclude that stocks are expensive and getting close to the danger zone, if not already in it. Only by the standards of the 2000 tech bubble and the year 1929 do you find higher normalized P/E ratios.

But if you look at the 12-month trailing P/E ratio, you could easily conclude that stocks are moderately expensive but not yet in bubble territory.

And yet again, if you look at the 12-month forward P/E ratio, it might be easy to conclude that stocks are fairly, even cheaply priced.

In a Perfect World

Earnings are projected to grow rather significantly. Let’s visit our old friend the S&P 500 Earnings and Estimate Report, produced by Howard Silverblatt (it’s a treasure trove of data, and it opens in Excel here.

I copied and pasted below just the material relevant for our purposes. Basically, you can see that using the consensus estimate for as-reported earnings would result in a relatively low price-to-earnings ratio of 13.5 at today’s S&P 500 price. If you think valuations will be higher than 13.5 at the end of 2015, then you probably want to be a buyer of stocks. (Again, you data junkies can see far more data in the full report.)

But this interpretation begs a question: How much of 2013 equity returns were due to actual earnings growth and how much were due to people’s being willing to pay more for a dollar’s worth of earnings? Good question. It turns out that the bulk of market growth in 2013 came from multiple expansion in the US, Europe, and United Kingdom. Apparently, we think (at least those who are investing in the stock market think) that the good times are going to continue to roll.

The chart above shows the breakdown of 2013 return drivers in global markets, but this next chart, from my friend Rob Arnott, shows that roughly 30% of large-cap US equity (S&P 500) returns over the last 30 years have come from multiple expansion; and recently, rising P/E has accounted for the vast majority of stock returns in the face of flat earnings.

The Future of Earnings

What kind of returns can we expect from today’s valuations? There are two ways we can look at it. One way is by looking at expected returns from current valuations, which is how Jeremy Grantham of GMO regularly does it. The following chart shows his projections for the average annual real return over the next seven years.

To continue reading this article from Thoughts from the Frontline – a free weekly publication by John Mauldin, renowned financial expert, best-selling author, and Chairman of Mauldin Economics – please click here.


The Retirement War You Know Nothing About

By MoneyMorning.com.au

Retirement.

It’s the last thing you would think Generation Z are thinking about. However those born after the mid-90s are.

The Age reported during the week:

‘With the first crop of this age group now entering the workforce and making compulsory super contributions, this generation, the first purebred digital natives, is going to have to start thinking about investment strategies.’

According to The Age, 16 year old Nathan Feiglin is already thinking about his retirement options.  

More specifically, not having retirement options.

As Feiglin tells the AgeI don’t want to retire and not have enough money to live on.’ However, he adds it’s not a subject that keeps him up at night.

It’s fantastic to see teenagers taking an interest in financial planning for later in their lives. Yet the focus of the financial planning revolves around the traditional asset model.

Like all good Australians, buying a home is a ‘financial goal’. But high Australian house prices mean 16-year old Feiglin will most likely start with an investment property.

Nothing says long term wealth like negative gearing for a tax concession.

Snide comments aside, Feiglin’s plans are similar to what baby boomers set up for themselves for retirement.

That is, buy a house. Perhaps an investment property or two. Some shares, in particular income paying stocks.

From here, the plan is simple. Sell as required and continue the income stream.

The thing is, this sort of routine planning relies on one thing: Asset prices continuing to rise.

Will this work out for Feiglin? Assuming he works until he is 65, his retirementis half a century away. So much can change in this time. Financial markets, government policies and agendas, all could look different in 2064 than in 2014.

However, tomorrow’s retirees are about to put their twilight plans into action.

And they’re about to find out it might not be the rosy cruise-ship-island-hopping-spend-the-kids-inheritance sort of living they were planning.

What if I told you the assets baby boomers have paid top dollar for today will be sold for a fraction of that price in years to come?

In fact, I won’t tell you, I’ll let my co-worker show you.

Nick Hubble, editor of The Money For Life Letter, produced this chart for readers almost two months ago:


Source: The Money For Life Letter Data: ABS
Click to enlarge

It’s the ratio of middle aged to old people. In simple terms, the number of people between the ages of 45–65 compared to the number of people 65 and older.

The M/O ratio is showing that as of today it will slide from 1.6 to almost 1.

Meaning, there won’t be enough people to buy the assets the retirees are selling for their retirement income.

Furthermore, have a look at Australia’s future population.  As Nick pointed out recently to subscribers of The Money For Life Letter, the bulk of investments made come from the 45–65 age bracket. The number of the baby boomers will outnumber the people in the 45–65 range.  


Source: ABS
Click to enlarge

For the next investing generation, there will be a greater choice of assets to purchase at a lower cost.

Looked at another way, the sellers will outnumber the buyers, and this will force prices down.

In short, all of those assets you thought you could sell at a higher price to your children and their generation — it isn’t going to happen. Chances are retirees will have to accept that something is better than nothing when it comes to selling their assets.

Nick has called this the ‘war on retirement’. And he reckons its these demographics that will win.

He explained it like this:

‘This is what it boils down to: The ratio of buyers to sellers in the stock market will reach and fall below 1. Do you think it is possible for the average 45–65 year old Australian to invest as much into the stock market as the average retiree plans to sell each year? I doubt it. And that means prices will fall.’

The changing demographics vastly alter the type of retirement you are planning. And the demographics are this: Not enough children were born to offset the number of retirees.

The decade or two baby boomers spent accumulating assets to sell to fund their retirement might not fund it after all.

Simply put, if the number of sellers is higher than the number of willing buyers, then prices will have to come down. This means that you end up selling your assets for a fraction of what you thought you could get.

Ultimately, this undermines any or all of the future income plans you have made.

What can you do about it? Well, Nick had a few words of advice for some of the retirees in the audience of the World War D conference:

Eat your vegetables, go to the gym and inform yourself about your future health by getting your genome sequenced. Staying mentally and physically fit helps keep your job. Working prolongs your life.

Move out of the family home and downsize. House prices will fall.

And save money for a rainy day. Because your investments won’t be there for you.

My last piece of advice to all of you in the audience is this: Always be nice to your children.

Don’t rush out and fill out the gym health check forms just yet. Nick has some other ideas here that can help you out with your retirement plans.

Shae Smith+
Editor, Money Weekend

Join Money Morning on Google+


By MoneyMorning.com.au