Euro Slumps vs JPY; Losses Will Extend Below 140

Technical Sentiment: Bearish

Key Takeaways

  • Euro sentiment takes another hit as economic expectations for Germany decline;
  • Bundesbank open to significant ECB stimulus in June;
  • EUR/JPY rally ends abruptly near 141;
  • Price will break below 140.00, heading towards 139.12 and 138.00 in the near future.

An unexpected decrease of 10.1 points in the ZEW Indicator of Economic Sentiment added pressure to the existing EURO negative sentiment and led to a quick sell-off across the board. After bouncing from the 140.00 support area, EUR/JPY is in the midst of another attempt to break below this level. 140.90 is the main pivot acting as resistance and the pair has already formed a Lower High in this area, so a logical continuation will be a Lower Low towards 139.12.


Technical Analysis

EURJPY 13th May

The Euro maintains a negative sentiment and there is little that can change in the next two days, which suggests bears will remain in control for now. During the European Session EUR/JPY successfully tested and rejected off of April’s support line at 140.97, also 38.2% Fibonacci retracement from 142.46 down to 139.87, confirming the line as the current resistance.

The current target for today, considering the average daily range of EUR/JPY as of recently, is a test of 140.00 – 139.87. A strong break below 140.00 will trip stop losses and accelerate the sell-off towards 139.13 (61.8% Fibonacci Retracement between 136.21 and 143.77), yet the 200-Day Simple Moving Average (priced at 137.64) will be the main target for such an important support break.

Failure to break below 140.00 is likely to form a short consolidation between 140.00 and 141.00, rather than a consistent bullish reversal. Thus, selling rallies remains the preferred strategy on all timeframes while EUR/JPY price remains below 141.

*********
Prepared by Alexandru Z., Chief Currency Strategist at Capital Trust Markets


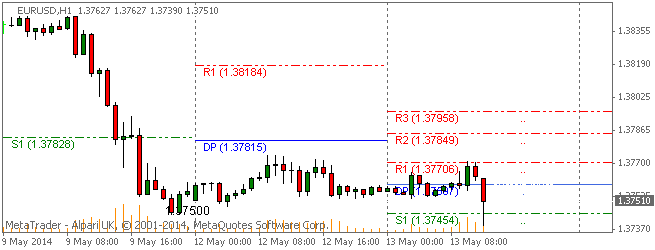
EURUSD Forex Trading Pivot Point Levels: Pair touches below 1.3750

2014.05.13 12:30 6:30AM ET | EURUSD Currency Pair

SC EURUSD 2014.05.13

Here are the current Pivot Points Levels with Support (S) and Resistance (R) for the EURUSD currency pair today. Price action is currently trading under the daily pivot point at the 1.37510 price level, according to data at 6:30 AM ET. The EURUSD high for the day has been 1.37708 while the low of day has reached to 1.37390. The pair earlier today opened the Asian trading session a touch below the daily pivot and trended mostly sideways before dropping to the lows of the day below 1.3740 today.

Daily Pivot Point: 1.37597
— S1 – 1.37453
— S2 – 1.37345
— S3 – 1.37201
— R1 – 1.37705
— R2 – 1.37849
— R3 – 1.37957


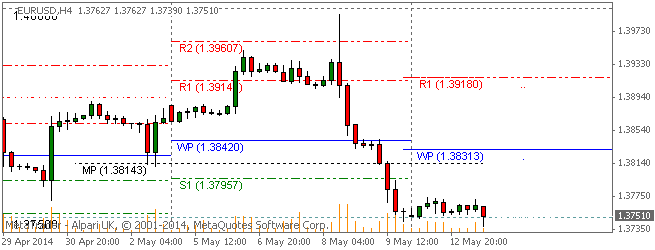
Weekly Pivot Points: EURUSD

SC EURUSD 2014.05.13

On the weekly pivots, prices are currently trading under the weekly pivot point at time of writing. The EURUSD has been on an overall sideways trend this week after opening the trading week below the weekly pivot.

Weekly Pivot Point: 1.38313
— S1 – 1.36695
— S2 – 1.35829
— S3 – 1.34211
— R1 – 1.39179
— R2 – 1.40797
— R3 – 1.41663


By CountingPips.com – Forex Trading Apps & Currency Trade Tools

Disclaimer: Foreign Currency trading and trading on margin carries a high level of risk and volatility and can result in loss of part or all of your investment. All information and opinions contained do not constitute investment advice and accuracy of prices, charts, calculations cannot be guaranteed.


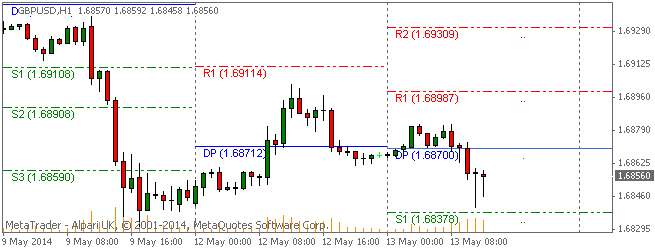
GBPUSD Forex Trading Pivot Point Levels: Cable dips to 1.6850

2014.05.13 12:30 6:30AM ET | GBPUSD Currency Pair

SC GBPUSD 2014.05.13

Here are the Pivot Points Levels with Support (S) and Resistance (R) for the GBPUSD currency pair today. Price action is currently trading at the 1.68560 price level and under the daily pivot point, according to data at 6:30 AM ET. The GBPUSD high for the day has been 1.68823 while the low of day has reached to 1.68402. The pair earlier today opened the Asian trading session slightly below the daily pivot and has trended modestly lower over the day.

Daily Pivot Point: 1.68700
— S1 – 1.68377
— S2 – 1.68091
— S3 – 1.67768
— R1 – 1.68986
— R2 – 1.69309
— R3 – 1.69595


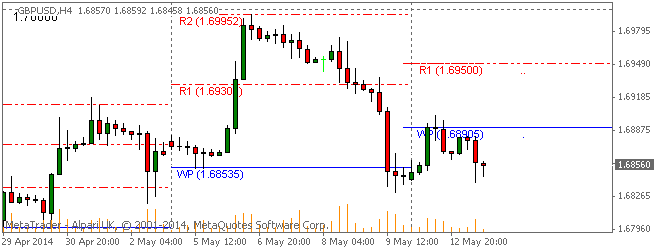
Weekly Pivot Points: GBPUSD

SC GBPUSD 2014.05.13

Prices are currently trading under the weekly pivot point at time of writing. The GBPUSD has been on an overall sideways trend this week after opening the trading week below the weekly pivot.

Weekly Pivot Point: 1.68905
— S1 – 1.67858
— S2 – 1.67263
— S3 – 1.66216
— R1 – 1.69500
— R2 – 1.70547
— R3 – 1.71142


By CountingPips.comForex Trading Apps & Currency Trade Tools

Disclaimer: Foreign Currency trading and trading on margin carries a high level of risk and volatility and can result in loss of part or all of your investment. All information and opinions contained do not constitute investment advice and accuracy of prices, charts, calculations cannot be guaranteed.


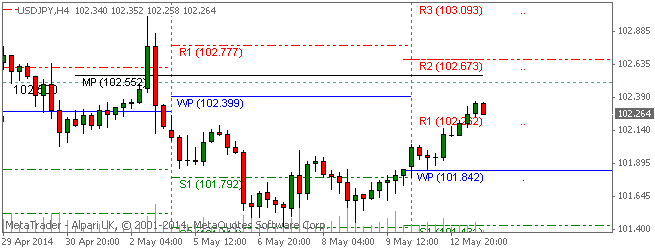
USDJPY Forex Trading Pivot Point Levels: Pair advances above 102

2014.05.13 12:30 6:30AM ET | USDJPY Currency Pair

SC USDJPY 2014.05.13

Here are the current Pivot Points Levels with Support (S) and Resistance (R) for the USDJPY currency pair today. Price action is currently trading at the 102.264 price level and over the daily pivot point, according to data at 6:30 AM ET. The USDJPY high for the day has been 102.357 while the low of day has been reached at 102.105. The pair earlier today opened the Asian trading session above the daily pivot and has trended higher to above the R1 resistance level into the North American morning session.

Daily Pivot Point: 102.023
— S1 – 101.873
— S2 – 101.641
— S3 – 101.491
— R1 – 102.255
— R2 – 102.405
— R3 – 102.637


Weekly Pivot Points: USDJPY

SC USDJPY 2014.05.13

On the weekly pivots, prices are currently trading over the weekly pivot point and right at the weekly R1 resistance level at time of writing. The USDJPY has been on an overall bullish trend early this week after opening the trading week slightly above the weekly pivot.

Weekly Pivot Point: 101.842
— S1 – 101.430
— S2 – 101.011
— S3 – 100.599
— R1 – 102.261
— R2 – 102.673
— R3 – 103.092


By CountingPips.com – Forex Trading Apps & Currency Trade Tools

Disclaimer: Foreign Currency trading and trading on margin carries a high level of risk and volatility and can result in loss of part or all of your investment. All information and opinions contained do not constitute investment advice and accuracy of prices, charts, calculations cannot be guaranteed.


Wave Analysis 13.05.2014 (DJIA Index, Crude Oil)

Article By RoboForex.com

Analysis for May 13th, 2014

DJIA Index

It looks like Index is forming extension inside wave (3). On minor wave level, price is moving upwards inside the third wave. Most likely, forecast of the price movement will remain bullish during the next several weeks, that’s why I’m planning to open several buy orders during correction.

More detailed wave structure is shown on H1 chart. Probably, price is finishing the third wave inside wave 3 and may start new correction quite soon. In the future, instrument is expected to move upwards inside wave [5] of 3.

Crude Oil

Probably, Oil continues forming the third wave. On minor wave level, price is being corrected. I’m planning to open sell order right after instrument starts falling down inside wave [3]. Right now, instrument is being corrected, so I’m opening short-term buy orders.

As we can see at the H1 chart, price formed wedge pattern inside wave (A). In the near term, Oil is expected to grow г з a little bit inside wave (C) of [2]. Later in the future, instrument may reverse and form initial descending impulse.

RoboForex Analytical Department

Article By RoboForex.com

Attention!
Forecasts presented in this section only reflect the author’s private opinion and should not be considered as guidance for trading. RoboForex LP bears no responsibility for trading results based on trading recommendations described in these analytical reviews.


Fibonacci Retracements Analysis 13.05.2014 (EUR/USD, USD/CHF)

Article By RoboForex.com

Analysis for May 13th, 2014

EUR USD, “Euro vs US Dollar”

Instead of starting new correction, which we expected, Euro is consolidating inside flat pattern. Possibly, in the nearest future price may start falling down again and reach new minimum. Target is the group of fibo levels at 1.3700 – 1.3695.

At H1 chart, pair is forming flat pattern and I decided to open short-term sell order with tight stop. According to analysis of temporary fibo-zones, lower target may be reached during the day. If later price rebounds from this target area, market may start deeper correction.

USD CHF, “US Dollar vs Swiss Franc”

It looks like Franc also decided to consolidate for a while instead of starting new correction. Probably, in the nearest future price may reach the group of upper fibo levels at 0.8900 – 0.8895. If later pair rebounds from them, price may reverse and start correction.

According to analysis of temporary fibo-zones at H1 chart, Franc may reach its upper targets during Tuesday. Price is slowing down a bit, that’s why bulls are very unlikely to break these levels. Therefore, if later price rebounds from this target area, I’ll try to sell very carefully.

RoboForex Analytical Department

Article By RoboForex.com

Attention!
Forecasts presented in this section only reflect the author’s private opinion and should not be considered as guidance for trading. RoboForex LP bears no responsibility for trading results based on trading recommendations described in these analytical reviews.


What’s Warren Buffett Buying Right Now?

By WallStreetDaily.com What’s Warren Buffett Buying Right Now?

When a billionaire makes a move, we’re well-inclined to pay attention.

I don’t just mean that philosophically, either.

The recent launch of the new iBillionaire Index (BILLION) officially rubberstamps the belief that billionaires own a substantial edge over everyday investors.

The Index tracks the holdings of over 20 billionaires – including Warren Buffett, George Soros, Carl Icahn, John Paulson, Jorge Lemann, David Tepper, Leon Cooperman, Steve Mandel, Chase Coleman, Daniel Loeb, David Einhorn and Seth Klarman.

These billionaires enjoy an edge over Wall Street, too.

Last year, the iBillionaire Index gained 43%, trumping the S&P 500’s 32%.

Since 2006, however, the spread gets even wider…

Now, tracking the companies that comprise the Index is where the story really gets juicy.

The favorite stock among billionaires is Apple (AAPL).

No surprise there, right?

Well, before you rush to buy shares, it’s worth noting that the average price billionaires have paid for Apple is $430. The average price at which these billionaires have sold Apple shares is $600.

So with Apple trading at $593, closer to where the billionaires have been sellers, is it really a company you should be buying right now?

Remember, your entry and exit points are infinitely important to your ROI.

Other favorites among billionaires include American Express (AXP), Priceline (PCLN), General Motors (GM), Micron Technology (MU), Google (GOOGL), Yahoo! (YHOO) and Netflix (NFLX).

I’ll be tracking the iBillionaire Index very closely, and promise to report any significant changes to its composition.

The second the billionaires start piling into a stock or dumping shares of another, you’ll be the first to know.

Onward and Upward,

Robert Williams
Founder, Wall Street Daily

Breaking News From the Wall Street Daily Universe

Inside the 6.3% Unemployment Rate

Wall Street took the May unemployment number of 6.3% as a sign of an improving economy, but details inside the report revealed something entirely different. The May employment report showed nearly 102 million working-age Americans are unemployed – including more than 20% of all American households that don’t have a single employed family member. The May report indicated that the BLS moved 988,000 Americans into the “not in the labor force” category, while 9.75 million Americans were categorized as “unemployed.” The additional 988,000 unemployed persons means that 92.02 million Americans are not in the labor force, giving us a total of 101.77 million working-age Americans that are currently without a job – an increase of 27 million jobless Americans since 2000. More troubling for the statistically challenged BLS, April showed that 58.9% of working-age Americans had a job, the exact number of working Americans in March – but less than the 60.6% of working-age Americans employed when Barack Obama took office in 2008. That’s a decrease of 2.8%! Shadowstats.com estimates the actual unemployment rate is closer to 23%.

Price Explosion for Gas Carriers

Since mid-February, day rates for Very Large Gas Carriers (VLGCs) have exploded in price due to an increase in propane shipments. Prices for shipping natural gas liquids increased more than 300%, to above $100,000 in just over two months. While much of the increase was in response to the brutally cold winter, it appears that shippers are finally seeing the long-awaited increase in global flows of natural gas liquids (NGLs). Analysts at DNB Markets see large potential gains in shipping prices, predicting day rates for gas carriers could rise by more than 700% over the next several years. One reason for this belief is the widening of the Panama Canal, which will be a major driver for increased U.S. shipments of NGLs to Asia. The widening project is set to be completed in 2015. Once completed, DNB analysts believe VLGC rates could rise as high as $300,000. Smart investors will look to take advantage of the trends while there’s still time.

The post What’s Warren Buffett Buying Right Now? appeared first on Wall Street Daily.

Article By WallStreetDaily.com

Original Article: What’s Warren Buffett Buying Right Now?

Why PanAust Shares Skyrocketed Today

By MoneyMorning.com.au

What Happened to PanAust Shares?

Shares of PanAust Limited [ASX:PNA] shot up more than 34.18% Tuesday after major shareholder and Chinese state-owned Guangdong Rising Assets Management (GRAM), proposed a non-binding offer on the company for $2.30 per share. The company closed at $2.12 per share.

Why Did This Happen to PanAust Shares?

Put simply, the transaction values the stock at more than $1.4 billion. However, the company won’t support the bid, saying in an ASX statement, ‘that [the bid] price remains materially below the level at which the Board would be prepared to recommend a takeover offer to its shareholders.

The bid comes at a time when the company is trading well below its 2011 high of $4.55 per share and is likely intended to control two major projects within months — the D’Oro project in Chile and Glencore’s Frieda River project in Papua New Guinea. Guangdong Rising currently holds a 22.84% stake in the miner.

What Now for PanAust Shares?

PanAust is a $1 billion Australian-based copper/gold producer. The company has upgraded its production guidance for from 65,000 to 70,000 tonnes of copper and 160,000 to 165,000 ounces of gold for the 2014 calendar year.

It’s a simple fact that the resource sector is out of favour. Money has chosen to flow into high yielding stocks and Tech stocks instead. Since the beginning of 2013, the share price has drifted down from the $3.00 per share level.

The bid shows the true intentions of Chinese — they want Aussie resources. Now that they are cheap, they are coming to get them.

With the share price hovering below the offer price of $2.30, investors are sceptical of whether the bid going through. Either GRAM will upgrade its bid and the share price will go higher or GRAM will drop its bid and the share price will fall. Either way, shareholders could be left wondering ‘what’s next’ for a while.
At the moment, it’s more likely that the share price will track sideways for a while until management provide more information on the takeover proposal.

 
Jason Stevenson+
Resources Analyst, Diggers and Drillers

Join Money Morning on Google+


By MoneyMorning.com.au

Why Orica Shares Slumped Today

By MoneyMorning.com.au

What Happened to Orica Shares?

Shares in explosives and chemicals maker Orica Ltd [ASX:ORI] fell by nearly 4% today after the company reported disappointing earnings for the six months ending March 31 2014. Orica has now slumped to a new six-month low.

Why Did this Happen to Orica?

Back in March, Orica told the market that it would earn less money this half than it did in the same period a year earlier. Today, Orica’s managing director Ian Smith reminded everyone that conditions remain “challenging”…so much so that net profit fell by 7.8% to $242 million. Markets hate surprises of that magnitude for companies in the ASX 50…hence today’s savage price action.

What Now for Orica?

There’s no denying that resource-linked companies have been doing it tough lately. Although you might think you’re gaining diverse chemical exposure with Orica, it’s important to remember that 92% of Orica’s earnings before tax come from mining-related industries. So when global miners lean towards cost-cutting, companies like Orica get crunched.

But selling Orica shares now might be an overreaction. Mining companies will always need explosives…even more so if they want to work existing mines harder. That will guarantee demand for Orica’s products into the future. And any cyclical upswing in commodity markets would bode well for this stock. In any case, you’ll be paid a reasonable dividend to own the shares until that day comes.

Tim Dohrmann+
Small-Cap Analyst, Australian Small-Cap Investigator

Join Money Morning on Google+


By MoneyMorning.com.au

Why GPT Group Shares Fell Today

By MoneyMorning.com.au

What happened to GPT Group Shares?

Shares of GPT Group [ASX:GPT] fell more than 2% Tuesday, closing at the lowest level since 22nd April after a major shareholder sold a big stake in the company.

Why did GPT Share Price fall?

Put simply, major shareholder the Government Investment Corporation (GIC) of Singapore sold an 8% stake in the stock, valued at more than $505 million. According to news reports GIC bought its original stake for as low as 60 cents per share back in 2008. Today’s sell-down means GIC could have banked a profit of as much as $400 million.

What now for GPT Group?

GPT Group is a $6.6 billion Australian-based property company. Its assets include high quality properties in the retail, office, logistics, and business park sectors. Since the stock price collapsed from sky-high levels during the 2008 financial meltdown the company appears to have gone some way towards repairing its balance sheet by raising cash levels and returning to profitability.

With a dividend payout ratio of just 63% the company has room to move if it wants to attract more investors with a higher yield. However, with fears that Australian property levels are at a peak, it’s likely that the company will choose to keep cash on the books in the event that banks start to tighten the reins on companies highly leveraged to the property market.

Cheers,
Kris+

Join Money Morning on Google+


By MoneyMorning.com.au