Gold Prices Falls on China Lower Demand

By HY Markets Forex Blog

Gold prices were seen falling on Thursday as investors raise concerns over the possible lower demand from China, the largest consumer of the metal.

Gold Futures for immediate delivery fell 0.18% lower to $1,303.50 an ounce at the time of writing, dropping from $1,309.09, the highest price since May 7. While silver edged 0.15% lower to $19.745 an ounce.

Holdings in the world’s largest gold-backed exchange traded fund, SPDR Gold Trust, lost over 4 tons to 787.95 tons on Thursday.

Prices for the yellow metal bounced back from its biggest drop in a year since 1981, climbing by 8.6% this year.

China Demand

A report from the National Bureau of statistics showed that gold and silver jewelry sales in China dropped by 30% to 20.8 billion in April from the year before.

The global investment and banking provider, Macquarie Group said the lower spending in China indicates the lower gold prices for now.

China overtook India as the world’s largest gold consumer last year, as consumption in China climbed by 32% to 1,065.8 metric tons last year, according to the World Gold Council.

China’s gold consumption is expected to rise to 1,350 tons by 2017, the World Gold Council said in April. China’s jewelry purchases of nearly 669 tons in 2013 accounted for 30% of the global total, the council confirmed.


Visit www.hymarkets.com   to find out more about our products and start trading today with only $50 using the latest trading technology today.

The post Gold Prices Falls on China Lower Demand appeared first on | HY Markets Official blog.

Article provided by HY Markets Forex Blog

Silver On The Verge Of Turning Bullish

Technical Sentiment: Neutral


Key Takeaways

  • Silver briefly traded above the 4H 200 Simple Moving Average;
  • Stop Losses above $19.74 and $19.90 cleared;
  • Higher Low – Higher High suggests a bullish technical bias.

Silver rallied 49 cents on Wednesday, providing a late continuation on Monday’s Bullish Engulfing Bar. Having briefly crossed above the 200 Simple Moving Average on the 4H time frame and with a Higher Low ($19.04) and a Higher High ($19.97) already established, the market shook a few traders out of their short positions as technical signals were heavily skewed towards the upside.


Technical Analysis
Silver 15th may

Yesterday’s gains have been completely retraced as Silver is currently trading around $19.50. The $19.97 rally above the previous highs from late-April and May cleared stop losses from short traders. At the same time this move indicated an overall bullish bias, thus Silver is technically less likely to aggressively pursue levels below $19.04 in the near future.

A deeper fall into the $19.00 – $19.33 region can suggest the bullish rallies we’ve seen this week have reached their target. However, as long as the $19.04 Low remains intact, the net positioning will be skewed towards long positions and buy orders as traders will attempt to catch another possible Higher Low.

Towards the upside $20.00 will remain the most important resistance to be broken before the downtrend is completely invalidated. A secondary major resistance lies at $20.59 in the form of a pivot zone, with the 200-Day Moving Average just above it at $20.85.

*********
Prepared by Alexandru Z., Chief Currency Strategist at Capital Trust Markets


Stocks Market Report 15th May

By HY Markets Forex Blog

Stocks –  Europe

In Europe, the equities market climbed on Thursday as investors await a string of economic reports including the eurozone’s first-quarter GDP report and inflation results for April.

The European Euro Stoxx 50 gained 0.26% to 3,218.79 at the time of writing, while the German DAX added 0.41% to 9,794.18. At the same time the French CAC 40 climbed 0.11% trading at 4,506.23, while the UK benchmark FTSE 100 rose 0.18% to 6,891.01.

GDP Reports

Traders will be focusing on the release of GDP reports from the eurozone , while the GDP in Germany showed that the nation’s economy expanded by 2.5% in the first quarter on an annual basis, up from the previous figure of 1.3% seen in the previous quarter, reports from the Federal Statistical Office showed.

In France, the gross domestic product (GDP) for the country’s first quarter over the year grew by 0.8%, according to  official data from the National Institute of Statistics.

Italy’s first quarter GDP over the year is forecasted to show a drop of 0.1%, while a rise of 0.2% on a quarterly basis is expected to be seen.

The eurozone is expected to have expanded by 1.1% year-on-year and 0.4% quarter-on-quarter, according to market analysts.

Another major economic report in the spotlight is the consumer-price inflation rate for the eurozone, with forecasts of 0.7% on an annual basis in April.

Stocks – Asia

Stocks in Asia were seen trading lower on Thursday, with the stronger yen dragging stocks lower.

The Japanese benchmark Nikkei 225 index dived 0.75% lower closing the session at 14,298.21 points, while Tokyo’s Topix index fell 0.69% lower, ending at 1,175.02.

The yen strengthened ¥101.8 against the greenback on Thursday, dragging the Japanese carmakers, Honda Motor Company Ltd. Lower by 2%, while Toyota lost 1.5%.

Japan’s gross domestic product (GDP) grew by 1.5% in the last quarter, surpassing analysts’ forecast of a rise by 1%, data from the Cabinet Office showed on Thursday.

Hong Kong’s Hang Seng index advanced 0.3% trading at 22,649.91 points, while the mainland Chinese Shanghai Composite lost 0.74% to 2,032.79 points.

China’s largest internet-provider, Tencent reported a profit of 6.46 billion yuan in the first quarter on Thursday.

South Korea’s benchmark Kospi index retreated 0.03% to 2,010.20 points, while the Australia’s S&P/ASX 200 index edged 0.14% higher closing at 5,504.00 points.


Visit www.hymarkets.com   to find out more about our products and start trading today with only $50 using the latest trading technology today.

The post Stocks Market Report 15th May appeared first on | HY Markets Official blog.

Article provided by HY Markets Forex Blog
GBPUSD Forex Trading Pivot Point Levels: Pound Sterling under 1.6800

2014.05.15 12:30 6:30AM ET | GBPUSD Currency Pair

SC GBPUSD 2014.05.15

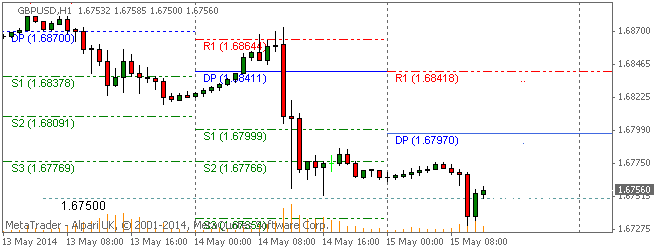
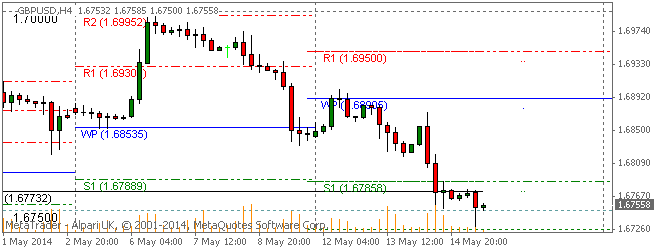
Here are the Pivot Points Levels with Support (S) and Resistance (R) for the GBPUSD currency pair today. Price action is currently trading at the 1.67560 price level and under the daily pivot point, according to data at 6:30 AM ET. The GBPUSD high for the day has been 1.67763 while the low of day has fallen to 1.67305. The pair earlier today opened the Asian trading session below the daily pivot and has continued to trend lower to the 1.6750 area.

Daily Pivot Point: 1.67970
— S1 – 1.67207
— S2 – 1.66758
— S3 – 1.65995
— R1 – 1.68419
— R2 – 1.69182
— R3 – 1.69631


Weekly Pivot Points: GBPUSD

SC GBPUSD 2014.05.15

Prices are currently trading under the weekly pivot point and below the S1 support level at time of writing. The GBPUSD has been on an overall strong bearish trend this week after opening the trading week below the weekly pivot.

Weekly Pivot Point: 1.68905
— S1 – 1.67858
— S2 – 1.67263
— S3 – 1.66216
— R1 – 1.69500
— R2 – 1.70547
— R3 – 1.71142


By CountingPips.comForex Trading Apps & Currency Trade Tools

Disclaimer: Foreign Currency trading and trading on margin carries a high level of risk and volatility and can result in loss of part or all of your investment. All information and opinions contained do not constitute investment advice and accuracy of prices, charts, calculations cannot be guaranteed.


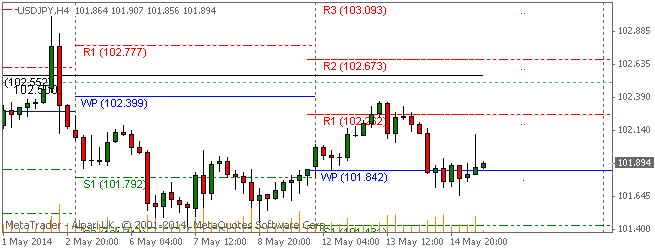
USDJPY Forex Trading Pivot Point Levels: Pair remains below 102

2014.05.15 12:30 6:30AM ET | USDJPY Currency Pair

SC USDJPY 2014.05.15

Here are the Pivot Points Levels with Support (S) and Resistance (R) for the USDJPY currency pair today. Price action is currently trading at the 101.894 price level and below the daily pivot point, according to data at 6:30 AM ET. The USDJPY high for the day has been 102.108 while the low of day has reached to 101.653. The pair earlier today opened the Asian trading session below the daily pivot and has trended slightly higher overall so far today.

Daily Pivot Point: 101.953
— S1 – 101.634
— S2 – 101.391
— S3 – 101.072
— R1 – 102.196
— R2 – 102.515
— R3 – 102.758


Weekly Pivot Points: USDJPY

SC USDJPY 2014.05.15

Prices are currently trading just over the weekly pivot point at time of writing. The USDJPY has been on an overall sideways trading path this week after opening the trading week virtually at the weekly pivot.

Weekly Pivot Point: 101.842
— S1 – 101.430
— S2 – 101.011
— S3 – 100.599
— R1 – 102.261
— R2 – 102.673
— R3 – 103.092


By CountingPips.com – Forex Trading Apps & Currency Trade Tools

Disclaimer: Foreign Currency trading and trading on margin carries a high level of risk and volatility and can result in loss of part or all of your investment. All information and opinions contained do not constitute investment advice and accuracy of prices, charts, calculations cannot be guaranteed.


EURUSD Forex Trading Pivot Point Levels: Euro drops under 1.3700

2014.05.15 12:30 6:30AM ET | EURUSD Currency Pair

SC EURUSD 2014.05.15

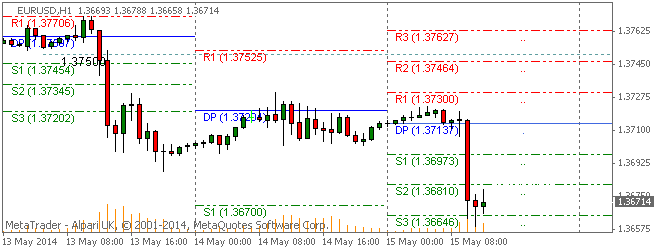
Here are the Pivot Points Levels with Support (S) and Resistance (R) for the EURUSD currency pair today. Price action is currently trading at the 1.36714 price level and under the daily pivot point, according to data at 6:30 AM ET. The EURUSD high for the day has been 1.37227 while the low of day has fallen to 1.36588. The pair earlier today opened the Asian trading session virtually on top of the daily pivot and has trended sharply lower today with prices declining to the S1 support level.

Daily Pivot Point: 1.37137
— S1 – 1.36972
— S2 – 1.36810
— S3 – 1.36645
— R1 – 1.37299
— R2 – 1.37464
— R3 – 1.37626


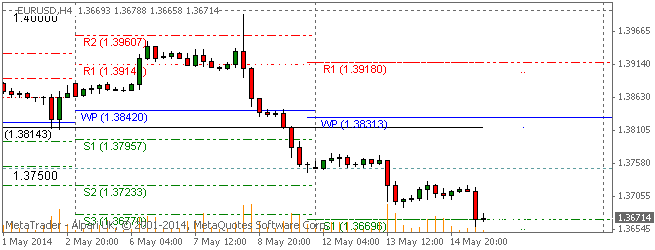
Weekly Pivot Points: EURUSD

SC EURUSD 2014.05.15

Prices are currently trading sharply under the weekly pivot point and right near the S1 support level at time of writing. The EURUSD has been on an overall bearish trend this week after opening the trading week below the weekly pivot.

Weekly Pivot Point: 1.38313
— S1 – 1.36695
— S2 – 1.35829
— S3 – 1.34211
— R1 – 1.39179
— R2 – 1.40797
— R3 – 1.41663


By CountingPips.com – Forex Trading Apps & Currency Trade Tools

Disclaimer: Foreign Currency trading and trading on margin carries a high level of risk and volatility and can result in loss of part or all of your investment. All information and opinions contained do not constitute investment advice and accuracy of prices, charts, calculations cannot be guaranteed.


Fibonacci Retracements Analysis 15.05.2014 (EUR/USD, USD/CHF)

Article By RoboForex.com

Analysis for May 15th, 2014

EUR USD, “Euro vs US Dollar”

Euro continues falling down without forming any serious corrections. Now main target is the group of lower fibo levels at 1.3595 – 1.3585. If later price rebounds from this target area, pair may start new correction.

As we can see at H1 chart, lower targets are confirmed by several fibo levels. According to analysis of temporary fibo-zones, predicted targets may be reached by the end of this week.

USD CHF, “US Dollar vs Swiss Franc”

Yesterday, Franc broke maximum. Most likely, in the nearest future pair will continue growing up towards the group of upper fibo levels at 0.8975 – 0.8995. If later price rebounds from these levels, bears may start new correction.

As we can see at H1 chart, current target area is confirmed by additional fibo levels. According to analysis of temporary fibo-zones, bulls may reach their predicted targets by Friday. During local correction, I opened short-term buy order with tight stop.

RoboForex Analytical Department

Article By RoboForex.com

Attention!
Forecasts presented in this section only reflect the author’s private opinion and should not be considered as guidance for trading. RoboForex LP bears no responsibility for trading results based on trading recommendations described in these analytical reviews.


Wave Analysis 15.05.2014 (DJIA Index, Crude Oil)

Article By RoboForex.com

Analysis for May 15th, 2014

DJIA Index

It looks like Index is still extending wave (3) with the fourth wave inside it. In the near term, correction may continue, but later instrument is expected to start moving upwards inside wave 5 of (3).

As we can see at the H1 chart, wave [5] of 3 turned out to be quite short. Most likely, during the next several days price may continue moving inside flat pattern, that’s why right now I’m staying out of the market. Critical level here is maximum of wave 1.

Crude Oil

Probably, Oil finished wave [2]. Earlier price formed bearish impulse inside the first wave. Possibly, in the nearest future instrument may start falling down inside wave [3] of 3.

More detailed wave structure is shown on H1 chart. Probably, wave [2] took the form of zigzag pattern. On minor wave level, Oil finished initial descending impulse. During local correction, I opened sell order with stop placed at maximum.

RoboForex Analytical Department

Article By RoboForex.com

Attention!
Forecasts presented in this section only reflect the author’s private opinion and should not be considered as guidance for trading. RoboForex LP bears no responsibility for trading results based on trading recommendations described in these analytical reviews.


Ukraine, US supply Impacting Oil Prices

By HY Markets Forex Blog

Investors who participate in crude oil trading should be keeping an eye on two situations at the moment – the Ukraine crisis and supply in the U.S. According to Reuters, Brent futures reached a two-week high earlier this week in response to growing tensions in Ukraine.

Russian President Vladimir Putin recently said he would pull back troops from the boarders of the two countries. However, violence has occurred since, which renews investor worries. Also, the referendum vote in Ukraine is said to have the overwhelming support of residents, which could cause major issues, as the U.S. has already said it does not support such a move.

“Prices were boosted by the escalation of the situation in east Ukraine,” analysts at Commerzbank in Frankfurt said in a report.

Recent reports have shown that the U.S has a growing supply of oil, which could put downward pressure on prices despite escalation in Ukraine. But, the American Petroleum Institute found an unexpected decline of 590,000 barrels in crude stockpiles in Cushing, Oklahoma, according to The Associated Press. The Energy Department is also expected to announce that crude supplies dropped 1.5 million barrels last week, which is the second straight drop.

If this ends up having an impact on prices, there could be steep increases in the future, as a declining supply coupled with rising tensions in Ukraine are a combination for price hikes. Moving forward, oil traders should pay close attention to U.S. supplies and Ukraine, as changes to these situations could impact how they invest.

The post Ukraine, US supply Impacting Oil Prices appeared first on | HY Markets Official blog.

Article provided by HY Markets Forex Blog
Why the Tabcorp Holdings Share Price Took a Dive Today

By MoneyMorning.com.au

What happened to the Tabcorp Holdings Share Price?

Shares in gaming and wagering company Tabcorp Holdings Ltd [ASX:TAH] sank by more than 4% today, giving up all the gains the stock had made over the previous month. Tabcorp is now hovering at what looks to be a key support/resistance level.

Why Tabcorp Holdings?

Today’s price action in Tabcorp goes to show how powerful some research analysts’ recommendations can be.

Overnight, Deutsche Bank’s research analysts cut their recommendation on Tabcorp from ‘Buy’ to ‘Hold’. The broker seems worried that Tabcorp may face pricing pressure from a potential increase in the racefields product turnover fees.

Deutsche’s crosstown rival UBS Securities noticed the same risk at the same time. Today UBS scrapped its previous ‘Neutral’ recommendation on Tabcorp, downgrading it to ‘Sell’.

When two well-known investment houses issue bearish reports on a company on the same day, the market tends to react swiftly by marking down the value of the stock.

What now for TAH?

Shareholders shouldn’t necessarily panic on this news. It’s easy to over-estimate the edge that big investment banks have over the rest of the market on stocks like this. And even if the fees go up like the brokers fear, Tabcorp can offset this cost in other parts of its business.

In any case, let’s not forget the upcoming FIFA World Cup in Brazil. That should provide Tabcorp with a welcome boost in activity.

Tim Dohrmann+
Small-Cap Analyst, Australian Small-Cap Investigator

Join Money Morning on Google+


By MoneyMorning.com.au