Wave Analysis 19.05.2014 (DJIA Index, Crude Oil)

Article By RoboForex.com

Analysis for May 19th, 2014

DJIA Index

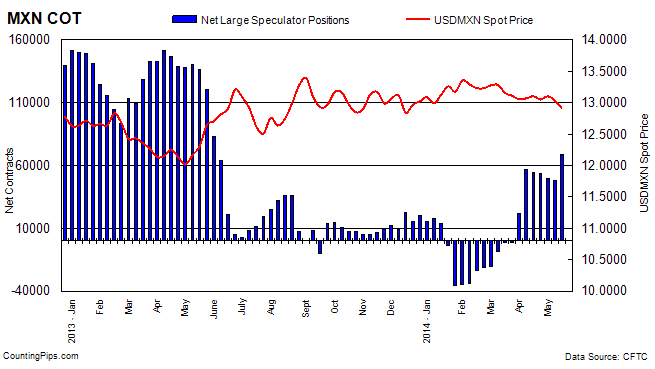
It looks like Index is still forming flat pattern inside wave (2). Earlier, price completed bullish wedge pattern inside wave (1). Later instrument is expected to complete correction and start growing up inside the third wave.

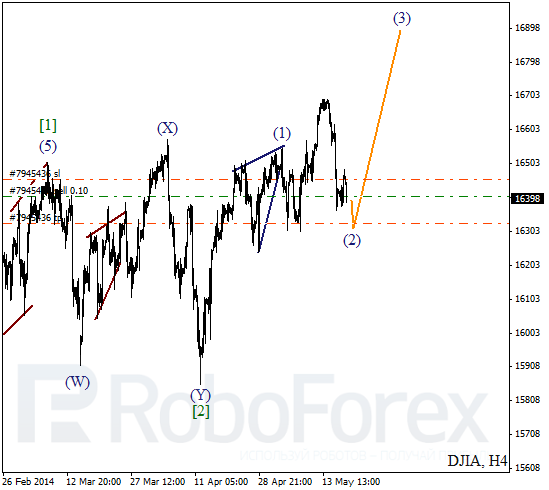
More detailed wave structure is shown on H1 chart. Probably, Index is about to finish descending impulse inside wave C of (2). Possibly, price may break minimum of wave A during the day. Later instrument may reverse and start forming initial ascending impulse.

Crude Oil

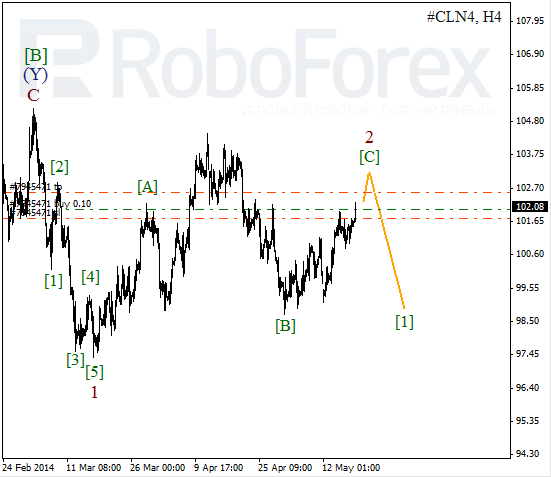
Chart structure has been changed. Probably, Oil is completing wave 2 with wave [B] in the form of flat pattern inside it. In the future, price may finish impulse inside wave [C] and reverse downwards.

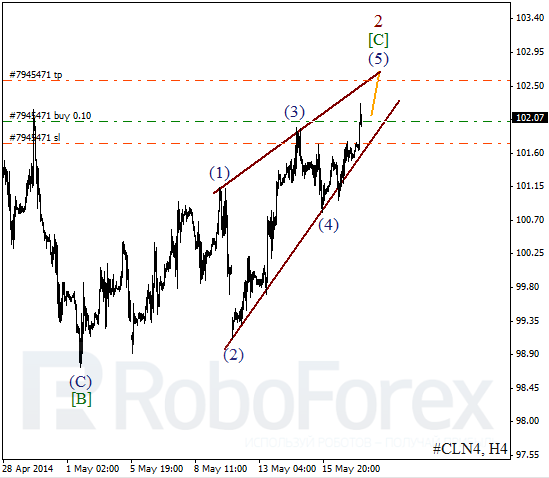
As we can see at the H1 chart, price is forming diagonal triangle pattern inside wave [C]. On minor wave level, Oil is finishing the fifth wave. I opened short-term buy order with target placed on upper border of above-mentioned pattern.

RoboForex Analytical Department

Article By RoboForex.com

Attention!
Forecasts presented in this section only reflect the author’s private opinion and should not be considered as guidance for trading. RoboForex LP bears no responsibility for trading results based on trading recommendations described in these analytical reviews.


Forex Technical Analysis 19.05.2014 (EUR/USD, GBP/USD, USD/CHF, USD/JPY, AUD/USD, USD/RUB, GOLD)

Article By RoboForex.com

Analysis for May 19th, 2014

EUR USD, “Euro vs US Dollar”

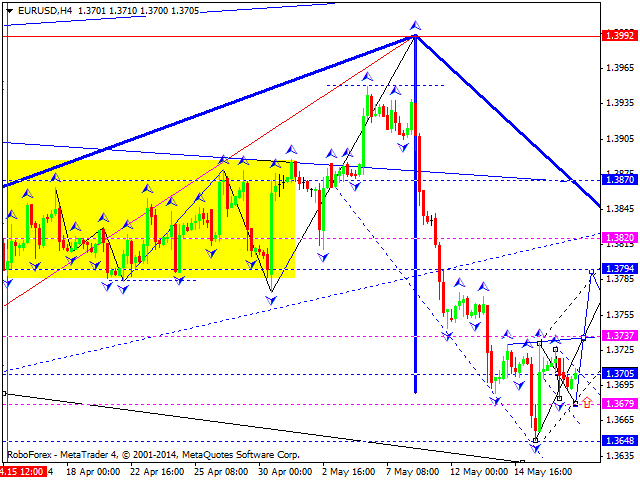
Euro is still forming correctional flag pattern towards previous ascending impulse. We think, today price may continue falling down to reach target of this pattern at level of 1.3680 and then start another ascending structure towards level of 1.3800.

GBP USD, “Great Britain Pound vs US Dollar”

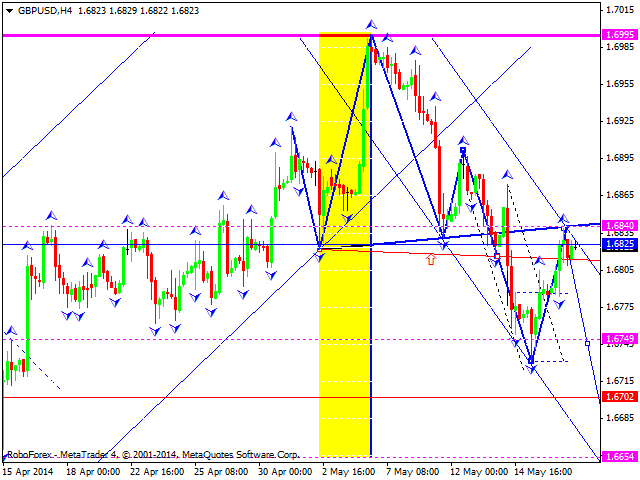
Pound is still moving below level of 1.6825; this movement may be considered as the fifth descending structure to complete current correction with target at level of 1.6655. Later, in our opinion, instrument may form reversal structure to continue moving upwards.

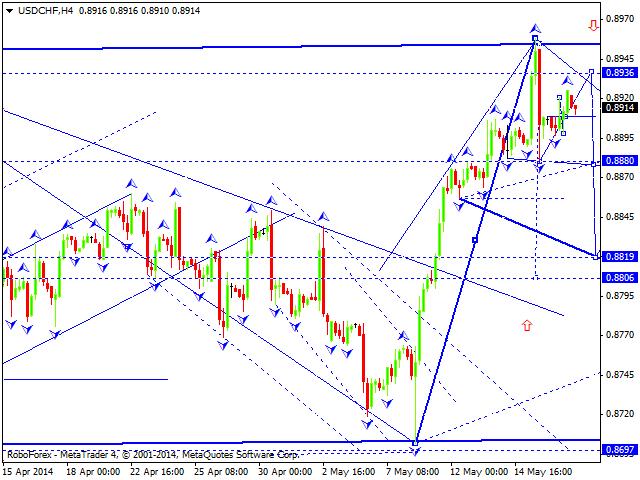
USD CHF, “US Dollar vs Swiss Franc”

Franc is growing up; this movement may be considered as ascending correction towards previous descending impulse. We think, today price may reach level of 0.8935 and then continue falling down to break level of 0.8880 and reach target at level of 0.8820.

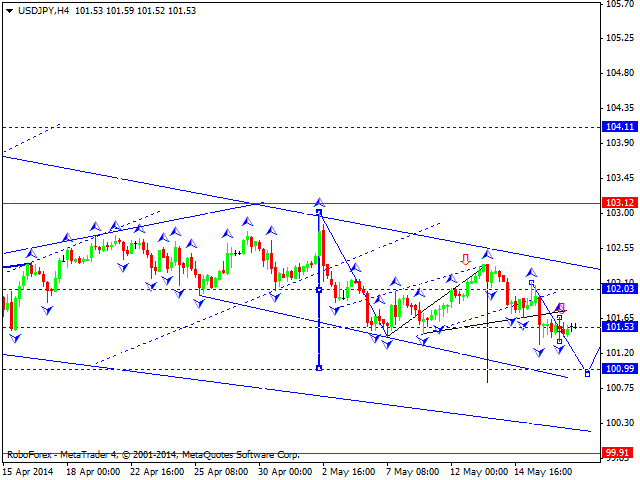
USD JPY, “US Dollar vs Japanese Yen”

Yen is still consolidating near level on 101.50. We think, today price may fall down to reach level of 101.00 and then grow up towards level of 102.00. Later, in our opinion, instrument may complete this descending wave by forming another descending structure towards level of 100.00.

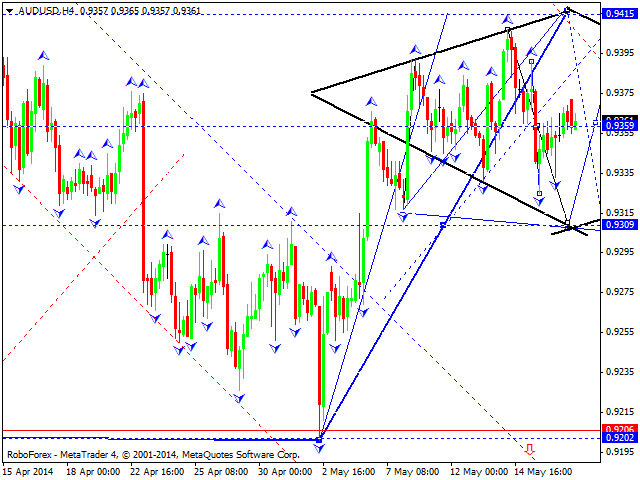
AUD USD, “Australian Dollar vs US Dollar”

Australian Dollar is moving inside wide consolidation channel. We think, today price may continue forming this descending structure with target at level of 0.9305. Later, in our opinion, instrument may start another ascending movement to reach level of 0.9415 and then continue falling down.

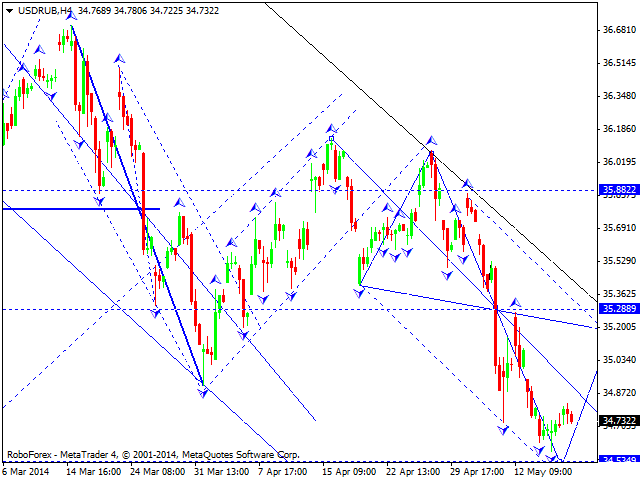
USD RUB, “US Dollar vs Russian Ruble”

Ruble continues falling down towards level of 34.54. After reaching it, instrument may start growing up to reach level of 35.15 (at least) and then complete this descending wave by forming another descending structure with target at level of 34.50.

XAU USD, “Gold vs US Dollar”

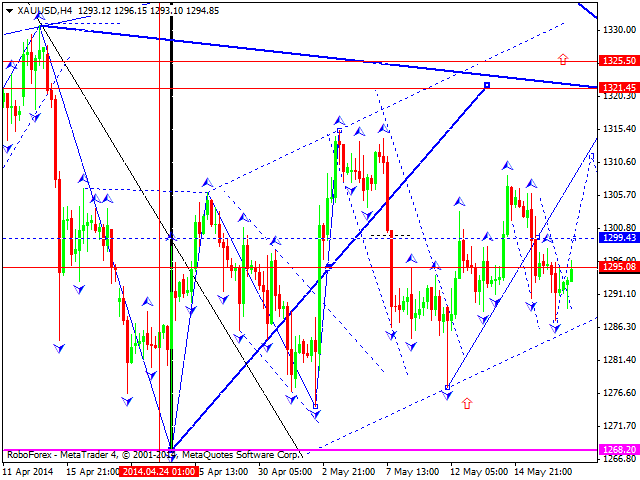
Gold completed correction and right now is moving inside ascending structure with target at level of 1321. After reaching it, price may form consolidation channel and form continuation pattern to continue growing up.

RoboForex Analytical Department

Article By RoboForex.com

Attention!
Forecasts presented in this section only reflect the author’s private opinion and should not be considered as guidance for trading. RoboForex LP bears no responsibility for trading results based on trading recommendations described in these analytical reviews.


USD/JPY: Inside Bar Breakout Setup In Play

Market Sentiment: Bearish

Key Takeaways:

  • USD/JPY holds off long term trendline support
  • A classic inside bar breakout trade setup emerges on the daily chart
  • Japan’s machinery orders increase unexpectedly

USD/JPY extended upside movement on Monday after closing above the major trendline support last week. The pair is expected to find huge support around the current levels. The sentiment has turned to bearish due to Lower Low (LL) on the daily chart.

Technical Analysis

As of this writing, the pair is being traded near 101.56. A support can be noted around the lower trendline as demonstrated in the following chart. A break and daily closing below the lower trendline channel could push the pair into negative territory, opening doors for a correction below the 100.00 support area.

Chart USDJPY, D1, 2014.05.19 03:08 UTC, Capital Trust Markets, MetaTrader 4, Real
On the upside, the pair is expected to face a hurdle near 102.00, the confluence of 38.2% fib level and psychological number ahead of the upper trendline channel as shown in the above chart. A daily closing above the upper trendline could incite a renewed buying interest, opening doors for 103.32.

Japan Machinery Orders

The machinery orders in Japan increased surprisingly to 16.1% in April as compared to 10.8% in the same month of the year before, up beating the average forecast of just 4.2% increase, a report by the Cabinet Office of Japan revealed today. Generally speaking, higher machinery orders are considered positive for the economy and bearish for USD/JPY.

Trade Ideas

USD/JPY formed a classic inside bar breakout trader setup on Friday. Traders tend to place buy limit and sell stop orders to take advantage from inside bar setups. Considering the recent surprise increase in the Japan’s Gross Domestic Product (GDP), the pair might come under renewed selling pressure threatening the 100.00 handle.

 Prepared by Usman Ahmed, Chief Currency Strategist at Capital Trust Markets


Why the Goodman Fielder Share Price Took off Today

By MoneyMorning.com.au

What Happened to the Goodman Fielder Share Price?

Shares of Goodman Fielder Ltd [ASX:GFF] gained 3.8% Monday, closing at its highest level this year.

Why Did this Happen to the GFF Share Price?

The company’s board voted to accept a takeover bid from Singapore’s Wilmar International Ltd and Hong Kong’s First Pacific Co. The takeover bid is at 70 cents, an increase over the 65 cent bid the Goodman Fielder board had previously rejected.

The new bid values the company at $1.37 billion.

What now for Goodman Fielder?

The Wilmar and First Pacific bid appears to be a classic case of investment opportunism. The Goodman Fielder share price took a hammering in early April when the company revealed that earnings would be up to 15% lower than analysts’ expectations.

This news saw the share price sink to a low of 47.5 cents per share, the lowest share price for the company’s shares since mid-2012.

There doesn’t seem to be much chance of the takeover not going through. Two big funds management groups have already indicated that they plan to accept the offer. And with the share price down more than 74% since the top in 2008, it’s unlikely that investors will ignore this opportunity to get out now before things potentially get worse for the share price.

Cheers,
Kris+

Join Money Morning on Google+


By MoneyMorning.com.au

Why the Bradken Share Price Got Belted Today

By MoneyMorning.com.au

What Happened to the Bradken Share Price?

Shares in mining equipment provider Bradken Ltd [ASX:BKN] saw more than 7% of their value wiped out today. At $3.62, Bradken shares are now languishing close to five-year lows.

Why Did this Happen to the BKN Share Price?

This morning the company warned that its earnings for the year ending 30 June 2014 would be significantly lower than it had previously forecasted.

Australia’s mining services companies have endured a tough run in the years since investors started factoring in a cooling resources sector. But today’s announcement from Bradken underlined just how challenging this market is for companies whose fortunes are linked to the booms and busts of mineral wealth.

Bradken has had to cut its costs dramatically to stay viable. Today the company announced a once-off restructuring charge of $51.4 million before tax in the current financial year. Most of that charge relates to redundancy costs…and on the flipside, most of Bradken’s future cost savings will come from having a smaller workforce.

Markets will often give companies the benefit of the doubt when they announce one-off charges like this. But when they’re accompanied by a profit downgrade and a statement that the company foresees no short to medium term improvement in its markets, investors tend to take that as a pretty bad sign.

What now for Bradken Ltd?

You should view Bradken shares as a high-risk investment. It’s hard to accurately forecast the extent to which mining activity will slow down, and when companies in this sector are going through a phase of lowering investors’ expectations, it’s the ‘picks-and-shovels’ mining services companies whose share prices get crunched harder than the big boys like BHP Billiton Ltd [ASX:BHP] or Rio Tinto Ltd [ASX:RIO].

But as soon as investors see light at the end of the tunnel, mining services stocks like Bradken should rebound in a major way. It’s more a case of ‘when’ rather than ‘if’.

It takes plenty of ticker to wade in and buy these stocks when they’re on their knees. But investors who time the cycle correctly can make great profits in stocks like Bradken.

Tim Dohrmann+
Small-Cap Analyst, Australian Small-Cap Investigator

Join Money Morning on Google+


By MoneyMorning.com.au

Why the Rio Tinto Share Price Fell Today

By MoneyMorning.com.au

What Happened to the Rio Tinto Share Price?

Shares of Rio Tinto [ASX:RIO] dropped by 2.99% on Monday, closing at $60.10. This is the lowest price it’s been since 3rd September 2013.

Why did this Happen to the Rio Tinto Share Price?

Rio Tinto Ltd is the world’s third largest miner. It’s known for its high quality and large scale iron ore operations, located in the Pilbara region of Western Australia.

In terms of scale and size, Rio produces around 23% of the world’s total iron ore traded by sea (seaborne market).

RIO enjoys a high profit margin, boasting an average cost of roughly AU$46 per tonne. This is the lowest cost for any miner in the world.

Nonetheless, Rio is still seen as a play on the iron ore price. The iron ore price has fallen over 26% for the year, and now sits at US$102.80 per tonne.
As such, Rio has seen its share price weaken from above $71 in February to just over $60 today.

What now for Rio Tinto?


RIO has recently reached its long-term ore production goal of 290 million tonnes per year. It’s now focussed on its 360 expansion plan, aiming to mine 360 million tonnes of iron ore per year.

Furthermore, the company has been committed to paying down debt and further strengthen its balance sheet. Since 2013, net debt has been reduced by US$4 billion to roughly $US18 million today.

The company is also on track to slash its capital expenditure to US$8 billion by 2015; this would be nearly halve its 2012 level.

Fundamentally, Rio Tinto is fast becoming an extremely shareholder friendly company.

Nonetheless, if iron ore continues to fall, the share price could see itself slipping into the high $50’s shortly.


By MoneyMorning.com.au

Sometimes it’s Best to Not Look Inside the ‘Investing Sausage’

By MoneyMorning.com.au

There’s an old saying attributed to the former German chancellor Otto von Bismarck, ‘Laws are like sausages, it is better not to see them being made.

Whether Bismarck actually said that or not doesn’t matter.

It’s the words, not the source of the words, that’s important.

The point is that sometimes it’s better if you don’t know what goes on behind the scenes. Sausages are delicious. But maybe you wouldn’t feel that way if you could see the ‘ingredients’.

But that’s not unique to sausages. You can apply this saying to other scenarios. For instance, financial markets…

The Financial Times reports that the head of the investment bank unit at Deutsche Bank has sent a video message to the bank’s traders. He wants them to stop being so boorish:

Let’s be clear: our reputation is everything. Being boastful, indiscreet and vulgar is not OK. It will have serious consequences for your career. And, I have lost patience on this issue.

No doubt the top brass at Deutsche Bank had plenty of patience until six years ago. Back then investment bank traders could be as boorish as they liked…as long as the ‘tills kept ringing’.

That’s changed. But it’s not the behaviour that really unsettles the head honchos. Rather, they’re afraid that internal messages will become public during an investigation by regulators.

In other words, the bankers want you to accept the investment banking ‘sausage’, but they don’t want you to see what goes into making the investment banking ‘sausage’.

They most certainly don’t want you to know about the interest rate and market manipulation that takes place on a daily basis, for which the big banks are now under scrutiny.

Suits, shirts and silk ties

Regulators in the US, UK and Europe are investigating and fining some of the world’s biggest banks for interest rate manipulation.

Last year European regulators fined eight banks a total of EU€1.7 billion for forming illegal cartels to fix interest rates.

Bad boys. But it had been going on for years. Only when they couldn’t hide it anymore did the regulators start to take an interest.

The point is that sometimes financial markets aren’t as clean cut and orderly as people would like to think. The sharp suits, fancy shirts and silk ties disguise a breed of person you probably wouldn’t want to marry your daughter.

They’re boorish, rude, and vulgar. But they make their employers — the investment banks — a lot of money.

Like it or not, it’s an attitude that regular investors need to take with financial markets. There’s no room to be polite when investing. The goal of investing is to use the circumstances to your advantage to make money.

That sometimes may mean taking decisions that you otherwise may prefer not to take. For example, investing in fossil fuel or tobacco companies. It’s a subject we wrote about in Money Morning on 9th May. We received a number of negative letters in response.

In that edition we said that investors can’t afford to think about ethics when investing. We drew a parallel with the campaign against tobacco companies in the 1990s and 2000s. Back then the big US university endowment funds began selling their tobacco shares.

From an investment perspective it was a big mistake. Companies like British & American Tobacco [LON:BATS] gained 533% in the years after. Reynolds American [NYSE:RAI], another big tobacco company, gained 596%.

Today, the university endowments are making the same mistake. This time with fossil fuels. Rather than investing to maximise returns they’re investing to please the green lobbyists. It’s a decision they’ll likely regret as fossil fuels continue to be a key fuel for economic growth.

The ‘human haters’ react

But as we say, not everyone agrees with this view. Money Morning reader Scott wrote to say:

With regards to tobacco investing, “cute move” you say – how about tobacco kills, is the biggest preventable cause of death, and as such, would it not be wise to not support such an industry?

Same with fracking. We humans know very little in the scheme of the universe, but we are great at raping and destroying what we do know.

So you propose we support this? What is the real science and what are the consequences? Where do we go when we have destroyed this planet? Why aren’t alternative energy sources being developed quicker?

It’s typical of the responses we expect from ‘human haters’. Far from destroying the planet, the human race has done more than any other species in history to improve and develop its surroundings to create a more comfortable standard of living.

Is there another species on the planet that has managed to triple the average life expectancy of its own members? Not that we know of. Humans have done that because of the ability to take risks, make decisions and use technology.

But what about the idea that we should consider the ‘real science’ and ‘consequences’ of fracking? Well, you can thank your lucky stars that the original great wildcatting oil explorers of the 19th and early 20th century didn’t consider the ‘science’ and ‘consequences’ when they discovered and exploited oil in Texas and Pennsylvania.

Investing isn’t always pretty

If they had stopped to think about the environmental impact where would the world be today? You most likely wouldn’t be reading this letter online. You most likely wouldn’t have that nice car, or be able to take an electric-powered train to work.

You probably wouldn’t have fast transport such as intercontinental air travel, or other technologies that have come about either directly or indirectly due to the discovery of oil or other chemicals — plastics, paints, synthetic clothing, TVs, whitegoods, and so on.

In fact, if it wasn’t for oil and gas, it’s more likely than not that the world would have kept using to a greater extent than it does today another type of fossil fuel that had been used by humans for millennia — coal.

Now that’s what we call irony.

Bottom line: investing isn’t always pretty. Like the sausage factory, sometimes it’s best if you don’t peek inside. But one thing is undeniable. As an independent investor it’s up to you to make the investment decisions that can help you achieve your investing goals.

For the past 100 years oil has been one of the best investments. And that isn’t likely to change for the next 100 years…whatever the green lobbyists like to think.

Cheers,
Kris+

Join Money Morning on Google+


By MoneyMorning.com.au
Wealth and Happiness: The Other Wealth Effect

By MoneyMorning.com.au

Central bankers around the world have broken the taboo of printing money one after the other since the global financial crisis. Their aim was to pump the stock market higher to make investors feel richer. This concept was named ‘the wealth effect’.

Did it work? I’m far from sure. The economy in the US and Europe is still barely bumbling along.

But you’re not an economy. You’re you. So let’s explore how wealth affects you as an individual.

How are wealth and happiness related? There are studies showing every possible answer. Wealth makes you happy, or unhappy. Happiness makes you intrinsically wealthy and makes you stop caring about wealth. Some studies say the two are entirely unrelated.

So economists and psychologists are as clueless as they are confident in their conclusions. If you would like to be famous, the easiest way might be to become an academic and ‘discover’ the opposite of whatever the day’s conventional wisdom is on this topic. The latest studies, by the way, showed happiness and wealth are inextricably linked without limit. The richer you get, the happier you’ll be.

What confounds any attempt to study the links between wealth and happiness is that people perceive happiness differently. Some people don’t want to worry about things — they want to be content and not much more. Others want a more emotionally volatile life with all the ups and downs. These types of differences interfere with how economists calculate happiness and even wealth.

For example, there are plenty of people who view wealth as an end, not merely a means. Others become distressed at the responsibility of managing wealth. The difference in how these two groups of people perceive the link between wealth and happiness completely confuses any economist trying to study that link.

Making your personal wealth a matter of interest — like a hobby you take seriously — is perhaps the surest way to building a financially prosperous retirement. That’s not always easy to do. And it’s not for everyone. But if you do have that interest, foster it. Your spouse and friends might call you greedy. But their views are most likely driven by fear of having to deal with their own financial ‘obligations’. If you can turn those obligations into a challenge like a sailing race or a golf handicap, then you’ll get better and probably wealthier.

The fact that you’re reading this tells me you’ve probably decided to take an interest in your wealth and take charge. So I should also mention the dangers of linking your happiness to your wealth.

The first part is obvious. If your wealth takes a hit, it can damage your happiness. If this happens, your mental state could end up damaging your wealth even further. So you have to be honest with yourself and prepared. How would a bad result affect you?

Secondly, your relationships can suffer when managing your wealth becomes a large part of your life. Your spouse might not share your enthusiasm, or may disagree with your decisions. Decisions on spending and which lifestyle opportunities to make the most of can be very divisive. This is why lottery winners tend to struggle in their personal relationships. Suddenly being able to do and buy anything brings up differences in people’s priorities. Of course, friendships can also suffer due to differences in wealth.

How to Link Wealth and Happiness

The good thing about how clueless economists are about the effect of wealth on happiness (or the other way around) is that you can decide to control it. I think you should decide for yourself that your money will make you happy and being happy means making more money. 

The first step is taking a measured interest, as I mentioned. Your wealth is your responsibility. It’s very easy to sabotage yourself in a way that lets you blame others. ‘It was the financial advisor’s fault,’probably won’t be good enough for your future self’s happiness.

By ‘measured’ I mean that your happiness cannot be dependent on the amount of wealth you have. I think your enjoyment of managing your own wealth should come from the feeling of independence, pride, and acceptance that any mistakes are your own. Of course, the successes will be too. And your chances of success are higher if you take an interest.

Of course, this isn’t for everyone. If you know that managing your wealth may affect your happiness badly, taking on a different role could be a better option. Closely overseeing a trusted financial advisor’s decisions might help you distance yourself enough without losing the benefits of taking charge.

Nick Hubble+
Contributing Editor, Money Morning

Ed Note: The above article is an edited extract from The Money for Life Letter, Nick Hubble’s retirement-focussed investment newsletter.

Join Money Morning on Google+


By MoneyMorning.com.au
Monetary Policy Week in Review – May 12-16, 2014: ECB easing in June seen as a question of how and what, not if

By CentralBankNews.info
    Last week in global monetary policy, Armenia’s central bank cut its policy rate while four other banks maintained rates as it became clear that it is no longer a question of whether the European Central Bank (ECB) will ease policy, but just what tools it will decide to use.
    The ECB council has already twice discussed how to respond to powerful disinflationary forces and will be armed with the latest forecasts on June 5 when the final decision is taken.
    ECB President Mario Draghi began preparing financial markets and investors for easier policy on April 3 when the council for the first time “had a very rich and ample discussion” of unconventional measures along with rate cuts.
    The council continued its discussion during its May 8 meeting when Draghi took another step toward preparing markets for a move when he said the ECB council “is comfortable with acting next time,” but still wanted to wait for the latest quarterly forecasts.
    Since then the economic outlook for the euro zone has weakened and although inflation rose slightly in April, it remains far below the ECB’s objective of just under 2 percent, providing Draghi with fresh ammunition.
    Inflation in the 18-nation euro zone in April was 0.7 percent, stuck below 1.0 percent since October, and the economy expanded by only 0.2 percent in the first quarter of 2014 from the previous quarter, about half the pace economists expected.
    In its forecast from March, the ECB already trimmed its 2014 inflation forecast to 1.0 percent and even by 2016 inflation is only expected to rise to 1.5 percent, still below the ECB target. The forecast for 2014 economic growth was revised upwards to 1.2 percent but the weak first quarter may not put that into question.

    The drumbeat of speculation over the ECB’s expected response to recent data and new forecasts culminated on Wednesday.
     A report from the Reuters news agency said ECB staff has prepared a package of options for the June council meeting, including cuts in all interest rates and measures aimed at boosting lending to small and medium-sized firms, the backbone of the euro zone’s troubled economy.
    Reuters quoted sources saying that a June rate cut “is more of less a done deal,” involving cuts of 10 to 20 basis points in all rates, including the 0.25 benchmark refinancing rate and the zero percent deposit rate, which would push it into negative terrain, a first for a major central bank.
    Then on Thursday, ECB Executive Board member Yves Mersch essentially confirmed the report, telling journalists the ECB was preparing for possible deployment of more tools than “might even strike the most fertile imagination of journalists” who would get a “very precise answer” to the exact nature of these measures after the next council meeting.
    Apart from boosting growth and inflation, the ECB is hoping a round of stimulus would help take the steam out of the euro currency.
    In recent months, ECB policy makers have been unusually vocal about exchange rates, concerned that a strong euro is suppressing inflation by holding down import prices and also making euro area exports less competitive internationally.
    The single currency appears to have gained strength from a return of investors’ appetite for bonds from the euro zone periphery countries and a belief that the economy is finally turning the corner.
    Since early July 2013, the euro had been appreciating steadily from around 1.28 in against the U.S. dollar around 1.394 on the morning of May 8, a gain of almost 8 percent.
    But Draghi’s signal of likely ECB easing in June appears to have the steam out of the euro for now. On Friday the euro was quoted at 1.369, down 1.80 percent since early May 8.
   
    Through the first 20 weeks of this year, central banks have now cut policy rates 19 times, or 10 percent of this year’s 190 monetary policy decisions by the 90 central banks followed by Central Bank News.
    But policy rates have also been raised 17 times, or 9.0 percent, a sign that that this year’s trend toward higher rates is still intact though it has weakened in recent weeks, just as investors’ optimism over the strength of the global economy has dampened.

LIST OF LAST WEEK’S CENTRAL BANK DECISIONS:

TABLE WITH LAST WEEK’S MONETARY POLICY DECISIONS:

COUNTRYMSCI     NEW RATE           OLD RATE        1 YEAR AGO
MOZAMBIQUE8.25%8.25%9.50%
ARMENIA7.25%7.50%8.00%
CROATIAFM5.00%5.00%6.25%
CHILEEM4.00%4.00%5.00%
PAKISTANFM10.00%10.00%9.50%
    This week (Week 21) five central banks will be deciding on monetary policy, including Nigeria, Iceland, Japan, Turkey and South Africa.
TABLE WITH THIS WEEK’S MONETARY POLICY DECISIONS:

COUNTRYMSCI             DATE CURRENT  RATE        1 YEAR AGO
NIGERIAFM20-May12.00%12.00%
ICELAND21-May6.00%6.00%
JAPANDM21-May                 N/A                 N/A
TURKEYEM22-May10.00%4.50%
SOUTH AFRICAEM22-May5.50%5.00%

Currency Speculators turned bullish on US Dollar bets, Euro drops to the bearish side

By CountingPips.com

cot-values

The latest data for the weekly Commitments of Traders (COT) report, released by the Commodity Futures Trading Commission (CFTC) on Friday, showed that large traders and speculators turned around their bets to become bullish on the US dollar last week.  The previous four weeks had seen speculators and traders on the bearish side.

Non-commercial large futures traders, including hedge funds and large International Monetary Market speculators, had an overall US dollar long position totaling $4.51 billion as of Tuesday May 13th, according to the latest data from the CFTC and calculations by Reuters. This was a weekly change of +$6.54 billion from the -$2.03 billion total short position that was registered on May 6th, according to Reuters that totals the US dollar contracts against the combined contracts of the euro, British pound, Japanese yen, Australian dollar, Canadian dollar and the Swiss franc.

The US dollar aggregate bullish position is the highest USD level since March 11th when total bullish contracts equaled +$10.56 billion.  The bullish gain of $6.54 billion was the largest weekly increase since November 12th 2013 when positions jumped by $7.44 billion for the week.

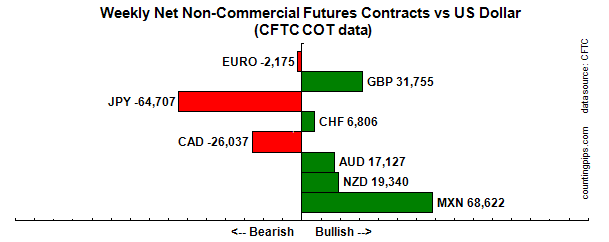
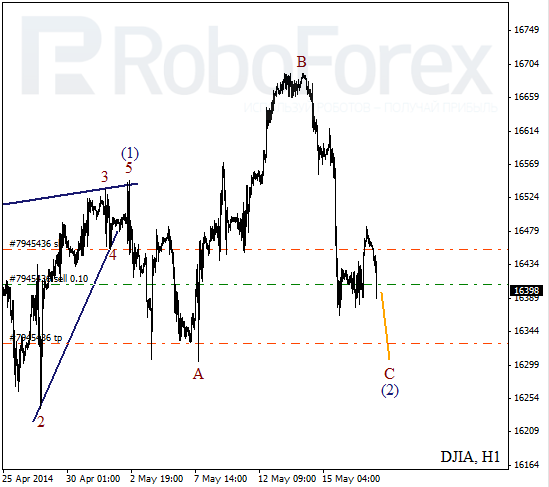
Overall for the week against the other major currencies, speculators bet in favor the Canadian dollar, Australian dollar and the Mexican peso last week while there were weekly declines for the euro, British pound sterling, Japanese yen, Swiss franc and the New Zealand dollar.


cot-standings

Notable changes:

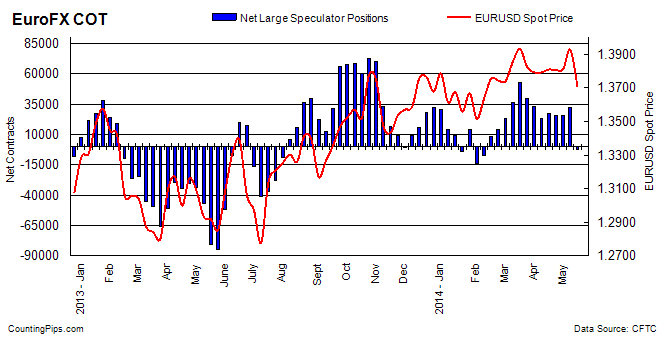
  • Euro positions fell sharply over to the bearish side for the first time since February 2nd as the European Central Bank suggested they were open to easing monetary policy in June
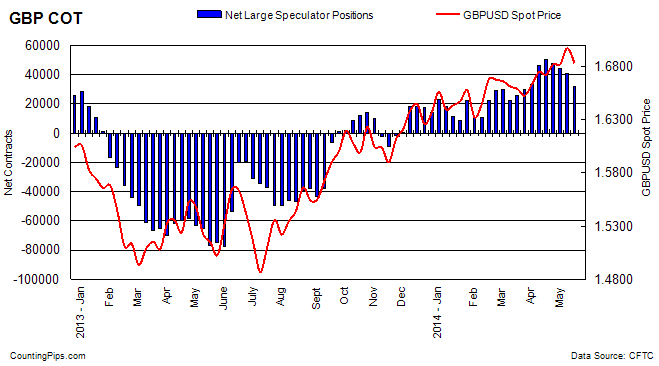
  • British pound sterling positions fell for a 4th straight week after reaching a multi-year high on April 15th
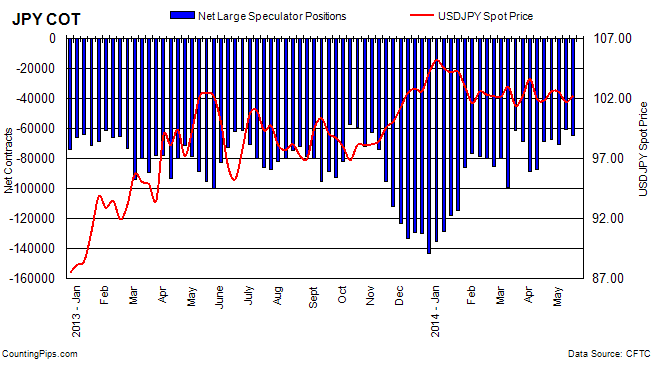
  • Japanese Yen net positions added bearish positions after touching the lowest bearish level since October 15, 2013 the previous week
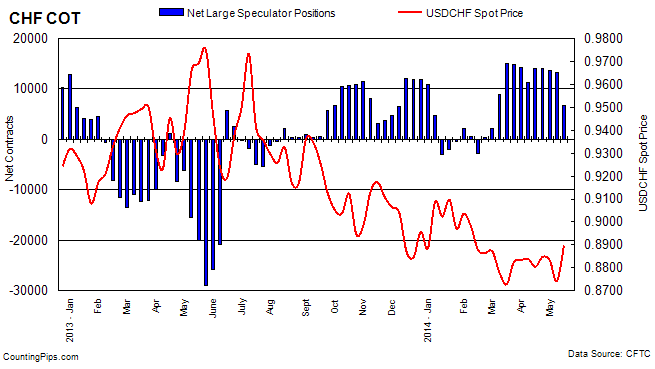
  • Swiss franc bullish positions declined by roughly half last week to +6,806 contracts
  • Australian dollar net positions rose to their best level since April 30th 2013 after turning bullish on April 8th
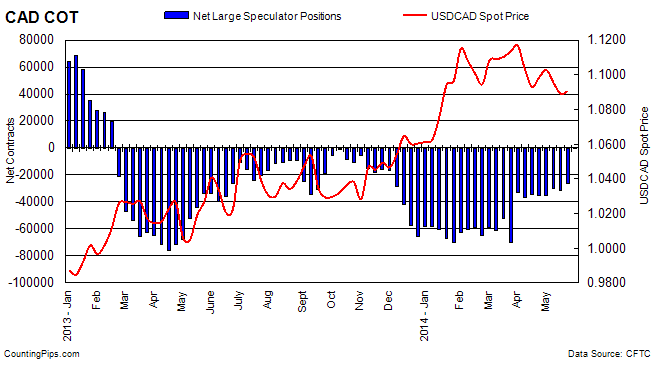
  • Canadian dollar positions, still bearish at -26,037 contracts, stood at the least bearish position since November 2013


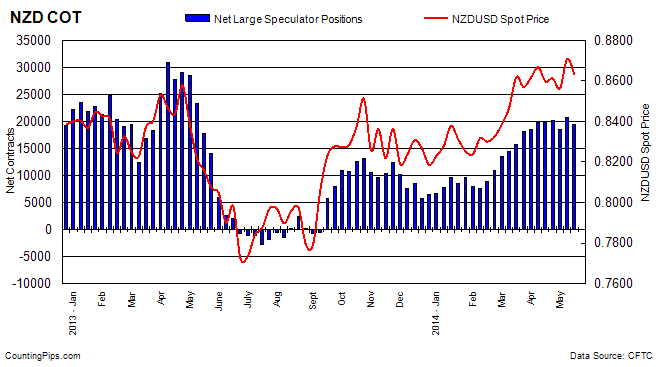
* All currency positions are in direct relation to the US dollar where, for example, a bet for the euro is a bet that the euro will rise versus the dollar while a bet against the euro will be a bet that the dollar will gain versus the euro. Please see charts and data below.


Weekly Charts: Large Speculators Weekly Positions vs Currency Spot Price

EuroFX:

eurofx

Last Six Weeks data for EuroFX futures

DateOpen InterestLong SpecsShort SpecsLarge Specs NetWeekly Change
04/08/2014261439926356933523300-9938
04/15/201427072210625278564276884388
04/22/20142662591012047543025774-1914
04/29/20142715151022857655125734-40
05/06/201427701311067378122325516817
05/13/20142681428438386558-2175-34726


British Pound Sterling:

gbp

Last Six Weeks data for Pound Sterling futures

DateOpen InterestLong SpecsShort SpecsLarge Specs NetWeekly Change
04/08/201422666791642451654647712905
04/15/20142266888747236874505984121
04/22/2014237055896924189247800-2798
04/29/2014236030859134167944234-3566
05/06/2014241264837944314840646-3588
05/13/2014230333711683941331755-8891


Japanese Yen:

jpy

Last Six Weeks data for Yen Futures

DateOpen InterestLong SpecsShort SpecsLarge Specs NetWeekly Change
04/08/201418181413340100802-874621176
04/15/20141648431435183067-6871618746
04/22/20141656741656483807-672431473
04/29/20141688201384684198-70352-3109
05/06/20141670932038181109-607289624
05/13/20141647071747182178-64707-3979


Swiss Franc:

chf

Last Six Weeks data for Franc futures

DateOpen InterestLong SpecsShort SpecsLarge Specs NetWeekly Change
04/08/20144475219275794011335-2896
04/15/201448976239059839140662731
04/22/20144688821732770914023-43
04/29/20144742421960825713703-320
05/06/201455538251021191813184-519
05/13/20144528216951101456806-6378


Canadian Dollar:

cad

Last Six Weeks data for Canadian dollar futures

DateOpen InterestLong SpecsShort SpecsLarge Specs NetWeekly Change
04/08/20141203362870463011-343072687
04/15/20141195252828863714-35426-1119
04/22/20141187072752962984-35455-29
04/29/20141235893009360388-302955160
05/06/20141222872804459644-31600-1305
05/13/20141216322698653023-260375563


Australian Dollar:

aud

Last Six Weeks data for Australian dollar futures

DateOpen InterestLong SpecsShort SpecsLarge Specs NetWeekly Change
04/08/201496887376303432033108190
04/15/201498933404633236680974787
04/22/20141076964954033170163708273
04/29/2014109934500193931310706-5664
05/06/201410493644805361688637-2069
05/13/20141073025014733020171278490


New Zealand Dollar:

nzd

Last Six Weeks data for New Zealand dollar futures

DateOpen InterestLong SpecsShort SpecsLarge Specs NetWeekly Change
04/08/201432898265216755197661286
04/15/2014331002667168241984781
04/22/20143257926056588120175328
04/29/20142985822979449918480-1695
05/06/201433025250274334206932213
05/13/20143093223806446619340-1353


Mexican Peso:

mxn

Last Six Weeks data for Mexican Peso futures

DateOpen InterestLong SpecsShort SpecsLarge Specs NetWeekly Change
04/08/201413033170371138705650134717
04/15/2014131412710381680154237-2264
04/22/2014128932683291481853511-726
04/29/2014128100680731845549618-3893
05/06/2014146455676631977947884-1734
05/13/201414920986137175156862220738


*COT Report: The weekly commitment of traders report summarizes the total trader positions for open contracts in the futures trading markets. The CFTC categorizes trader positions according to commercial hedgers (traders who use futures contracts for hedging as part of the business), non-commercials (large traders who speculate to realize trading profits) and nonreportable traders (usually small traders/speculators).

The Commitment of Traders report is published every Friday by the Commodity Futures Trading Commission (CFTC) and shows futures positions data that was reported as of the previous Tuesday (3 days behind).

Each currency contract is a quote for that currency directly against the U.S. dollar, a net short amount of contracts means that more speculators are betting that currency to fall against the dollar and a net long position expect that currency to rise versus the dollar.

(The graphs overlay the forex spot closing price of each Tuesday when COT trader positions are reported for each corresponding spot currency pair.)

See more information and explanation on the weekly COT report from the CFTC website.


Article by CountingPips.comForex Apps & News