Retirement Guard Duty 101

By Dennis Miller, millersmoney.com

I was just a kid—barely wet behind the ears. At two minutes before midnight, the sergeant of the guard and I marched onto the runway tarmac. Following protocol, I formally relieved the previous guard of his post.

This was mid-July at the Marine Corps Air Station in Yuma, Arizona. For the next four hours, dressed in combat fatigues, I carried an (unloaded) M-1 rifle.

I was left with nothing but my own thoughts: it was hot, and I was glad I’d filled my canteen. I tapped my boot toe in the asphalt expansion strips and it splashed like mud.

My mentors were grizzled WWII and Korean War veterans eager to instill lessons and habits that might someday keep us young marines alive. Falling asleep on guard duty was subject to court-martial. During wartime, you could find yourself in front of a firing squad. A lot of people depend on the guard to do his job.

Fortunately, the only enemies I encountered were a few cockroach brigades—I stopped counting after eliminating over 300 or so. It’s too bad the Marine Corps doesn’t issue Truly Nolen weapons of mass destruction. That would have been much more efficient than the toe of my boot.

The lessons I learned on guard duty still hold up over half a century later. I regularly hear from loyal subscribers. I must admit, it feels wonderful when they write to thank us for a profitable recommendation. It also drives home the enormity of our responsibility—our subscribers are paying for our advice and investing right along with us. Just like my days as a young marine, I hope a lot of people are sleeping well while our team vigilantly stands guard.

As your guard, I have to warn that a storm may be approaching. I recently combed through my reading pile and selected a few of the most poignant warnings:

In “12,000 Stocks to Sell Now,” published in the February edition of The Casey Report, Terry Coxon warned that we should expect Federal Reserve tapering to have a negative effect on the market. Terry writes:

“By the current price/sales ratio, stocks look considerably more expensive. …

Stocks have been living on QE. What happens to them when QE runs out? …

The economy and the markets are in the hands of physicians who have decided to bleed the patient, but have only the roughest notion of how to tell when they have bled him enough. The therapy may or may not turn out to be deadly for the economy, but you should expect it to continue long enough to damage the stock market, because the governors of the Federal Reserve now have no option but to choose a lesser evil over a greater one.”

Andrew Huszar, former member of the Federal Reserve and former managing director at Morgan Stanley, echoed Terry’s thoughts in an interview for King World News. Huszar, who implemented QE1 for the Federal Reserve, said:

“The volatility in the markets will be a rollercoaster ride. If the Fed really sticks to its guns, I think we could see a 20% – 30% sell-off in the US (stock) market pretty easily in the course of a few months. …

But there is a larger issue, which is that… there are people within the Fed who have market experience, but these are not professional traders. And now the Fed has really expanded its involvement across the credit curve in the largest bond markets in the world.

That requires a level of expertise they don’t have. … So there is a real question as to whether the Fed really is qualified to be playing this role, and whether it is going to be able to manage exiting what is the most ambitious experiment in financial market history.”

Just how much of an experiment is Huszar talking about? The editors at Zero Hedge have an answer: In 2013 the Federal Reserve bought more of our debt in than all foreigners combined.

Zero Hedge followed that tidbit with a post that China sold $48 billion in US Treasuries in December 2013.

While Belgium came to the rescue in December, what happens if China continues its Treasury dump? Who will buy the debt? If and when no one is left raising his paddle, will the Federal Reserve continue its plan to taper?

China has been reducing its Treasury holdings for some time now… and buying gold. A quick scan of the chart below from the Wall Street Journal paints a sobering picture.

So I ask, what happens when the rest of the world decides holding gold is much better than holding US dollars?

For the most part, my family and friends consider me an upbeat, positive person. Nevertheless, I occasionally receive a note asking if I am a member of the “doom and gloom club.” My answer is: No! Frankly, I don’t like harping on about all of the things that could go wrong… But it’s part of “guard duty” to warn you of real threats.

How can we keep these threats in perspective? It took 25 years for the stock market to come back to its previous high after the crash of 1929. We all remember the Internet boom and bust years later: the NASDAQ closed at $5,046.86 on March 11, 2000; on October 9, 2002, it closed at $1,114.11, having lost 78% of its value. Then from 2007-2009, the stock market tumbled again. The S&P peaked in October 2007 at $1,565.15. It bottomed at $676.53 in March 2009.

For baby boomers, previous market booms and busts happened during their working careers—when they had time to recover—until now. 10,000 baby boomers will retire every day for the next 17 years. Boom and bust cycles take place all the time, and retiring does not create a blanket of immunity from these cycles. Actually, it exposes one to greater risk. There is no guarantee the economy will snap back within a few years after the next bust.

Our team takes these threats much more seriously than I did the cockroaches in the Arizona desert. The potential for catastrophe is far too great for us not to.

Simon Black has said, “There are two ways to sleep well at night, be ignorant or be prepared.” Preparation, however, is only step one. The Marine Corps takes it one step further: You can be well prepared; however, if you are asleep without sufficient warning, much of your preparation may go for naught. Vigilance adds security.

As you have read, the Miller’s Money Forever team takes guarding its subscribers’ portfolios very seriously. There’s nothing more important to our team than providing readers with direction on how to get real returns while mitigating risk. And we’ve done so successfully, with real returns that have safely provided real income for our subscribers. You, too, can employ our team in guarding your nest egg. And you can do it today for half the price. Act now to learn more about Miller’s Money Forever and our Bulletproof Income portfolio.

 

The article Retirement Guard Duty 101 was originally published at millersmoney.com.

Uzbekistan holds refinancing rate at 10%

By CentralBankNews.info
    The central bank of Uzbekistan kept its benchmark refinancing rate steady at 10.0 percent, saying in a brief statement from April 28 that the decision was based on actual and expected inflation, and the monetary targets for this year.
    The Central Bank of the Republic of Uzbekistan last changed its rate in December 2013 when it cut the benchmark rate by 200 basis points to the current 10 percent.
    Uzbekistan’s inflation rate rose to 7.0 percent in the fourth quarter of 2013 from 3.3 percent in the third quarter. But the country’s inflation rate typically jumps in the fourth quarter.
     In the fourth quarter of 2012, for example, inflation rose to 7.6 percent from 4.5 percent in the previous month and in the fourth quarter of 2011 it rose to 7.3 percent from 4.2 percent.
    The International Monetary Fund forecasts 2014 average inflation of 11.0 percent, down from 11.2 percent in 2013 and 12.1 percent in 2012.
    Uzbekistan’s economy expanded by 8.0 percent in 2013, but the IMF forecasts slower growth of 7.0 percent this year and 6.5 percent in 2015.
    Uzbekistan, north of Turkmenistan and south of Kazakhstan in central Asia, gained its independence from the Soviet Union in 1991. It’s economy is mainly based on commodities, such as cotton, gold, uranium and natural gas.

    http://ift.tt/1iP0FNb

AUD/NZD – Traders Put Support Area To The Test

Technical Sentiment: Bearish


Key Takeaways

  • AUD/NZD formed a Lower High at 1.0870 on Monday;
  • Traders are trying to further confirm the bearish movement with a Lower Low;
  • The breach below 200 Simple Moving Average on 4H – priced at 1.0756 – signals more losses ahead.

With the recent rejection at 1.0909, AUD/NZD has temporarily forfeited the option of a bullish trend in favor for a large range consolidation between 1.0500 and 1.0900. On a smaller time scale the pair is showing selling pressure and it’s falling deeper into the range. Selling rallies remains the preferred strategy as the pairs will attempt to test all major support levels.


Technical Analysis
AUDNZD 1St May
 

The pair traded below April 24th Low of 1.0756, technically confirming the bearish pressure initially signaled by the rejection from 1.0909 and the lower high at 1.0870.  The 200 Simple Moving Average on the 4H timeframe and the 100-Day Moving Average failed to offer support during the European session, which suggests the next support levels are in play in the coming days.

The 50-Day Moving Average, 50% Fibonacci Retracement between 1.0538 – 1.0909 and the price pivot zone at 1.0730 are all clustered in the same area. 4H Stochastic is in oversold territory which suggests a small bounce is likely in this area. The preferred strategy is to sell if any bearish signals or resistance rejections follow this bounce.

A further breach below 1.0730/20 will open the way towards 1.0680, the 61.8% Fibonacci Retracement line, and ultimately the pivot zone at 1.0640.

AUD/NZD has a long way up before regaining a bullish stance, since it has to change the lower high – lower low configuration first. Initial resistance lies at 1.0825 and just above it a fresh trendline based on April 22nd and 28th highs should cap all rallies for the coming days.

*********
Prepared by Alexandru Z., Chief Currency Strategist at Capital Trust Markets


USDCHF: Turns Lower, Eyes Further Downside

USDCHF: With USDCHF turning lower on the back of a loss of upside momentum, further downside is likely. It now eyes a return to the 0.8769 level where a break will turn focus to the 0.8750 level. A cut through here will set the stage for a run at the 0.8700 level and subsequently the 0.8650 level. Its daily RSI is bearish and pointing lower supporting this view. Conversely, resistance resides at the 0.8850 level where a violation will aim at the 0.8900 level. Further out, resistance resides at the 0.8952 level. This level if broken will aim at the 0.8900 level with a close above here aiming at the 0.9000 level. All in all, the pair remains biased to the downside in the medium term.

Article by www.fxtechstrategy.com


Crude Prices Drops on Weak China PMI Data

By HY Markets Forex Blog

Crude prices traded lower on Thursday, dragged lower by the disappointing PMI figures from China while crude inventories in the US climbed to a record-high.

The North American West Texas Intermediate crude for June delivery slid 0.15% trading at $99.63 per barrel on the New York Mercantile Exchange at the time of writing. While futures for the European benchmark Brent crude for June settlement lost 0.13% to $107.94 a barrel at the same time on the ICE Futures Europe exchange.

China’s Purchasing Managers Index (PMI) came in at 50.4 in April, slightly up from the previous reading of 50.3 seen in March but still lower than analysts’ forecasts of 50.5.

Crude Supplies

US crude supplies in the US climbed 1.698 million to 399.4 million in the last week, the highest level since April 1931, according to reports from the US Energy Information Administration.

Gasoline supplies rose 1.6 million barrels to 211.6 million barrels in the last week, while distillate stockpiles, including heating oil and diesel; rose by 1.9 million to 114.4 million barrels, according to reports from the EIA.

Reports from the American Petroleum Institute showed that the US crude stocks rose by 3 million barrels in the last week, surpassing analysts’ forecasts.

US GDP

The US Federal Reserve (Fed) concluded its two-day policy meeting by reducing its monthly asset purchases to $45 billion on Wednesday, overlooking the US weak first-quarter performance.

Reports from the Commerce Department in Washington showed that the US gross domestic product expanded by 0.1% at an annual rate from January to March, compared to the 2.6% rise seen in the previous quarter.

Russia

Earlier this week Russia; the biggest energy exporter in the world, was imposed with new sanctions by the US and the European Union as Russian President Vladimir Putin warned that the new sanctions may lead to Russia to reconsider participation with companies in the US and the European Union in the energy sector and other key industries.


Visit www.hymarkets.com   to find out more about our products and start trading today with only $50 using the latest trading technology today

The post Crude Prices Drops on Weak China PMI Data appeared first on | HY Markets Official blog.

Article provided by HY Markets Forex Blog

Cotton Extends Gains on US Supply Worry

By HY Markets Forex Blog

Cotton prices were seen trading higher as it reached a sixth straight monthly gain while the long-term drought in Texas continues. The common cotton areas from Virginia, central Mississippi, Alabama and northeast Louisiana saw about 250% normal rain in April, according to reports from MDA Weather Services. This year, prices for the commodity climbed by 11% this year.

Meanwhile in the Western region of Texas, approximately 75% of fields saw less rain this month, Drew Lerner, President and Senior Agricultural Meteorologist of World Weather, said in an interview.

Cotton for July delivery rose 0.2% higher to 94.29 cents a pound on the ICE Futures US in New York. In April prices rose 0.8% and climbed 22% within six months, the longest gaining streak since 1984.

Concerns that the US tight supplies pushed cotton to its highest in two years, settling at around 97 cents a pound in the previous month.

Cotton global demand is forecasted to increase by 2.2% from the previous year to 23.93 million tons in the season that begins from August 1, according to reports from Cotlook Ltd. Meanwhile output is expected to fall by 0.7% to 25.54 million, according to market estimates.

Farms from almost 15 state planted 13% of forecast acres in the week ending April 27, compared with the previous five-year average of 18% in the same period last year.


Visit www.hymarkets.com   to find out more about our products and start trading today with only $50 using the latest trading technology today

The post Cotton Extends Gains on US Supply Worry appeared first on | HY Markets Official blog.

Article provided by HY Markets Forex Blog

Wave Analysis 01.05.2014 (DJIA Index, Crude Oil)

Article By RoboForex.com

Analysis for May 1st, 2014

DJIA Index

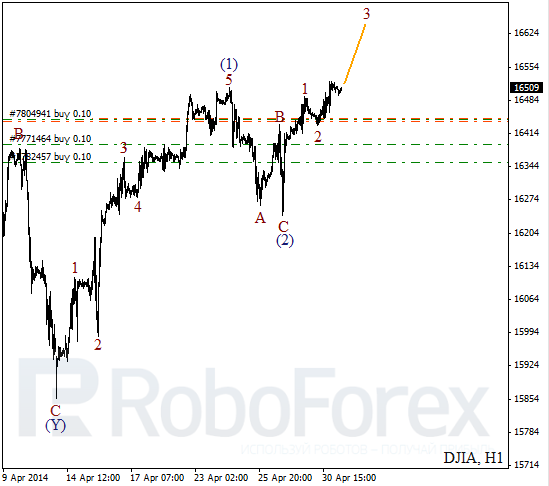
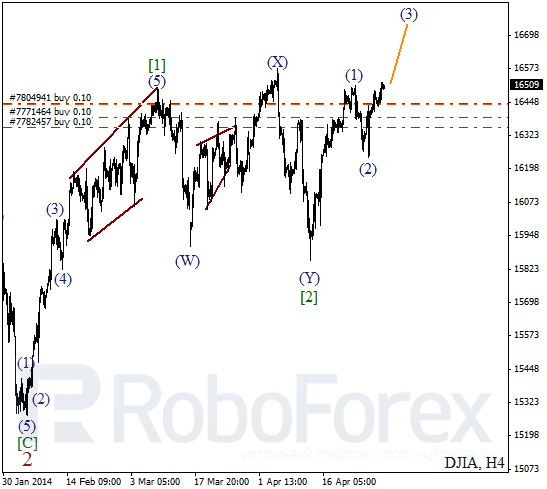
After completing double three pattern inside wave [2], Index started growing up again. Possibly, instrument may reach new historic maximum while forming wave (3) of [3]. I’ve got three buy orders, with stop in the black.

More detailed wave structure is shown on H1 chart. After finishing zigzag pattern inside wave (2), Index formed bullish impulse inside the first wave. Most likely, in the nearest future price will continue growing up.

Crude Oil

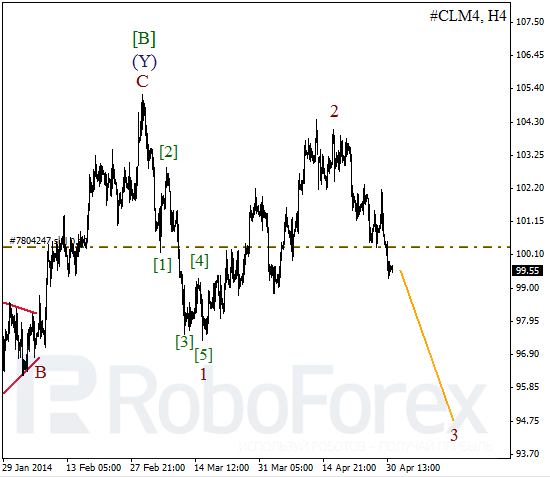
I’ve been able to move stop on my yesterday’s order into the black. After completing local correction, instrument is expected to continue falling down. Minimum of wave 1 may be broken quite soon.

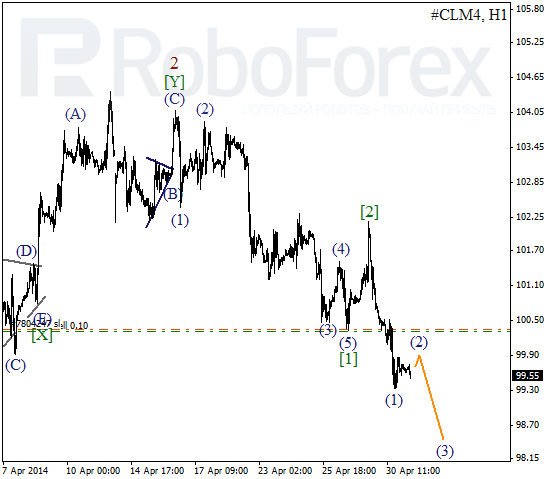
As we can see at the H1 chart, instrument is forming extension inside wave [3]. On minor wave level, market is about to complete the second wave. In the near term, instrument is expected to continue falling down inside the third wave.

RoboForex Analytical Department

Article By RoboForex.com

Attention!
Forecasts presented in this section only reflect the author’s private opinion and should not be considered as guidance for trading. RoboForex LP bears no responsibility for trading results based on trading recommendations described in these analytical reviews.


EURUSD Forex Trading Pivot Point Levels for 2014.05.01

2014.05.01 12:30 6:30AM ET | EURUSD Currency Pair

SC EURUSD 2014.05.01

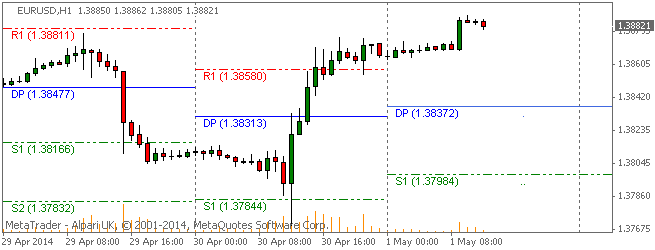
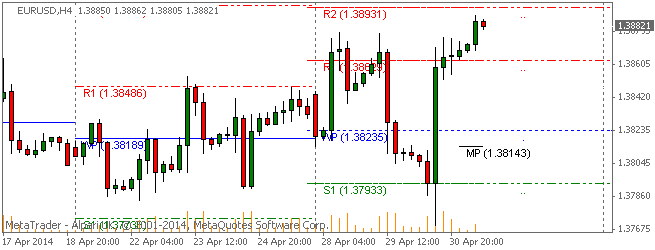
Here are the Pivot Points Levels with Support (S) and Resistance (R) for the EURUSD currency pair today. Price action is currently trading over the daily pivot point at the 1.38821 price level, according to data at 6:30 AM ET. The EURUSD high for the day has been 1.38883 while the low of day has reached to 1.38634. The pair earlier today opened the Asian trading session above the daily pivot and has trended higher into the North American morning.

Daily Pivot Point: 1.38372
— S1 – 1.37984
— S2 – 1.37308
— S3 – 1.36920
— R1 – 1.39048
— R2 – 1.39436
— R3 – 1.40112


Weekly Pivot Points: EURUSD

SC EURUSD 2014.05.01

Prices are currently trading over the weekly pivot point and above the R1 resistance level at time of writing. The EURUSD has been on an overall bullish trend this week after opening the trading week modestly above the weekly pivot.

Weekly Pivot Point: 1.38235
— S1 – 1.37933
— S2 – 1.37539
— S3 – 1.37237
— R1 – 1.38629
— R2 – 1.38931
— R3 – 1.39325


By CountingPips.comForex Trading Apps & Currency Trade Tools

Disclaimer: Foreign Currency trading and trading on margin carries a high level of risk and volatility and can result in loss of part or all of your investment. All information and opinions contained do not constitute investment advice and accuracy of prices, charts, calculations cannot be guaranteed.


USDCHF Forex Trading Pivot Point Levels for 2014.05.01

2014.05.01 12:30 6:30AM ET | USDCHF Currency Pair

SC USDCHF 2014.05.01

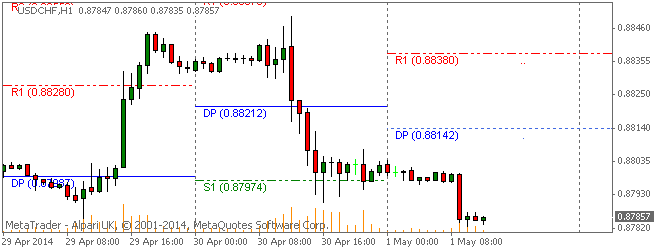
Here are the Pivot Points Levels with Support (S) and Resistance (R) for the USDCHF currency pair today. Price action is currently trading under the daily pivot point at the 0.87857 price level, according to data at 6:30 AM ET. The USDCHF high for the day has been 0.88038 while the low of day has reached to 0.87829. The pair earlier today opened the Asian trading session below the daily pivot and has continued to trend lower to below the 0.8800 exchange rate.

Daily Pivot Point: 0.88142
— S1 – 0.87786
— S2 – 0.87547
— S3 – 0.87191
— R1 – 0.88381
— R2 – 0.88737
— R3 – 0.88976


Weekly Pivot Points: USDCHF

SC USDCHF 2014.05.01

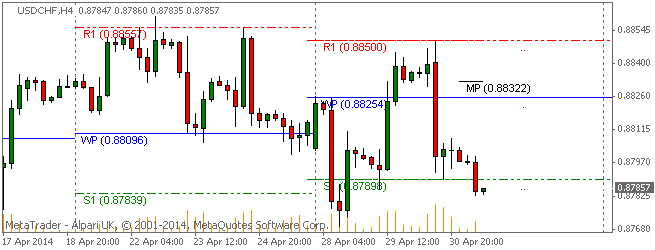
Prices are currently trading under the weekly pivot point at time of writing. The USDCHF has been whipsawing this week after opening the trading week below the weekly pivot.

Weekly Pivot Point: 0.88254
— S1 – 0.87898
— S2 – 0.87652
— S3 – 0.87296
— R1 – 0.88500
— R2 – 0.88856
— R3 – 0.89102


By CountingPips.com – Forex Trading Apps & Currency Trade Tools

Disclaimer: Foreign Currency trading and trading on margin carries a high level of risk and volatility and can result in loss of part or all of your investment. All information and opinions contained do not constitute investment advice and accuracy of prices, charts, calculations cannot be guaranteed.


GBP Continues Its Relentless Bullish Move Against The Australian Dollar

Technical Sentiment: Bullish

Key Takeaways

  • U.K. Manufacturing PMI surges to 57.3;
  • Later today AUD PPI is expected to post a quarterly increase to 0.6%, from 0.2% in January;
  • GBP/AUD remains bullish, with targets around 1.8275 and 1.8400.

The British Pound received another boost after Manufacturing PMI surged to 57.3 in April. GBP/AUD maintains a strong bullish trend, with consistent higher lows in the last three weeks of trading. The expected AUD PPI increase is likely to be priced in the uptrend, consequently only a better than expected report will deter the pair from moving any higher.


Technical Analysis
GBPAUD 1stMay

GBP/AUD is currently trading around 1.8210, near the two tops set on Tuesday and Wednesday at 1.2820. The pair is in bullish territory, well above the 200 Simple Moving Average on the 4H timeframe and it has stabilized above the price pivot zone at 1.8121.

The only set-back for the current bullish trend configuration is the failure to create a meaningful higher high above 1.8220. Another rejection in this area will create a triple top formation in the short term, bringing up the possibility of a deeper correction towards 1.8050 or 1.8000 large round number. This move will be also signaled if the pair breaks below 1.8130 and makes a short term lower low.

Towards the upside GBP/AUD has a decent target around 1.8280, created by two Fibonacci retracement levels. The real resistance is a major pivot zone and Fibonacci confluence between 1.8370 and 1.8400, where the uptrend is likely to reverse given the overbought conditions of Stochastic on the Daily timeframe.

*********
Prepared by Alexandru Z., Chief Currency Strategist at Capital Trust Markets