EURUSD: Bear Threats Not Yet Over.

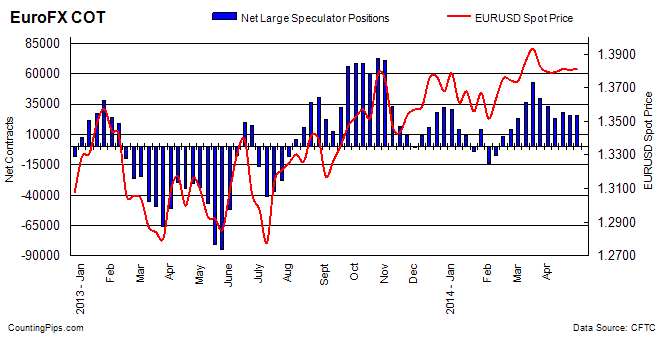
EURUSD: Our bias on EUR continues to point lower while holding below the 1.3905 level. Though closing marginally higher the past week, except it returns above the mentioned level, the risk remains lower. Support lies at the 1.3779 level where a break will aim at the 1.3737 level followed by the 1.3676 level. Further down, support stands at the 1.3600 level where a violation will target the 1.3550 level. Conversely, medium term outlook on EUR remains higher but it will have to recapture the 1.3905 level and 1.3966 level to resume that uptrend. Further out, resistance resides at the 1.4000 level, its big psycho level. All in all, EUR remains biased to the upside in the long term but faces corrective weakness threats.

Article by www.fxtechstrategy.com


Forex COT Speculators decreased US Dollar short bets last week, CAD bets rise

By CountingPips.com

cot-levels

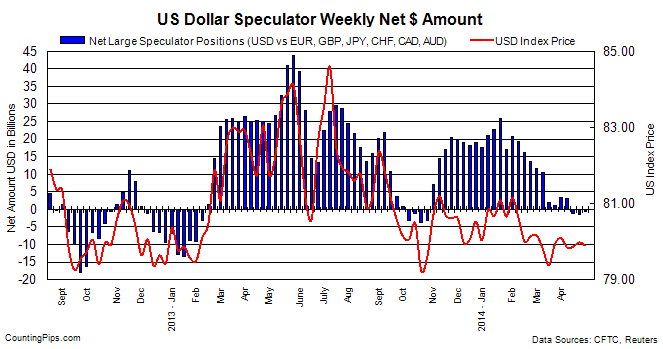
The latest data for the weekly Commitments of Traders (COT) report, released by the Commodity Futures Trading Commission (CFTC) on Friday, showed that large traders and speculators slightly decreased their overall bearish bets of the US dollar last week.

Non-commercial large futures traders, including hedge funds and large International Monetary Market speculators, had an overall US dollar short position totaling -$0.686 billion as of Tuesday April 29th, according to the latest data from the CFTC and calculations by Reuters. This was a weekly change of +$0.894 billion from the -$1.58 billion total short position that was registered on April 22nd, according to Reuters that totals the US dollar contracts against the combined contracts of the euro, British pound, Japanese yen, Australian dollar, Canadian dollar and the Swiss franc.

The USD position has been on the bearish side (slightly) for the past three weeks after having stayed in bullish territory since October 29th with the highest bullish position reached on January 21st with a +$25.89 total position.

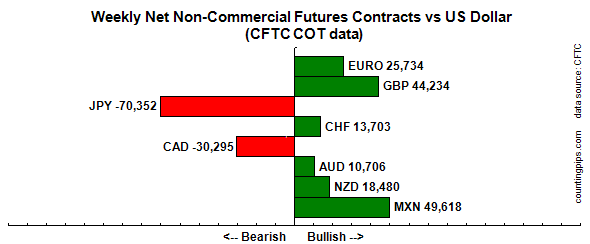
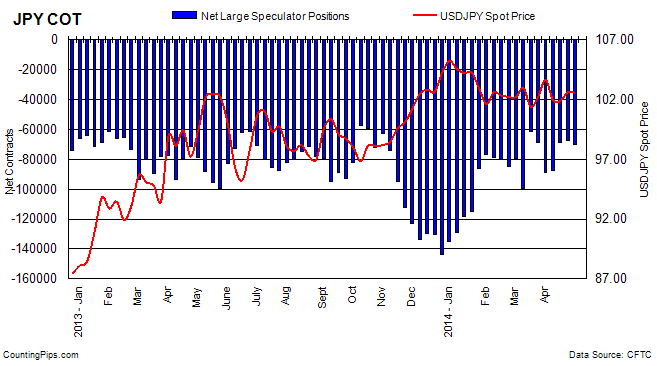
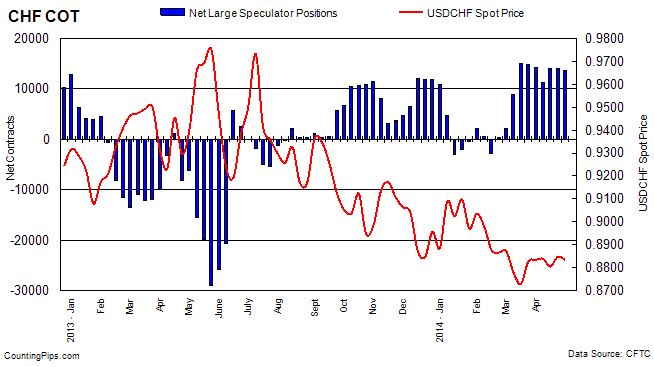
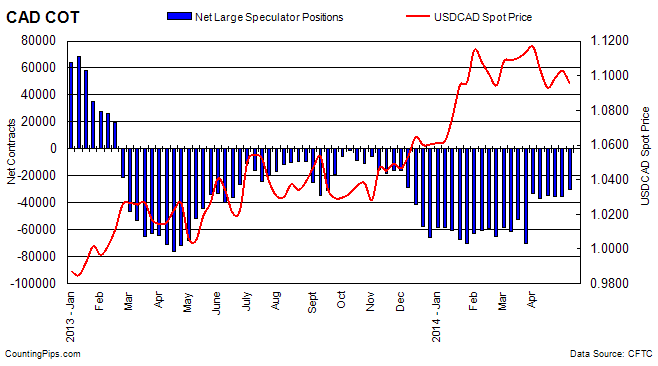
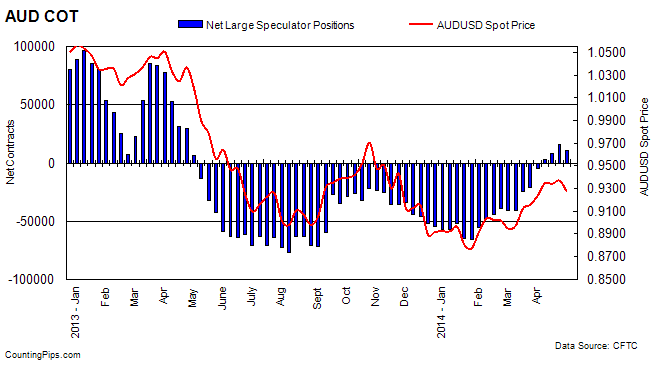
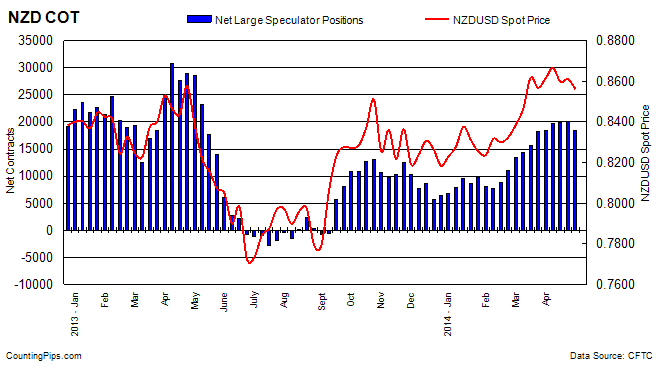
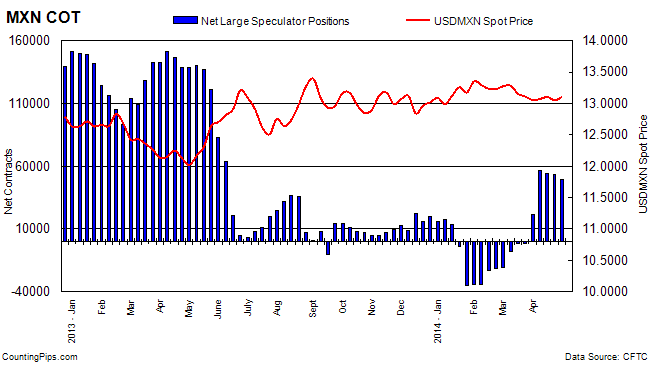
For the week, speculators increased their bets in favor of just the Canadian dollar while there was weekly declines for the euro, Japanese yen, British pound sterling, Swiss franc, Australian dollar, New Zealand dollar and the Mexican peso.


cot-standings

Notable changes:

  • The small Euro decline has pushed Euro positions to fall five out of the last six weeks (same with Swiss franc)
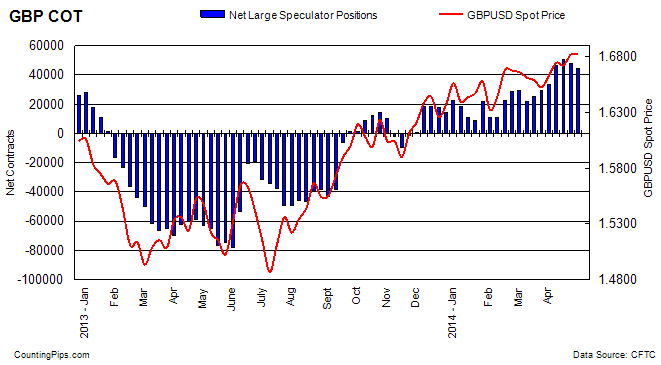
  • British pound sterling positions declined for 2nd week after a string of five straight weekly gains
  • Canadian dollar bearish positions are at their lowest level since November 26th 2013 when bearish net contracts were -28,780
  • Australian dollar net position decline broke a streak of 7 straight weekly advances


* All currency positions are in direct relation to the US dollar where, for example, a bet for the euro is a bet that the euro will rise versus the dollar while a bet against the euro will be a bet that the dollar will gain versus the euro. Please see charts and data below.


Weekly Charts: Large Speculators Weekly Positions vs Currency Spot Price

EuroFX:

eurofx

Last Six Weeks data for EuroFX futures

DateOpen InterestLong SpecsShort SpecsLarge Specs NetWeekly Change
03/25/20142621791069146728039634-13357
04/01/20142600751018496861133238-6396
04/08/2014261439926356933523300-9938
04/15/201427072210625278564276884388
04/22/20142662591012047543025774-1914
04/29/20142715151022857655125734-40


British Pound Sterling:

gbp

Last Six Weeks data for Pound Sterling futures

DateOpen InterestLong SpecsShort SpecsLarge Specs NetWeekly Change
03/18/20142089616414138605255363537
03/25/20142021156675137027297244188
04/01/20142114377596942397335723848
04/08/201422666791642451654647712905
04/15/20142266888747236874505984121
04/22/2014237055896924189247800-2798
04/29/2014236030859134167944234-3566


Japanese Yen:

jpy

Last Six Weeks data for Yen Futures

DateOpen InterestLong SpecsShort SpecsLarge Specs NetWeekly Change
03/25/20141582801760086487-68887-7788
04/01/201418846422162110800-88638-19751
04/08/201418181413340100802-874621176
04/15/20141648431435183067-6871618746
04/22/20141656741656483807-672431473
04/29/20141688201384684198-70352-3109


Swiss Franc:

chf

Last Six Weeks data for Franc futures

DateOpen InterestLong SpecsShort SpecsLarge Specs NetWeekly Change
03/25/201447353250371021814819-297
04/01/201447228248001056914231-588
04/08/20144475219275794011335-2896
04/15/201448976239059839140662731
04/22/20144688821732770914023-43
04/29/20144742421960825713703-320


Canadian Dollar:

cad

Last Six Weeks data for Canadian dollar futures

DateOpen InterestLong SpecsShort SpecsLarge Specs NetWeekly Change
03/25/20141332464044173656-3321536590
04/01/20141179662754964543-36994-3779
04/08/20141203362870463011-343072687
04/15/20141195252828863714-35426-1119
04/22/20141187072752962984-35455-29
04/29/20141235893009360388-302955160


Australian Dollar:

aud

Last Six Weeks data for Australian dollar futures

DateOpen InterestLong SpecsShort SpecsLarge Specs NetWeekly Change
03/25/2014842322438744914-205273936
04/01/2014939993539840278-488015647
04/08/201496887376303432033108190
04/15/201498933404633236680974787
04/22/20141076964954033170163708273
04/29/2014109934500193931310706-5664


New Zealand Dollar:

nzd

Last Six Weeks data for New Zealand dollar futures

DateOpen InterestLong SpecsShort SpecsLarge Specs NetWeekly Change
03/25/201432748262438030182132462
04/01/20143231325765728518480267
04/08/201432898265216755197661286
04/15/2014331002667168241984781
04/22/20143257926056588120175328
04/29/20142985822979449918480-1695


Mexican Peso:

mxn

Last Six Weeks data for Mexican Peso futures

DateOpen InterestLong SpecsShort SpecsLarge Specs NetWeekly Change
03/25/20141158582276924423-1654-384
04/01/201414527049893281092178423438
04/08/201413033170371138705650134717
04/15/2014131412710381680154237-2264
04/22/2014128932683291481853511-726
04/29/2014128100680731845549618-3893


*COT Report: The weekly commitment of traders report summarizes the total trader positions for open contracts in the futures trading markets. The CFTC categorizes trader positions according to commercial hedgers (traders who use futures contracts for hedging as part of the business), non-commercials (large traders who speculate to realize trading profits) and nonreportable traders (usually small traders/speculators).

The Commitment of Traders report is published every Friday by the Commodity Futures Trading Commission (CFTC) and shows futures positions data that was reported as of the previous Tuesday (3 days behind).

Each currency contract is a quote for that currency directly against the U.S. dollar, a net short amount of contracts means that more speculators are betting that currency to fall against the dollar and a net long position expect that currency to rise versus the dollar.

(The graphs overlay the forex spot closing price of each Tuesday when COT trader positions are reported for each corresponding spot currency pair.)

See more information and explanation on the weekly COT report from the CFTC website.


Article by CountingPips.comForex Apps & News

Gold Speculators added to bullish positions for 2nd week in latest COT data

By CountingPips.com

Weekly CFTC Net Speculator Report

gold

GOLD: Large futures market traders and speculators increased their overall bullish bets in gold futures last week for a second consecutive week, according to the latest Commitment of Traders (COT) data released by the Commodity Futures Trading Commission (CFTC) on Friday.

The non-commercial futures contracts of Comex gold futures, traded by large speculators and hedge funds, totaled a net position of +85,227 contracts in the data reported through April 29th. This was a change of +3,394 contracts from the previous week’s total of +81,833 net contracts on April 22nd.

The gold non-commercial net positions had fallen for four straight weeks through April 15th before turning around with small gains the past two weeks.

Over the weekly reporting time-frame, from Tuesday April 22nd to Tuesday April 29th, the gold price advanced from $1,284.90 to $1,296.20 per ounce, according to gold futures price data from investing.com.


Last 6 Weeks of Large Trader Non-Commercial Positions

DateOpen InterestLong SpecsShort SpecsNet Non-CommercialsWeekly ChangeGold Price
03/25/201439826416908351766117317-194971311.00
04/01/201436345115815258007100145-171721279.60
04/08/20143654001496936109488599-115461310.10
04/15/20143695771474326814079292-93071302.9
04/22/2014372593146880650478183325411284.9
04/29/2014378092147769625428522733941296.2

*COT Report: The weekly commitment of traders report summarizes the total trader positions for open contracts in the futures trading markets. The CFTC categorizes trader positions according to commercial hedgers (traders who use futures contracts for hedging as part of the business), non-commercials (large traders who speculate to realize trading profits) and nonreportable traders (usually small traders/speculators). Find CFTC criteria here: (http://www.cftc.gov/MarketReports/CommitmentsofTraders/ExplanatoryNotes/index.htm).

Article by CountingPips.comForex Trading Apps


VIX Futures Market Speculators raised bearish positions last week to highest level since Feb

By CountingPips.com

Weekly CFTC Net Speculator Report


vix


VIX Futures Contracts: Large traders and speculators added to their overall bearish bets in the VIX futures market last week after a decline the previous week, according to the latest data from the Commodity Futures Trading Commission (CFTC) released on Friday.

The VIX non-commercial futures contracts, comprising of large speculator and hedge fund positions, totaled a net bearish position of -45,486 contracts in the data reported for April 29th. This was a change of -11,429 contracts from the previous week’s total of -34,057 net contracts that was registered on April 22nd.

The increase in bearish positions brings overall net contracts to the highest bearish level since February 4th when net positions stood at a level of -51,230 contracts.

The VIX index over the same reporting time-frame last week edged higher from a 13.19 reading on Tuesday April 22nd to a 13.71 reading on Tuesday April 29th, according to the Chicago Board Options Exchange (CBOE) Volatility Index.


Last 6 Weeks of Large Trader Positions

DateOpen InterestLong SpecsShort SpecsNet Non-CommercialsWeekly ChangeVIX Score
03/25/2014335826109110116314-7204-614114.02
04/01/2014357046114839145412-30573-2336913.10
04/08/2014359952105096136842-31746-117314.89
04/15/201436888796296132242-35946-420015.61
04/22/2014362130106598140655-34057188913.19
04/29/2014365215110843156329-45486-1142913.71

*COT Report: The weekly commitment of traders report summarizes the total trader positions for open contracts in the futures trading markets. The CFTC categorizes trader positions according to commercial hedgers (traders who use futures contracts for hedging as part of the business), non-commercials (large traders who speculate to realize trading profits) and nonreportable traders (usually small traders/speculators). Find CFTC criteria here: (http://www.cftc.gov/MarketReports/CommitmentsofTraders/ExplanatoryNotes/index.htm).


Article by CountingPips.comForex Apps & Analysis


US 10-Year Treasury Note Speculators trim bearish positions for 2nd week

By CountingPips.com

Weekly CFTC Net Speculator Report


10Yr

Large Speculators net bearish positions fell to a total of -114,425 contracts

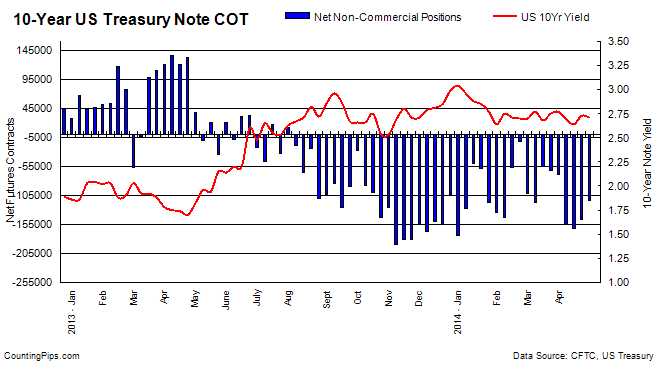
10 Year Treasuries: Large futures market traders and speculators decreased their overall bearish bets in the 10-year treasury note futures for a second straight week last week, according to the latest Commitment of Traders (COT) data released by the Commodity Futures Trading Commission (CFTC) on Friday.

The non-commercial futures contracts of the 10-year treasury notes, primarily traded by large speculators and hedge funds, totaled a net position of -114,425
contracts in the data reported for April 29th. This was a change of +31,440 contracts from the previous week’s total of -145,865 net contracts that was recorded on April 22nd.

The 10-Year Note non-commercial bearish positions have now fallen for two straight weeks and to the lowest level since April 1st when net positions equaled -68,776 contracts.

Over the weekly reporting time-frame, from Tuesday April 22nd to Tuesday April 29th, the yield on the 10-Year treasury note slipped from 2.73 to a yield of 2.71, according to data from the United States Treasury Department.


Last 6 Weeks of Large Trader Non-Commercial Positions

DateOpen InterestLong SpecsShort SpecsNet Large SpecsWeekly Change10 Year Yield
03/25/20142490662333722395487-61765-67512.75
04/01/20142503964346901415677-68776-70112.77
04/08/20142572114327159482333-155174-863982.69
04/15/20142497347344056506334-162278-71042.64
04/22/20142493544349474495339-145865164132.73
04/29/20142528687332918447343-114425314402.71


*COT Report: The weekly commitment of traders report summarizes the total trader positions for open contracts in the futures trading markets. The CFTC categorizes trader positions according to commercial hedgers (traders who use futures contracts for hedging as part of the business), non-commercials (large traders who speculate to realize trading profits) and nonreportable traders (usually small traders/speculators). Find CFTC criteria here: (http://www.cftc.gov/MarketReports/CommitmentsofTraders/ExplanatoryNotes/index.htm).


Article by CountingPips.comForex Trading Apps


Crude Oil Speculators cut back on bullish positions after 5 weeks of gains

By CountingPips.com

Weekly CFTC Net Speculator Report

CrudeOil

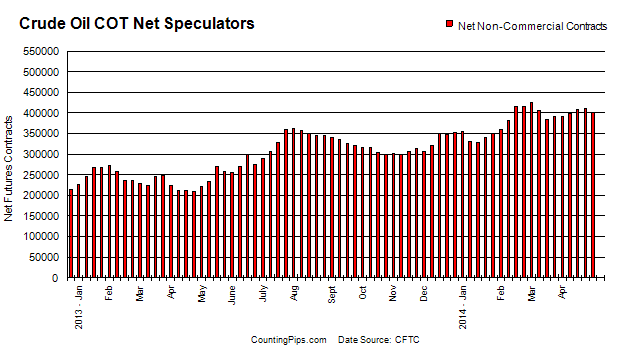
CRUDE OIL: Large futures market traders and speculators decreased their overall bullish bets in crude oil futures for the first time in six weeks last week, according to the latest Commitment of Traders (COT) data released by the Commodity Futures Trading Commission (CFTC) on Friday.

The non-commercial contracts of crude oil futures, primarily traded by large speculators and hedge funds, fell to a total net position of +402,327 contracts in the data reported for April 29th. This was a change of -7,798 contracts for the week. The previous week had seen a total of +410,125 net contracts in the data through April 22nd.

The decline was the first retreat in bullish positions since March 18th and stopped a string of five weekly advances that brought bullish positions to the highest standing since March 4th (+425,818 net contracts).

Over the same weekly reporting time-frame, from Tuesday April 22nd to Tuesday April 29th, the crude oil price fell from $101.92 to $100.58 per barrel, according to Nymex futures price data from investing.com. Brent crude prices, meanwhile, also showed a decline from $109.44 to $108.86 per barrel from Tuesday April 22nd to Tuesday April 29th, according to prices from investing.com.

Last 6 Weeks of Large Trader Non-Commercial Positions

DateOpen InterestLong SpecsShort SpecsNet Non-CommercialsWeekly ChangeOil Price
03/25/20141604566498080106906391174688999.19
04/01/2014164450750238911060639178360999.61
04/08/201416554725120351122483997878004102.33
04/15/201416742765234901139394095519764103.78
04/22/20141619737517023106898410125574101.92
04/29/20141651521522018119691402327-7798100.58

*COT Report: The weekly commitment of traders report summarizes the total trader positions for open contracts in the futures trading markets. The CFTC categorizes trader positions according to commercial hedgers (traders who use futures contracts for hedging as part of the business), non-commercials (large traders who speculate to realize trading profits) and nonreportable traders (usually small traders/speculators). Find CFTC criteria here: (http://www.cftc.gov/MarketReports/CommitmentsofTraders/ExplanatoryNotes/index.htm).

Article by CountingPips.comForex Trading News


Malawi holds rate, sees inflation down to 16% end-year

By CentralBankNews.info
    Malawi’s central bank maintained its policy rate at 25 percent but signaled it may change the rate in the near future, saying its monetary policy committee “made a deliberate decision to review the policy rate at the next meeting” in order to balance the impact of the ongoing foreign exchange operations and liquidity, and the anticipated fiscal risks.
    The Reserve Bank of Malawi (RBM), which has held its rate steady since December 2012, said measures implemented last year had impacted positively on the inflation outlook and enabled the build up of reserves.
    Malawi’s inflation rate eased to 24 percent in March from 24.6 percent in February and 25.9 percent in January due to a deceleration in both food and non-food prices, the RBM said, adding that inflation is expected to continue to trend downwards and reach about 16 percent in December.
    Malawi’s economy expanded by 6.10 percent in 2013 and the central bank estimated growth at the same 6.1 percent rate this year, with all sectors forecast to grow except for the mining sector.
    Malawi’s central bank has been building up its foreign reserves during the tobacco season to provide it with a buffer against external shocks and allow it to intervene in the foreign exchange market to smooth out volatility in the exchange rate from a highly seasonal pattern of foreign exchange inflows.
    Foreign exchange reserves for the banking system as a whole amounted to US$ 754 million in March, or 3.9 months of imports, up from 3.4 months end-December.
    Malawi’s kwacha currency eased 9.4 percent against the U.S. dollar in 2013 but has firmed this year, trading at 385.7 on Friday, up 10.2 percent since the end of 2013.
    The International Monetary Fund said last month that the RBM’s purchase of foreign exchange was boosting liquidity, complicating the disinflation process and recommended that “the RBM tighten monetary policy more aggressively.”
    The bank said money market liquidity remained high, leading to a reduction in the interbank rate to 8.4 percent in April from 25.2 percent in December, and this calls for an “intensification of monetary operations which could lead to a reversal of both the Treasury bill yields and the interbank rates.”
    Net domestic borrowing fell to K7 billion in the first quarter, but the bank expects this to reserve by the end of June due to uncertainty in donor funding and likely financing pressures in connection with elections.
    “Based on the highlighted pressures, the Committee observed that risks to inflation remain,” the central bank said.

    http://ift.tt/1iP0FNb
  

Forex Razor Delivers Personalized Home-Page Engagement

Trading just got personal.

Built by traders for traders, Forex Razor – offering free trading tools with a focus on maximum precision and transparency – has released its industry-first, customizable home-page dashboard.

A very easy-to-use custom start page, ForexRazor.com is the first online forex training platform to give you drag-and-drop control of any of the powerful cutting-edge features, including Economic Calendar, Contest, Account Performances and Top Trading Systems.

Choose, integrate and re-arrange your fundamental and technical trading arsenal in a highly-functional, personalized and freestyle drag-and-drop interface where you aren’t limited to placing modules in columns.

Web functionality is real-time, meaning new content gets delivered to your dashboard automatically without having to refresh the page.

Combined with the release of the personalized home-page dashboard, the Razor Social Suite, School, Real-Time Tools, Cash-Prize Demo Contests and Calculators work together to give Forex Razor trader members an unprecedented edge in shaping, and sharing, informed, risk-managed trading strategies.

www.forexrazor.com

Author Bio


USDCHF: Weakens, Targets Further Downside

USDCHF: With USDCHF closing lower the past week and continuing to trade below its falling trendline, it faces further downside bias. On the downside, support lies at the 0.8742 level where a break will turn focus to the 0.8698 level. A cut through here will set the stage for a run at the 0.8650 level and subsequently the 0.8600 level. Its weekly RSI is bearish and pointing lower supporting this view. Conversely, recovery if triggered will target the 0.8861 level where a break will aim at the 0.8900 level. Further out, resistance comes in at the 0.8952 level. This level if broken will aim at the 0.8900 level with a close above here aiming at the 0.9000 level. All in all, the pair remains biased to the downside in the medium term.

Article by www.fxtechstrategy.com


China’s Middle Class Doesn’t Look Like it Used to…

By MoneyMorning.com.au

Widely reported this week is news the Chinese economy will outpace the American economy in less than a decade.

China’s year-on-year average growth of 7% for the past decade has been nothing short of remarkable. Each year, market analysts globally have questioned if China can continue this historic economic expansion.

Kris Sayce, reasoned it was like America taking over from the United Kingdom in the late 19th century:

…there’s no denying that China’s growth story over the past 10 years has been nothing short of astounding. But can the growth continue?
Well, we’re sure there were plenty of folks who doubted the sustainability of American growth in the 1870s. And yet that proved to be the beginning of 142 years of dominance.

However, China’s economic growth has long been because of central planning.

And in the long term, the central planners want their citizens to take their recent urbanisation, and apply some Western style principals of consumption-at-all-costs.

In other words, get the Chinese people to create a consumption driven economy with the Middle Kingdom’s government still in control.

However, that may not be feasible. The problem is the dynamics of China’s middle class is changing…

China’s middle class doesn’t look like it used to.

The demographics in China are changing.

For a long time, the middle class in China were a happy lot. And the upper middle class in China were the happiest.

This is because the upper middle class of China was mostly filled with officials, former officials, or those with links to government officials that benefited them.

However, thanks to China’s urbanisation, the composition of the middle class is changing.


Source: the Economist / McKinsey
Click to enlarge

Right now, the upper middle class (those with an annual income of 106,000–229,000 yuan) account for about 14% of the urban population. In contrast, 54% make up the mass middle class.

Like I said before, for a long time this part of the population had links to the government that benefited their lives. So up until now, there’s been no real demand for change.

However, by 2022, the mass middle class will account for 22% of the urban population. This will result in more than 50% of the urban population being in the upper middle class bracket.

And this is going to create problems for the government.

To begin with, few of these new found upper middle class folk will have links or access to government officials.

And secondly, this growing segment of the population will want more control over their lives than the Chinese government currently gives them.

Take this for example.

Paraxylene, a chemical used in the manufacture of polyester is causing citizens to protest. They worry that the fumes are a hazard to their health.

Since 2007 there have been protests in five different cities that have proposed to build factories that use Paraxylene.

In spite of the Great Fire Wall of China — the nickname for the government’s internet censorship filter for the Golden Shield Project — people used social media to organise these protests.

Now, the comparable health risk of Paraxylene and the pollution levels in major cities is debatable.

But don’t ignore these protests. Because it demonstrates a growing distrust of the government.

Simply put, the growing middle class now have access to more information than at any other time in history.

Urbanisation, education and increasing wealth have led residents to fight for a standard of living that they want.

On the surface the protests appear to be a demonstration against developers directing their communities. But it’s not. Because many commercial developers are under official control, each rally is a stand against the government.

Furthermore, many in this growing middle class want to leave the country.

Over two years, Shanghai University undertook a survey of the middle class and their views on living in China.

It found that of the middle class in Shanghai, one third would leave the country immediately if they could. Over in Guangzhou, another major city, 40% of the middle income group would do so too.

Even those considered rich were actually keen to leave. 64% of the population with wealth worth more than 10 million yuan (AU$1.6 million) were emigrating or planning to do so.

Why am I telling you this? Because this is another variable that challenges the Chinese growth story.  

All of Chinese growth comes from central planners. However central planners are relying on the people it moved into the middle class to remain there.

And in order for the central planning to be successful, the middle class need to remain satisfied.

Now like Kris, I have no doubt in the long term growth from China. It’s going to be big — an investing opportunity not to be lost.

But if the Chinese government wants a Western style economy, it will have to let go of the political repression it has over its people. If not then the very demographic the regimes is relying on to shift into a consumption economy could very well interfere with their plans.

Shae Smith+
Editor, Money Weekend

Join Money Morning on Google+


By MoneyMorning.com.au