HY MARKETS News: Forex Report: EUR/USD

By HY Markets Forex Blog

EUR/USD recently broke above the resistance level 1.3900 which is the first of the two buy targets that were set in our earlier report for this currency pair (1.3900 and 1.3970).  The breakout of this buy target was preceded by the reversal from the support zone surrounding the support level 1.3800 (highlighted on the daily EUR/USD chart below).

The latest upward impulse wave 3 from this support zone broke the daily Triangle from March – which accelerated the upward movement. EUR/USD is set to rise further to the next buy target 1.3970 – followed by 1.4000.

May07index

The post HY MARKETS News: Forex Report: EUR/USD appeared first on | HY Markets Official blog.

Article provided by HY Markets Forex Blog

HY MARKETS News: Commodities Report:Copper

By HY Markets Forex Blog

Copper recently reversed down from the resistance level 3.1000. The resistance zone near 3.1000 was strengthened by the resistance trendline from December, the upper daily Bollinger Band, 50% Fibonacci Correction of the preceding downward impulse from the end of primary wave ②and the upper channel line of the daily up channel from March.

The reversal from 3.1000 completed the previous intermediate wave (2).  Copper is expected to break the aforementioned up channel and then to fall to the next sell targets – 3.000 and 2.9700.

May07commodities

The post HY MARKETS News: Commodities Report:Copper appeared first on | HY Markets Official blog.

Article provided by HY Markets Forex Blog

HY MARKETS News: Index Report:S&P 100

By HY Markets Forex Blog

S&P 100 recently corrected down strongly after reaching the buy target 838.00 that was set in our earlier technical analysis report for this index. The resistance zone near the resistance level 838.00 (which previously created the top of the earlier intermediate impulse wave (1) at the start of April) formed the top of the latest minor impulse wave 1 of the currently active 3rd intermediate impulse (3).

S&P 100 might correct further down to the next correction target at 822.00 (low of the earlier minor correction 2). If S&P 100 breaks below 822.00 – it can fall further to 810.00.

May07Forex

The post HY MARKETS News: Index Report:S&P 100 appeared first on | HY Markets Official blog.

Article provided by HY Markets Forex Blog

HY MARKETS News : Stocks Report: Apple Inc

By HY Markets Forex Blog

Apple recently reached the buy target 600.00 that was set in our previous report for this company.  The price has been rising strongly in the last few trading sessions – following the earlier breakout of the extended daily Triangle from December of last year.

The price just reversed down from 600.00 and might correct down for some time – before resuming the currently active 3rd intermediate impulse wave (3). Next buy targets stand at 620.00 and 640.00 (the height of the broken Triangle projected from the level of the breakout).


May07stocks

The post HY MARKETS News : Stocks Report: Apple Inc appeared first on | HY Markets Official blog.

Article provided by HY Markets Forex Blog

USDJPY Forex Trading Pivot Point Levels for 2014.05.07

2014.05.07 12:30 6:30AM ET | USDJPY Currency Pair

SC USDJPY 2014.05.07

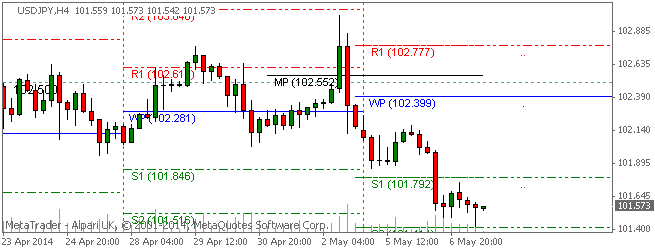
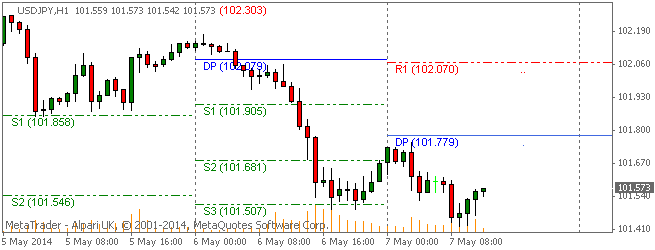
Here are the Pivot Points Levels with Support (S) and Resistance (R) for the USDJPY currency pair today. Price action is currently trading below the daily pivot point at the 101.573 price level, according to data at 6:30 AM ET. The USDJPY high for the day has been 101.755 while the low of day has reached to 101.422. The pair earlier today opened the Asian trading session below the daily pivot and has trended lower into the North American morning session.

Daily Pivot Point: 101.779
— S1 – 101.379
— S2 – 101.088
— S3 – 100.688
— R1 – 102.070
— R2 – 102.470
— R3 – 102.761


Weekly Pivot Points: USDJPY

SC USDJPY 2014.05.07

Prices are currently trading under the weekly pivot point and below the S1 support level at time of writing. The USDJPY has been on an overall bearish trend this week after opening the trading week below the weekly pivot.

Weekly Pivot Point: 102.399
— S1 – 101.793
— S2 – 101.414
— S3 – 100.808
— R1 – 102.778
— R2 – 103.384
— R3 – 103.763


By CountingPips.comForex Trading Apps & Currency Trade Tools

Disclaimer: Foreign Currency trading and trading on margin carries a high level of risk and volatility and can result in loss of part or all of your investment. All information and opinions contained do not constitute investment advice and accuracy of prices, charts, calculations cannot be guaranteed.


GBPUSD Forex Trading Pivot Point Levels for 2014.05.07

2014.05.07 12:30 6:30AM ET | GBPUSD Currency Pair

SC GBPUSD 2014.05.07

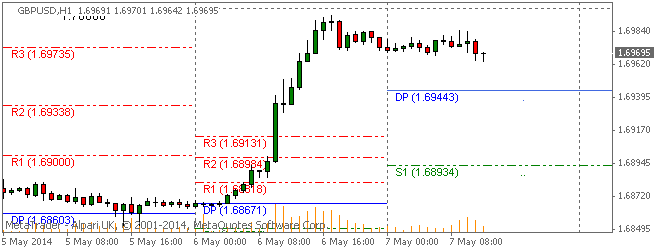
Here are the Pivot Points Levels with Support (S) and Resistance (R) for the GBPUSD currency pair today. Price action is currently trading at the 1.69695 price level and over the daily pivot point, according to data at 6:30 AM ET. The GBPUSD high for the day has been 1.69852 while the low of day has reached to 1.69642. The pair earlier today opened the Asian trading session above the daily pivot and has trended sideways so far today.

Daily Pivot Point: 1.69443
— S1 – 1.68933
— S2 – 1.68136
— S3 – 1.67626
— R1 – 1.70240
— R2 – 1.70750
— R3 – 1.71547


Weekly Pivot Points: GBPUSD

SC GBPUSD 2014.05.07

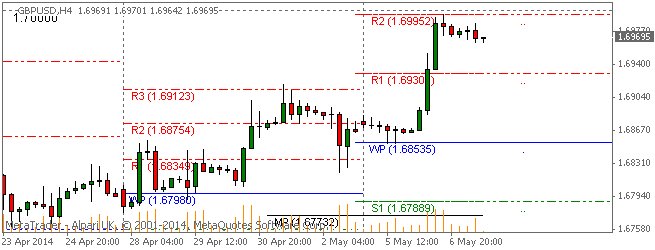
Prices are currently trading over the weekly pivot point and just below the R1 resistance level at time of writing. The GBPUSD has been on an overall bullish trend this week after opening the trading week slightly above the weekly pivot.

Weekly Pivot Point: 1.68535
— S1 – 1.67890
— S2 – 1.67118
— S3 – 1.66473
— R1 – 1.69307
— R2 – 1.69952
— R3 – 1.70724


By CountingPips.com – Forex Trading Apps & Currency Trade Tools

Disclaimer: Foreign Currency trading and trading on margin carries a high level of risk and volatility and can result in loss of part or all of your investment. All information and opinions contained do not constitute investment advice and accuracy of prices, charts, calculations cannot be guaranteed.


USDCHF Forex Trading Pivot Point Levels for 2014.05.07

2014.05.07 12:30 6:30AM ET | USDCHF Currency Pair

SC USDCHF 2014.05.07

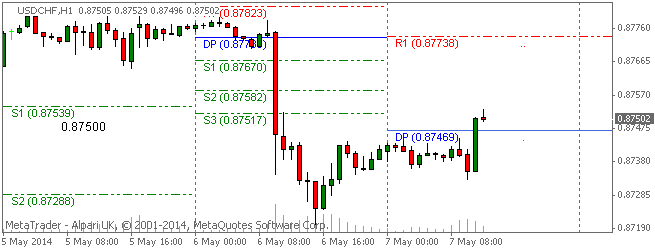
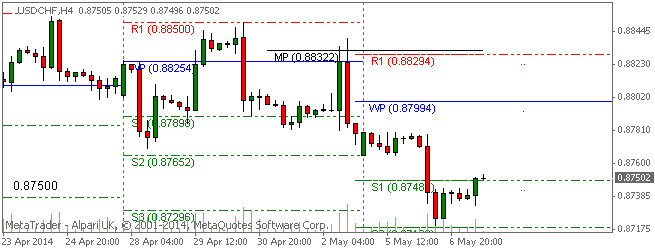
Here are the Pivot Points Levels with Support (S) and Resistance (R) for the USDCHF currency pair today. Price action is currently trading over the daily pivot point at the 0.87502 price level, according to data at 6:30 AM ET. The USDCHF high for the day has been 0.87529 while the low of day has reached to 0.87329. The pair earlier today opened the Asian trading session below the daily pivot and trended sideways before popping higher over daily pivot.

Daily Pivot Point: 0.87469
— S1 – 0.87145
— S2 – 0.86877
— S3 – 0.86553
— R1 – 0.87737
— R2 – 0.88061
— R3 – 0.88329


Weekly Pivot Points: USDCHF

SC USDCHF 2014.05.07

Prices are currently trading under the weekly pivot point at time of writing. The USDCHF has been on an overall bearish trend this week after opening the trading week below the weekly pivot.

Weekly Pivot Point: 0.87994
— S1 – 0.87489
— S2 – 0.87189
— S3 – 0.86684
— R1 – 0.88294
— R2 – 0.88799
— R3 – 0.89099


By CountingPips.comForex Trading Apps & Currency Trade Tools

Disclaimer: Foreign Currency trading and trading on margin carries a high level of risk and volatility and can result in loss of part or all of your investment. All information and opinions contained do not constitute investment advice and accuracy of prices, charts, calculations cannot be guaranteed.


Fibonacci Retracements Analysis 07.05.2014 (EUR/USD, USD/CHF)

Article By RoboForex.com

Analysis for May 7th, 2014

EUR USD, “Euro vs US Dollar”

Just as we expected, yesterday Euro started growing up. Possibly, price will move upwards to reach the group of upper fibo levels at 1.4005 – 1.4000 to test them from below. During correction, I opened another order, my third one.

As we can see at H1 chart, pair is trying to rebound from local level of 38.2% (1.3920). According to analysis of temporary fibo-zones, upper targets may be reached by Thursday.

USD CHF, “US Dollar vs Swiss Franc”

Yesterday, Franc reached new minimum. During correction, I opened another sell order. In the future, instrument is expected to start new descending movement towards the group of lower fibo levels at 0.8695.

As we can see at H1 chart, on Tuesday Franc reached its intermediate target at 0.8720 – 0.8715 and started new correction. If price rebounds from local level of 38.2%, market will continue moving towards its main target at 0.8695.

RoboForex Analytical Department

Article By RoboForex.com

Attention!
Forecasts presented in this section only reflect the author’s private opinion and should not be considered as guidance for trading. RoboForex LP bears no responsibility for trading results based on trading recommendations described in these analytical reviews.


Ichimoku Cloud Analysis 07.05.2014 (GBP/USD, GOLD)

Article By RoboForex.com

Analysis for May 7th, 2014

GBP USD, “Great Britain Pound vs US Dollar”

GBP USD, Time Frame H4. Tenkan-Sen and Kijun-Sen are close to each other and still influenced by “Golden Cross” (1). Ichimoku Cloud is going up, Chinkou Lagging Span is above the chart, and the price is above the lines. Short‑term forecast: we can expect growth of the price towards M Senkou Span B.

GBP USD, Time Frame H1. Tenkan-Sen and Kijun-Sen are close to each other, but still influenced by “Golden Cross” (1). Ichimoku Cloud is going up, and Chinkou Lagging Span is above the chart. Short‑term forecast: we can expect support from Kijun-Sen, and growth of the price.

XAU USD, “Gold vs US Dollar”

XAU USD, Time Frame H4. Tenkan-Sen and Kijun-Sen formed “Golden Cross” inside Kumo Cloud (1). Chinkou Lagging Span is above the chart. Short-term forecast: we can expect support from Tenkan-Sen, and growth of the price.

XAU USD, Time Frame H1. Tenkan-Sen and Kijun-Sen formed “Golden Cross” above Kumo Cloud (1). Ichimoku Cloud is closed (2), and Chinkou Lagging Span is on the chart. Short‑term forecast: we can expect support from Senkou Spans A and B, and growth of the price.

RoboForex Analytical Department

Article By RoboForex.com

Attention!
Forecasts presented in this section only reflect the author’s private opinion and should not be considered as guidance for trading. RoboForex LP bears no responsibility for trading results based on trading recommendations described in these analytical reviews.


Einhorn’s Real Reason for Shorting Athenahealth

By WallStreetDaily.com Billionaire Gets Busted for His "Shorts"

As of midnight last night, billionaire hedge fund manager and co-founder of Greenlight Capital Inc., David Einhorn, had beaten me.

You see, Einhorn just publicly announced that he had opened a short position on Athenahealth (ATHN), saying the stock could plummet 80% from its present price of $126 per share. (The stock quickly cratered – dropping 13.86% on the news.)

At the Sohn Investment Conference in New York City, Einhorn further warned that the technology sector was witnessing its second bubble in 15 years.

Of course, I knew not to take Einhorn’s actions at face value.

Einhorn is somewhat of a media whore who loves attention.

He could also be shorting Athenahealth’s stock simply to boost another position in his portfolio, as this is done all the time on Wall Street.

So I dug into Athenahealth’s latest quarterly report.

Having authored such reports during my analyst days, I’m damn hard to trick.

As of 12:05 AM EST, though, I couldn’t find the reason Einhorn was warning of an 80% price implosion.

Athenahealth is still experiencing strong revenue growth – albeit at a lesser pace than analysts were expecting – and costs are nicely in line, too.

The company’s SEC filing also failed to reveal a white elephant. That is, some type of catastrophic lawsuit or copyright infringement.

Its cash position is strong, as well.

Frustrated, I picked up my phone and started asking my industry contacts what I might be missing.

What could possibly be causing a billionaire investor to bet against such an outwardly attractive stock?

That’s when I found it!

As it turns out, Athenahealth’s CFO, Tim Adams, just resigned on Friday.

Adams recently accepted the position of CFO at Demandware Inc. (DWRE), the Burlington-based e-commerce software firm, and will start on June 2.

Why would a CFO hit the exits if his company was on strong footing? Odds are, he wouldn’t!

So Einhorn is merely following one of the greatest stock influencers known to exist. A CFO’s resignation is an incredibly bearish signal, one that has just recently proved its worth again…

Brinker International (EAT) and DangDang (DANG) both lost their CFOs back in March, and both stocks are getting crushed.

Nice try, Einhorn!

You may have fooled every media outlet on Earth on Monday, but you can’t fool me.

For those looking for yet another profit angle, you might be interested in knowing that Starwood Hotels and Resorts (HOT) just lost its CFO, Alan Schnaid, last week. So put your “shorts” on, ASAP!

Onward and Upward,

Robert Williams
Founder, Wall Street Daily


Breaking News From the Wall Street Daily Universe

Dividends & Income Daily

Welcome to the zombie economy. Growth is stagnating. High-paying jobs are harder to come by than ever. Yet the Federal Reserve is forcing savers to take on more risk. It’s a jungle out there, so be careful! There are opportunities for astute investors, however. That’s why you need a trusted guide in the Game of Yields. Whether your goal is to retire early, or you’re already in retirement and want high investment income and safety, sign up for Dividends & Income Daily today.

Capitol Hill Daily

It’s been a big week already in politics. First, an email acquired by Judicial Watch has re-ignited the firestorm surrounding the Benghazi, Libya terrorist attack that killed four Americans. Next, the FCC is about to vote on a proposal that could completely destroy the internet as we know it. And today, Floyd Brown asks whether it’s time for John McCain to retire from Washington. Don’t miss any of the latest reporting… Sign up for our free Capitol Hill Daily newsletter today.

Tech & Innovation Daily

Tech & Innovation Daily just covered two major new developments in driverless car technology from Google (GOOG) and Volvo (VOLVY). Plus, we continue to put tech stocks through our hugely popular C.H.A.O.S. System to evaluate their prospects and investment merit. Best of all… this comprehensive stock analysis is absolutely free. For all of our latest research, go to our tech hub and sign up for our free e-letter.

Oil & Energy Daily

You’ve heard of the insane profits investors have made from the Bakken. But did you know there’s a new oil discovery that’s actually three times bigger? We just covered it at our energy division, Oil & Energy Daily – along with the best way to invest.

The post Einhorn’s Real Reason for Shorting Athenahealth appeared first on Wall Street Daily.
Article By WallStreetDaily.com

Original Article: Einhorn’s Real Reason for Shorting Athenahealth