Fibonacci Retracements Analysis 28.04.2014 (EUR/USD, USD/CHF)

Article By RoboForex.com

Analysis for April 28th, 2014

EUR USD, “Euro vs US Dollar”

After rebounding several times from level of 50% (1.3790), Eurodollar started new ascending movement. Most likely, during this week bulls will reach the group of upper fibo levels at 1.3965 – 1.3975. If price rebounds from them, instrument may start new and deeper correction.

At H1 chart, after rebounding from local level of 61.8% (1.3813), Eurodollar reached new maximum and I decided to move stop on my first buy order into the black. During correction, I opened another order, According to analysis of temporary fibo-zones, predicted targets may be reached by Tuesday.

USD CHF, “US Dollar vs Swiss Franc”

After rebounding several times from main targets of correction (0.8845 – 0.8855), Franc started falling down. Target is still close to the group of lower fibo levels at 0.8650 – 0.8640. Price may break minimum in the nearest future.

As we can see at H1 chart, Franc reached its intermediate target (0.8785). Possibly, in the near term price may start new correction. Later instrument is expected to continue falling down towards the next group of fibo levels (0.8753).

RoboForex Analytical Department

Article By RoboForex.com

Attention!
Forecasts presented in this section only reflect the author’s private opinion and should not be considered as guidance for trading. RoboForex LP bears no responsibility for trading results based on trading recommendations described in these analytical reviews.


Euro Paves The Way For More Gains Against Australian Dollar

Technical Sentiment: Bullish

EURAUD 28th April

Key Takeaways

  • 1.4854 has been confirmed as support;
  • Bullish price action on 4H and Daily chart;
  • Resistance at 1.4990 is the main target.

The European session has seen traders buy into the weakness shown during the Asian session. EUR/AUD trend configuration remains bullish, with the higher swing low at 1.4855 intact and a small Fibonacci bounce. A higher swing high is now expected above 1.4944, preferably as high as 1.4990.


Technical Analysis


After last week’s bullish triangle breakout, the only higher swing low EUR/AUD formed was the one at 1.4855. This level also coincides with Fibonacci 38.2% between 1.4714 and 1.4944; consequently the bullish bounce reduced the probability of a deeper correction for now.

Towards the upside EUR/AUD will immediately confront the 200 Simple Moving Average on the 4H timeframe, along with April’s high in the 1.4955/65 region.

The secondary resistance area is just below the 1.5000 handle, a confluence between Fibonacci 38.2% from 1.5536 down to 1.4653 and December 2013 Low. A strong break above this region may even expose 1.5100, albeit Daily Stochastic is in overbought territory and another break along the way may be necessary.

For the current landscape, the bullish outlook is only going to be invalidated if EUR/AUD drops below 1.4856. Bearish rejections from the resistance levels or off the 200 Simple Moving Average will aim directly at this support level, but there is no point in aiming for lower levels while the higher swing low remains intact. The same logic that was applied for the two higher lows at 1.4715 should be used in this situation as well.

*********
Prepared by Alexandru Z., Chief Currency Strategist at Capital Trust Markets


Monetary Policy Week in Review – Apr 21-25, 2014: Number of rate rises in 2014 jumps to 17, tops rate cuts

By CentralBankNews.info

    The central banks of New Zealand, Denmark and Colombia raised key interest rates last week, strengthening this year’s trend toward higher rates as global monetary policy slowly unwinds from years of ultra-low rates and extraordinary policy measures.
    Russia’s central bank also raised its policy rate last week, but this was mainly in response to heightened inflationary pressures from the falling ruble as spooked investors continue to withdraw funds due to a worsening of the conflict with Ukraine and the West.
    Last week’s rate hikes raised the number of central bank rate increases so far this year to 17, topping the 15 rate cuts, cementing this year’s trend toward higher rates as the global economy recovers and the U.S. Federal Reserve pulls back on extraordinary stimulus.
    The Global Monetary Policy Rate (GMPR), the average nominal rate of the 90 central banks followed by Central Bank News, rose to 5.58 percent at the end of the week, up from 5.53 percent at the end of March and 5.51 percent at the end of January.
   In the month of April, five central banks have changed policy rates (Brazil, Ukraine, New Zealand, Russia and Colombia) with every decision leading to higher rates while no central banks have cut rates. 
    Denmark is not included in this list as it raised its deposit rate and not its benchmark lending rate. Nevertheless, the move by Denmark’s Nationalbank is significant because it concludes the bank’s experiment with negative deposit rates and shows how central banks are unwinding the extraordinary measures they took in the wake of the global financial crises and Europe’s sovereign debt crises.
    Denmark introduced the negative deposit rate for banks on July 6, 2012 when it cut the rate for the third time that year to minus 0.20 percent. 
   The move came at the height of the euro zone’s crises in an attempt to reduce the inflow of capital and the resulting upward pressure on its crown currency from investors that were seeking a safe haven at a time when serious questions were being raised about the survival of the single currency.
    It was only European Central Bank President Mario Draghi’s comment on July 26, 2012 that the “ECB is ready to do “whatever it takes” that the tide turned and investors’ s confidence in the euro was restored.
    Capital slowly began to return to euro zone assets, easing the pressure on the crown and by Jan. 25, 2013 the Danish central bank was able to take the first step in returning to normal, raising it to minus 0.10 percent. 
    Last week’s 15 basis point increase in the Danish deposit rate to a positive 0.05 percent comes after a weakening of the crown in recent months as investors have been attracted to relatively higher short-term euro rates than crown rates.
    By raising its deposit rate to just above the ECB’s zero percent deposit rate, the Danish central bank appeared to be signaling that it is comfortable with a slightly higher crown. 
    Denmark’s unwinding of its negative deposit rate also garnered interest because it comes as the ECB is wrestling with various options for weakening the euro to stimulate economic activity, including a negative deposit rate.
    New Zealand’s second consecutive rate rise of 25 basis points, bringing its Official Cash Rate (OCR) to 3.0 percent, was widely flagged and further rate increases are expected to curb inflation.
   However, the Reserve Bank of New Zealand (RBNZ) cautioned investors who think rates will be raised in a consistent and predictable manner, regardless of economic reality.
    In addition to repeating its guidance from March that the “speed and extent” of future rate rises will depend on data and inflationary pressures, the RBNZ added last week that it would also take into account the impact of the high exchange rate on inflation.
    Colombia’s unexpected 25 basis point increase in its benchmark intervention rate to 3.50 percent was significant for several reasons.
   First, because it was evidence of the Central Bank of Colombia’s confidence in the global economic recovery. 
   Second, because it illustrated how the period of extraordinary accommodative monetary policy is being unwound worldwide. 
    Third, because it showed confidence and foresight by the central bank to raise rates now, in what it described as a “prudent” move, given the long time it takes for its policy rates to filter through to the economy.
    Russia’s central bank also took investors by surprise by its second rate rise in as many months. The Bank of Russia raised its policy rate by 150 basis points on March 3 to calm financial markets, nervous over the crises with Ukraine, and last week raised the rate by another 50 basis points despite the worsening economy to keep a lid on accelerating inflation.
    Through the first 17 weeks of this year, policy rates have been raised 17 times, or 10.8 percent of this year’s 157 policy decisions by the 90 central banks followed by Central Bank News. This number does not include Denmark’s central bank which only raised its deposit rate and not its benchmark lending rate. Policy rates have been cut 15 times so far this year, or 9.6 percent of this year’s policy decisions, down from 10.1 percent the previous week.
    LIST OF LAST WEEK’S CENTRAL BANK DECISIONS:

    LIST OF OTHER STORIES LAST WEEK:

   TABLE WITH LAST WEEK’S MONETARY POLICY DECISIONS:

COUNTRYMSCI     NEW RATE           OLD RATE        1 YEAR AGO
SRI LANKA FM6.50%6.50%7.50%
BOTSWANA7.50%7.50%9.00%
THAILANDEM2.00%2.00%2.75%
TURKEY EM10.00%10.00%5.00%
NEW ZEALANDDM3.00%2.75%2.50%
DENMARK (DEPO RATE)DM0.05%-0.10%-0.10%
FIJI0.50%0.50%0.50%
RUSSIAEM7.50%7.00%8.25%
MEXICOEM3.50%3.50%4.00%
COLOMBIA EM3.50%3.25%3.25%

     This week (Week 18) eight central banks will be deciding on monetary policy, including Israel, Angola, Egypt, Mauritius, Hungary, Japan, the United States and Albania.
    TABLE WITH THIS WEEK’S MONETARY POLICY DECISIONS:

COUNTRYMSCI             DATE CURRENT  RATE        1 YEAR AGO
ISRAELDM 28-Apr0.75%1.75%
ANGOLA28-Apr9.25%10.00%
EGYPT EM28-Apr8.25%9.75%
MAURITIUSFM28-Apr4.65%4.90%
HUNGARYEM29-Apr2.60%4.75%
UNITED STATESDM 30-Apr0.25%0.25%
JAPANDM 30-Apr                 N/A                 N/A
ALBANIA 30-Apr2.75%3.75%


What’s really going on at Quindell?

By MoneyMorning.com.au

Did you catch the near £1bn smash-down in technology company Quindell this week?

It was caused by a research note from an American outfit called Gotham City, which made some seriously damning claims about the legitimacy of Quindell’s profits.

Until recently this company was one of the London stock market’s darlings, having risen from a couple of pence in 2011 to around 40p…

But when Gotham published its research note, Quindell’s stock immediately halved in value.

And rather like Batman, the vigilante of Gotham City (presumably where this outfit got its name), it’s sometimes a tough job to know whether investment vigilantes are a genuine force for good.

Was Gotham providing a genuine service for investors? Or was this actually a bear raid by a cynical hedge fund looking for a quick profit on a short position…?

Profit From Major Market Scandals

I quite like the idea of vigilantes, both in markets and outside them. I mean, surely only the baddies should fear the likes of our caped crusader!

And there have always been vigilantes in the markets. You hear about the bond vigilantes that supposedly take governments to task on their fiscal affairs. In the currency market George Soros was amongst a group who shorted the pound in 1992, famously ‘breaking the Bank of England’ and forcing the pound out of the ERM.

Looking back, it now appears that this was actually a fantastic boon for the UK. The lower pound increased the UK’s competitiveness as well as making it far more difficult to join the eurozone’s currency regime.

As far as famous stock shorters go, you may be familiar with Jim Chanos, the hedge fund manager that was among the first to discover the illicit goings on at Enron. Duly he made a mint by shorting the stock. Closer to home, we’ve got our own Simon Cawkwell, AKA Evil Knievil — whose successes have included unearthing the Robert Maxwell fraud and Northern Rock’s disastrous mismanagement.

Again, the guy puts his money down (or not, as is the case with shorting!), and hopes to profit as the scam comes to light. Indeed, according to The Telegraph, Cawkwell has benefited from a significant short on Quindell…lucky him!

Research House or Hedge Fund Stooge?

As far as Gotham goes, it’s unclear who’s behind the ‘research house’. Some speculate a hedge fund — and that’s probably likely to be the case. On its website, Gotham states that it may have positions in the stocks it researches.

‘May have’…I’d read that as, almost certainly does have!

You can read Gotham’s 74 page report by clicking here. I’m certainly not endorsing it, but it may be of interest to readers — even if you don’t hold the stock. Gotham tackles some of the major issues that we should all be aware of when going through a company’s accounts.

Gotham states that ‘Quindell was little more than a country club until 2008/2009, yet QPP somehow began reporting Microsoft/Google-esque profit margins in 2010/2011.

It also points out that 26% to 43% of Quindell’s 2009/2010 revenues came from a business owned by the CEO Robert Terry, and that 41% of 2011 revenue came from an undisclosed related party (ie, from a business controlled by a Quindell executive).

Essentially, Gotham is asking whether Quindell’s revenue is real, or just made up by moving cash around between related companies. Not least because, despite the reported profits surge, there is, ‘No free cash flow and negative operating cash flow.

And it’s a good point…that’s always one of the first things I look at when going through accounts: do the reported profits follow through into cash flow for the business?

The Goodies and the Baddies

Anyway, as if those accusations aren’t bad enough, Gotham further suggests that 10 or more of Quindell’s recent acquisitions ‘lack economic substance’ — that is, they were little more than paper companies!

There are allegations about ‘Ponzi-style schemes’ from former executives and a significant question mark should be inferred by the fact that ‘It [Quindell] has had three different auditors in three years since 2011.

Oh, what a mess! Now, you should be aware that Quindell refutes all of Gotham’s claims. And I understand they will be releasing a full response in due course.

All we know at this stage is that Gotham has certainly asked some rather probing questions. And if they’re right, then it must be a good thing to curtail a sham operation before it sucks in more investor cash.

However, if the report was written with malicious intent and based on obvious un-untruths, the authors behind it are likely to be pursued. They won’t be able to stand behind the anonymity of its website forever.

How exciting…who are the goodies and who are the baddies? Time will tell.

Bengt Saelensminde,
Contributing Editor, Money Morning

Ed Note: The above article was originally published in MoneyWeek.

Join Money Morning on Google+


By MoneyMorning.com.au

Value Investing and Money in the Australian Economy

By MoneyMorning.com.au

It’s one thing to be connected.

And it’s another thing to understand the philosophical meaning of money.

But it’s something completely different to put that into practical advice.

That’s where our colleague Greg Canavan enters the picture.

Greg knows more than just about anyone we know when it comes to the theory of money. But that’s not where Greg’s skills end. He’s also an accomplished value investor.

When you think about it, being a money theorist and a value investor are a natural combination — like gin and tonic or fish and chips.

In order to get a true understanding of a company’s worth it pays to understand the worth of the currency you’re using to value the company.

We doubt if there are more than a handful of value investors in the world who think just as much about the value of money as they do about the value of the stocks they analyse.

But if you’re a genuine value investor, it’s vitally important to think about the value of the currency.

Think about it, a company can grow its revenue and profits as much as it likes, but if the value of the currency declines at a faster rate than the company’s profit growth then it won’t count for much.

Are Australian stocks ‘fundamentally’ overvalued?

In the latest issue of Sound Money, Sound Investments Greg Canavan takes an in-depth look at the Australian dollar.

And to be frank, he isn’t doing somersaults at what he sees.

Put simply, Greg says that the Australian stock market and currency are heading towards what you could call ‘peak stimulus’. At the moment the market believes the Australian economy has successfully transitioned from a commodities economy to a real estate economy.

But according to Greg you can expect to see that optimism wane over the coming months. That’s especially likely in the Aussie housing market, which should weaken through the rest of this year.

Remember, rising house prices need credit to grow. That typically means interest rates have to stay low and perhaps go even lower. Greg doesn’t see that as likely.

The only other way Australian house prices can grow is if economic productivity improves. But as Greg says, ‘Australia’s productivity performance in recent years has been terrible.

It’s for that reason that he sees stocks as ‘fundamentally overvalued at this point.

In fact, Greg says that the stock valuation system he uses ‘suggests the ASX remains between 25% (best case) and 44% overvalued!

It’s a sobering thought if you’re thinking about buying stocks. So why are we telling you this? After all, by now you know that your editor has a bullish view on the market that’s almost directly opposed to Greg’s view.

What is your advisor hiding from you?

The reason for giving you both sides of the story is simple.

It’s up to you as a self-directed investor to take both views into account before making up your mind on what you should do next.

This is something that you’ll never get from most financial advisors or from the mainstream press. With most financial advisors you just get the ‘house’ view. That is, the company’s chief economist will set the market viewpoint and all the advisors must adhere to that view — even if they don’t agree with it.

That’s not the way we work. We don’t have a house view. We have a team of independent analysts who form their own views based on their research.

The analysts then present these views and the investments ideas to you. It’s up to you to decide which of the views have the most compelling argument. Once you’ve figured that out then you can invest accordingly.

And whatever you do the final decision will be yours. You’ll know that you’ve taken into account all the issues before you make up your mind. That puts you in a different league compared to most mainstream investors.

For the most part mainstream investors only ever see one point of view — the ‘house’ view. When things go wrong they wonder why they’d never heard about the big economic problems before. Mostly it’s because their advisor didn’t know about it or because the advisor kept it from them.

So when a key and potentially unexpected event happens, those investors are mostly completely unaware, unprepared…and their finances suffer accordingly.

That’s something we don’t want happening to you.

Our view and analysis is that Aussie stocks are heading into another huge bull market. But what if we’re wrong? By introducing you to well-thought out and varied views we can help reduce the chances that a key economic event will catch you unawares. Greg certainly makes an interesting case.

Cheers,
Kris+

From the Port Phillip Publishing Library

Special Report: Secure and Protect Family Wealth for Generations

Join Money Morning on Google+


By MoneyMorning.com.au

Rickards: Was This the ‘Most Blatant Case of Insider Trading’?

By MoneyMorning.com.au

At the recent World War D conference some of the speakers addressed one key element of the subtitle — Money, War and Survival in the Digital Age.

That is they spoke about the meaning of money and where the whole monetary system is right now.

One of those speakers was Jim Rickards.

He’s probably one of the most ‘connected’ financial gurus on the planet. And his just-released book highlights the level of those connections.

After all, who do you know who received an invitation from the US Central Intelligence Agency (CIA) to look into financial irregularities that may have taken place before the 9/11 terrorist attacks?

Jim Rickards was one man who got an invitation.

His latest book, The Death of Money, gives an insight into one of the meetings at the CIA’s Langley, Virginia headquarters:

On September 26, 2003, John Mulheren and I were seated side by side in a fourth-floor [meeting room] in the headquarters complex. Mulheren was one of the most legendary stock traders in Wall Street history. I was responsible for modeling terrorist trading for the CIA, part of a broad inquiry into stock trading on advance knowledge of the 9/11 attacks.

I looked in his eyes and asked if he believed there was insider trading in American Airlines stock immediately prior to 9/11. His answer was chilling: “It was the most blatant case of insider trading I’ve ever seen.”

Rickards explains in his book exactly how ‘inside’ traders (those within the terrorist network with intimate knowledge of the impending attacks) made millions.

You can find out how to get a copy of Jim Rickards’ book mailed to you here. It’s a fascinating read from a genuine establishment insider.

Cheers,
Kris+

From the Port Phillip Publishing Library

Special Report: Secure and Protect Family Wealth for Generations

Join Money Morning on Google+


By MoneyMorning.com.au

Currency Speculators increased bets against US Dollar last week for 3rd week

By CountingPips.com

Cot-Values

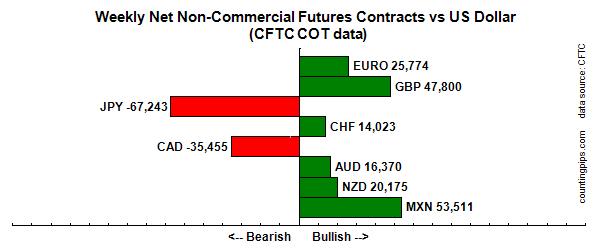
The latest data for the weekly Commitments of Traders (COT) report, released by the Commodity Futures Trading Commission (CFTC) on Friday, showed that large traders and speculators continued to decrease their bets in the US dollar last week as overall US dollar positions fell to their lowest level since October.

Non-commercial large futures traders, including hedge funds and large International Monetary Market speculators, had an overall US dollar short position totaling -$1.58 billion as of Tuesday April 22nd, according to the latest data from the CFTC and calculations by Reuters. This was a weekly change of -$0.41 billion from the -$1.17 billion total short position that was registered on April 15th, according to Reuters that totals the US dollar contracts against the combined contracts of the euro, British pound, Japanese yen, Australian dollar, Canadian dollar and the Swiss franc.

Last week’s data marks the highest short position in the US dollar since October 29th 2013 when bearish positions equaled -$3.14 billion.

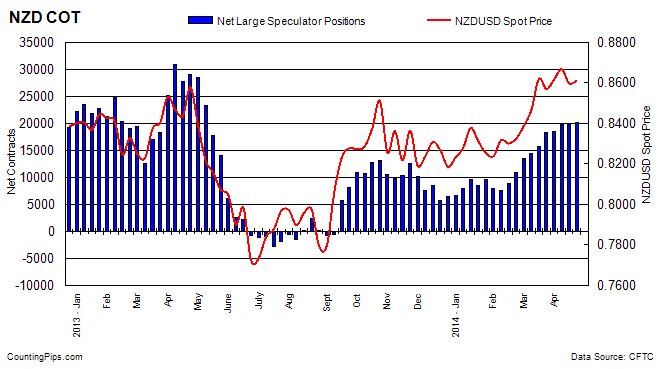
For the week, speculators increased their bets in favor of the Japanese yen, Australian dollar and the New Zealand dollar while there was weekly declines for the euro, British pound sterling, Swiss franc, Canadian dollar and the Mexican peso.

Cot-Standing

Notable changes:

  • Euro positions have fallen four out of the last five weeks to the lowest level since March 4th
  • British pound sterling positions fell slightly after five straight weeks of gains
  • Japanese yen positions rose for the third straight week
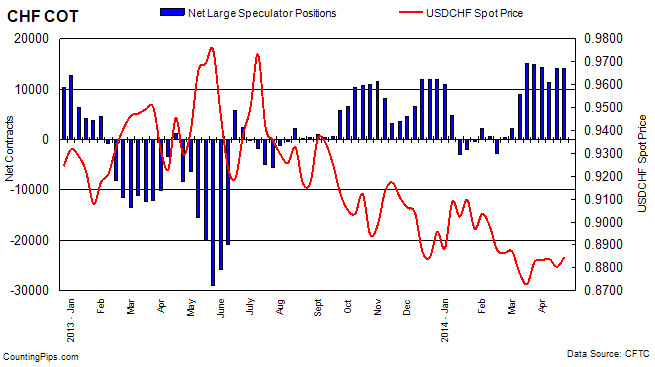
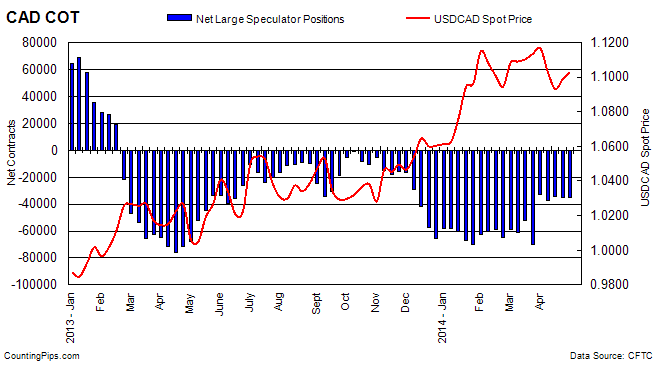
  • Swiss franc (-43), Canadian dollar (-29), New Zealand dollar (+328) and Mexican Peso (-726) positions saw little change for the week
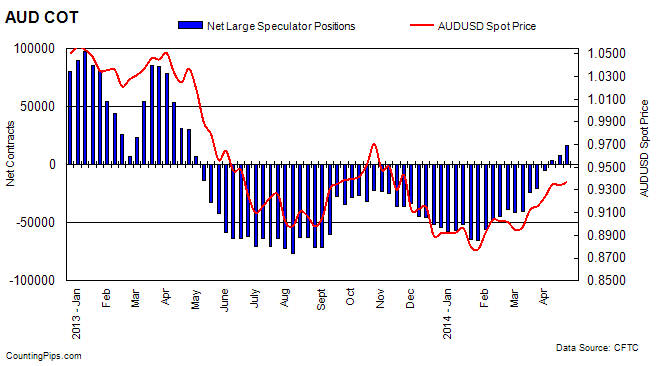
  • Australian dollar net positions rose the most in the week (+8,273) as the Aussie had its third straight bullish position and highest bullish standing since April 2013


* All currency positions are in direct relation to the US dollar where, for example, a bet for the euro is a bet that the euro will rise versus the dollar while a bet against the euro will be a bet that the dollar will gain versus the euro. Please see charts and data below.


Weekly Charts: Large Speculators Weekly Positions vs Currency Spot Price

EuroFX:

EURFX

Last Six Weeks data for EuroFX futures

DateOpen InterestLong SpecsShort SpecsLarge Specs NetWeekly Change
03/18/2014264443117819648285299116606
03/25/20142621791069146728039634-13357
04/01/20142600751018496861133238-6396
04/08/2014261439926356933523300-9938
04/15/201427072210625278564276884388
04/22/20142662591012047543025774-1914


British Pound Sterling:

gbp

Last Six Weeks data for Pound Sterling futures

DateOpen InterestLong SpecsShort SpecsLarge Specs NetWeekly Change
03/18/20142089616414138605255363537
03/25/20142021156675137027297244188
04/01/20142114377596942397335723848
04/08/201422666791642451654647712905
04/15/20142266888747236874505984121
04/22/2014237055896924189247800-2798


Japanese Yen:

JPY

Last Six Weeks data for Yen Futures

DateOpen InterestLong SpecsShort SpecsLarge Specs NetWeekly Change
03/18/20141569222414485243-6109938257
03/25/20141582801760086487-68887-7788
04/01/201418846422162110800-88638-19751
04/08/201418181413340100802-874621176
04/15/20141648431435183067-6871618746
04/22/20141656741656483807-672431473


Swiss Franc:

chf

Last Six Weeks data for Franc futures

DateOpen InterestLong SpecsShort SpecsLarge Specs NetWeekly Change
03/18/2014493912531110195151166159
03/25/201447353250371021814819-297
04/01/201447228248001056914231-588
04/08/20144475219275794011335-2896
04/15/201448976239059839140662731
04/22/20144688821732770914023-43


Canadian Dollar:

cad

Last Six Weeks data for Canadian dollar futures

DateOpen InterestLong SpecsShort SpecsLarge Specs NetWeekly Change
03/18/20141867822775197556-69805-17614
03/25/20141332464044173656-3321536590
04/01/20141179662754964543-36994-3779
04/08/20141203362870463011-343072687
04/15/20141195252828863714-35426-1119
04/22/20141187072752962984-35455-29


Australian Dollar:

aud

Last Six Weeks data for Australian dollar futures

DateOpen InterestLong SpecsShort SpecsLarge Specs NetWeekly Change
03/18/2014817372157746040-2446316387
03/25/2014842322438744914-205273936
04/01/2014939993539840278-488015647
04/08/201496887376303432033108190
04/15/201498933404633236680974787
04/22/20141076964954033170163708273


New Zealand Dollar:

nzd

Last Six Weeks data for New Zealand dollar futures

DateOpen InterestLong SpecsShort SpecsLarge Specs NetWeekly Change
03/18/201431463246458894157511302
03/25/201432748262438030182132462
04/01/20143231325765728518480267
04/08/201432898265216755197661286
04/15/2014331002667168241984781
04/22/20143257926056588120175328


Mexican Peso:

mxn

Last Six Weeks data for Mexican Peso futures

DateOpen InterestLong SpecsShort SpecsLarge Specs NetWeekly Change
03/18/20141110571932020590-12706977
03/25/20141158582276924423-1654-384
04/01/201414527049893281092178423438
04/08/201413033170371138705650134717
04/15/2014131412710381680154237-2264
04/22/2014128932683291481853511-726


*COT Report: The weekly commitment of traders report summarizes the total trader positions for open contracts in the futures trading markets. The CFTC categorizes trader positions according to commercial hedgers (traders who use futures contracts for hedging as part of the business), non-commercials (large traders who speculate to realize trading profits) and nonreportable traders (usually small traders/speculators).

The Commitment of Traders report is published every Friday by the Commodity Futures Trading Commission (CFTC) and shows futures positions data that was reported as of the previous Tuesday (3 days behind).

Each currency contract is a quote for that currency directly against the U.S. dollar, a net short amount of contracts means that more speculators are betting that currency to fall against the dollar and a net long position expect that currency to rise versus the dollar.

(The graphs overlay the forex spot closing price of each Tuesday when COT trader positions are reported for each corresponding spot currency pair.)

See more information and explanation on the weekly COT report from the CFTC website.


Article by CountingPips.comForex Apps & News

US 10-Year Treasury Note Speculators cut back on bearish positions from 2014 high

By CountingPips.com

Weekly CFTC Net Speculator Report


10-Year

Large Speculators bearish positions decline to a total of -145,865 contracts

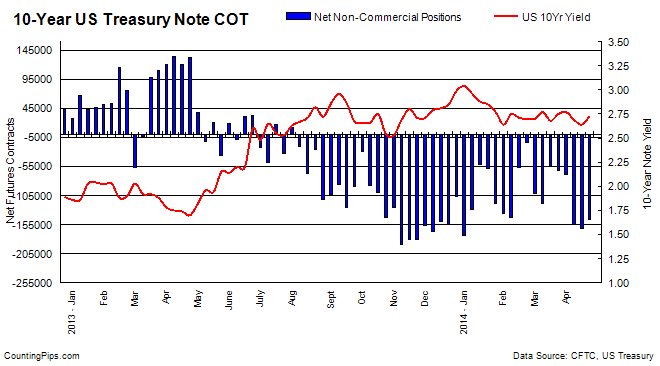
10 Year Treasuries: Large futures market traders decreased their overall bearish bets in the 10-year treasury note futures last week after four straight weeks of rising bearish positions, according to the latest Commitment of Traders (COT) data released by the Commodity Futures Trading Commission (CFTC) on Friday.

The non-commercial futures contracts of the 10-year treasury notes, primarily traded by large speculators and hedge funds, totaled a net position of -145,865 contracts in the data reported for April 22nd. This was a change of +16,413 contracts from the previous week’s total of -162,278 net contracts that was recorded on April 15th.

The current level in the 10-year note futures contracts is the lowest bearish level in three weeks after reaching the highest bearish level of 2014 on April 15th.

Over the weekly reporting time-frame, from Tuesday April 15th to Tuesday April 22nd, the yield on the 10-Year treasury note advanced from 2.64 to a yield of 2.73, according to data from the United States Treasury Department.


Last 6 Weeks of Large Trader Non-Commercial Positions

DateOpen InterestLong SpecsShort SpecsNet Large SpecsWeekly Change10 Year Yield
03/18/20142441194360226415240-55014631962.68
03/25/20142490662333722395487-61765-67512.75
04/01/20142503964346901415677-68776-70112.77
04/08/20142572114327159482333-155174-863982.69
04/15/20142497347344056506334-162278-71042.64
04/22/20142493544349474495339-145865164132.73


*COT Report: The weekly commitment of traders report summarizes the total trader positions for open contracts in the futures trading markets. The CFTC categorizes trader positions according to commercial hedgers (traders who use futures contracts for hedging as part of the business), non-commercials (large traders who speculate to realize trading profits) and nonreportable traders (usually small traders/speculators). Find CFTC criteria here: (http://www.cftc.gov/MarketReports/CommitmentsofTraders/ExplanatoryNotes/index.htm).


Article by CountingPips.comForex Trading Apps


VIX Futures Market Speculators cut down on bearish positions last week

By CountingPips.com

Weekly CFTC Net Speculator Report


vix


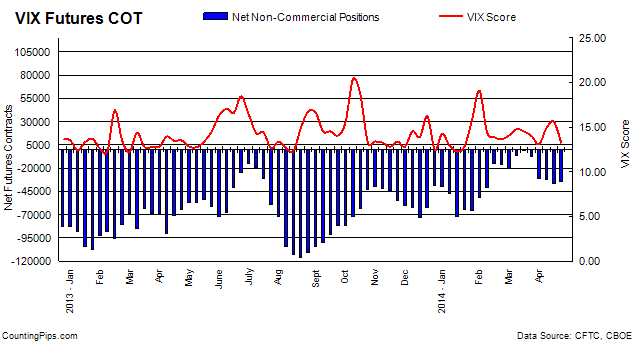
VIX Futures Contracts: Large traders and speculators decreased their overall bearish bets in the VIX futures market last week after four consecutive weeks of rising bearish positions, according to the latest data from the Commodity Futures Trading Commission (CFTC) released on Friday.

The VIX non-commercial futures contracts, comprising of large speculator and hedge fund positions, totaled a net bearish position of -34,057 contracts in the data reported for April 22nd. This was a change of +1,889 contracts from the previous week’s total of -35,946 net contracts that was registered on April 15th.

The decline in large bearish positions brings contracts down from the highest bearish level since February 11th when overall positions stood at a level of -41,108 contracts.

The VIX index, meanwhile, declined last week from a 15.61 reading on Tuesday April 15th to a 13.19 reading on Tuesday April 22nd, according to the Chicago Board Options Exchange (CBOE) Volatility Index.


Last 6 Weeks of Large Trader Positions

DateOpen InterestLong SpecsShort SpecsNet Non-CommercialsWeekly ChangeVIX Score
03/18/2014336625107861108924-1063579114.52
03/25/2014335826109110116314-7204-614114.02
04/01/2014357046114839145412-30573-2336913.10
04/08/2014359952105096136842-31746-117314.89
04/15/201436888796296132242-35946-420015.61
04/22/2014362130106598140655-34057188913.19

*COT Report: The weekly commitment of traders report summarizes the total trader positions for open contracts in the futures trading markets. The CFTC categorizes trader positions according to commercial hedgers (traders who use futures contracts for hedging as part of the business), non-commercials (large traders who speculate to realize trading profits) and nonreportable traders (usually small traders/speculators). Find CFTC criteria here: (http://www.cftc.gov/MarketReports/CommitmentsofTraders/ExplanatoryNotes/index.htm).


Article by CountingPips.comForex Apps & Analysis


Gold Speculators added slightly to bullish positions after 4 weeks of decline

By CountingPips.com

Weekly CFTC Net Speculator Report

Gold

GOLD: Large futures market traders and speculators slightly added to their overall bullish bets in gold futures last week after decreasing positions for four straight weeks, according to the latest Commitment of Traders (COT) data released by the Commodity Futures Trading Commission (CFTC) on Friday.

The non-commercial futures contracts of Comex gold futures, traded by large speculators and hedge funds, totaled a net position of +81,833 contracts in the data reported through April 22nd. This was a change of +2,541 contracts from the previous week’s total of +79,292 net contracts on April 15th.

Over the weekly reporting time-frame, from Tuesday April 15th to Tuesday April 22nd, the gold price declined from approximately $1,302.90 to $1,284.90 per ounce, according to gold futures price data from investing.com.


Last 6 Weeks of Large Trader Non-Commercial Positions

DateOpen InterestLong SpecsShort SpecsNet Non-CommercialsWeekly ChangeGold Price
03/18/201442062618332446510136814179241359.00
03/25/201439826416908351766117317-194971311.00
04/01/201436345115815258007100145-171721279.60
04/08/20143654001496936109488599-115461310.10
04/15/20143695771474326814079292-93071302.9
04/22/2014372593146880650478183325411284.9

*COT Report: The weekly commitment of traders report summarizes the total trader positions for open contracts in the futures trading markets. The CFTC categorizes trader positions according to commercial hedgers (traders who use futures contracts for hedging as part of the business), non-commercials (large traders who speculate to realize trading profits) and nonreportable traders (usually small traders/speculators). Find CFTC criteria here: (http://www.cftc.gov/MarketReports/CommitmentsofTraders/ExplanatoryNotes/index.htm).

Article by CountingPips.comForex Trading Apps