Inflation Is Coming, What to Do—NOW

By Jeff Clark, Senior Precious Metals Analyst, Casey Research

We’ve all heard of the inflationary horrors so many countries have lived through in the past. Third-world countries, developing nations, and advanced economies alike—no country in history has escaped the debilitating fallout of unrepentant currency abuse. And we expect the same fallout to impact the US, the EU, Japan, China—all of today’s countries that have turned to the printing press as a solution to their economic woes.

Now, it seems obvious to us that the way to protect one’s self against high inflation is to hold one’s wealth in gold… But did citizens in countries that have experienced high or hyperinflation turn to gold in response? Gold enthusiasts may assume so, but what does the data actually show?

Well, Casey Metals Team researcher Alena Mikhan dug up the data. Here’s a country-by-country analysis…

Brazil

Investment demand for gold grew before Brazil’s debt crisis and economic stagnation of the 1980s. However, it really took off in the late ‘80s, when already-high inflation (100-150% annually) picked up steam and hit unsustainable levels in 1989.

YearInflationInvestment
demand
(tonnes)
1986167.8%20.0
1987218.5%42.8
1988554.2%61.5
19891,972%*86.5
1990116.2%**-74

Source: The International Gold Trade by Tony Warwick-Ching, 1993; inflation.eu
*Measured from December to December
**Year-end rate

During this period, investment demand for bullion skyrocketed 333%, from 20 tonnes in 1976 to 86.5 tonnes in 1989.

And notice what happened to demand when inflation began to reverse. Substantial liquidations, showing demand’s direct link to inflation.

Indonesia

Indonesia was hit by a severe economic crisis in 1998. The average inflation rate spiked to 58% that year.

YearInflationInvestment
demand (t)
19976.2%11.5
199858.0%22.5
199924.0%11.0
20003.7%8.5

Sources: World Gold Council, inflation.eu

Gold demand doubled as inflation surged. It’s worth pointing out that investment demand in 1997 was already at a record high.

Also, total demand in 1999 reached 120.8 tonnes (not just demand directly attributable to investment), 18% more than in pre-crisis 1997. But overall, once inflation cooled, so again did gold demand.

India

While India has a traditional love of gold, its numbers also demonstrate a direct link between demand and rising inflation. The average inflation rate in 1998 climbed to 13%, and you can see how Indians responded with total consumer demand. (Specifically investment demand data, as distinct from broader consumer demand data, is not available for all countries.)

YearInflationConsumer
demand* (t)
19968.9%507
19977.2%688
199813.1%774
19994.8%730

Sources: World Gold Council, inflation.eu
*Includes net retail investment and jewelry

Gold demand hit a record of 774.4 tonnes, 13% above the record set just a year earlier. In fairness, we’ll point out that gold consumption was also growing due to a liberalization of gold import rules at the end of 1997.

When inflation cooled, the same pattern of falling gold demand emerged.

Egypt, Vietnam, United Arab Emirates (UAE)

Here are three countries from the same time frame last decade. Like India, we included jewelry demand since that’s how many consumers in these countries buy their gold.

YearEgyptVietnamUAE
InflationConsumer
demand (t)
InflationConsumer
demand (t)
InflationConsumer
demand (t)
20066.5%60.57.5%86.110%96.0
20079.5%68.58.3%77.514%107.3
200818.3%76.824.4%115.820%109.5
200911.9%58.47.0%73.31.6%73.9

Sources: World Gold Council, indexmundi.com

Egypt saw inflation triple from 2006 to 2008, and you can see consumer demand for bullion grew as well. Even more impressive is what the table doesn’t show: Investment demand grew 247% in 1998 over the year before. Overall tonnage was relatively modest, though, from 0.7 to 2.5 tonnes.

Vietnam and the United Arab Emirates saw similar patterns. Gold consumption increased when inflation peaked in 2008. Again, it was investment demand that saw the biggest increases. It grew 71% in Vietnam, and 27% in the United Arab Emirates.

And when inflation subsided? You guessed it: Demand fell.

Japan

Prime Minister Shinzo Abe’s plan to kill deflation pushed Japan’s consumer price inflation index to 1.2% last year—still low, but it had been flat or falling for almost two decades, including 2012.

YearInflationConsumer
demand (t)
2012-0.1%6.6
20131.2%21.3


In response, demand for gold coins, bars, and jewelry jumped threefold in the Land of the Rising Sun.


One of the biggest investment sectors that saw increased demand, interestingly, was in pension funds.

Belarus

Unlike many of the nations above, citizens from this country of the former Soviet Union do not have a deep-rooted tradition for gold. However, in 2011, the Belarusian ruble experienced a near threefold depreciation vs. the US dollar. As usual, people bought dollars and euros—but in a new trend, turned to gold as well.

We don’t have access to all the data used in the tables above, but we have firsthand information from people in the country. In the first quarter of 2011, just when it became clear inflation would be severe, gold bar sales increased five times compared to the same period a year earlier. In March alone that year, 471.5 kg of gold (15,158 ounces) were purchased by this small country, which equaled 30% of total gold sales, from just one year earlier. Silver and platinum bullion sales grew noticeably as well.

The “gold rush” didn’t live long, however, as the central bank took measures to curb demand.

Argentina

Argentina’s annual inflation rate topped 26% in March last year, which, according to Bloomberg, made residents “desperate for gold.” Specific data is hard to come by because only one bank in the country trades gold, but everything we read had the same conclusion: Argentines bought more gold last year than ever before.

At one point, one bank, Banco Ciudad, even tried to buy gold directly from mining companies because it couldn’t keep up with demand. Some analysts report that demand has continued this year but that it has shown up in gold stocks.

What to Do—NOW

History clearly shows there is a direct link between inflation and gold demand. When inflation jumps, or even when inflation expectations rise, investors turn to gold in greater numbers. And when gold demand rises, so does its price—you can guess what happens to gold stocks.

With the amount of money the developed countries continue to print, high to hyperinflation is virtually inevitable. We cannot afford to believe in free lunches.

The conclusion is inescapable: One must buy gold (and silver) now, before the masses rush in. The upcoming inflationary storm will encompass most of the globe, so the amount of demand could push prices far higher than many think—and further, make bullion scarce.

Your neighbors will soon be buying. We suggest beating them to the punch.

Remember, gold speaks every language, is highly liquid anywhere in the world, and is a proven store of wealth over thousands of years.

But what to buy? Where? How?

We can help. With a subscription to our monthly newsletter, BIG GOLD, you’ll get the Bullion Buyers Guide, which lists the most trustworthy dealers, thoroughly vetted by the Metals team, as well as the top medium- and large-cap gold and silver producers, royalty companies, and funds.

Normally I’d suggest that you try BIG GOLD risk-free for 3 months, but right now, I can offer you something even better: ALL EIGHT of Casey’s monthly newsletters for one low price, at a huge 55% discount.

It’s called the Casey OnePass and lets you profit from the huge variety of investment opportunities we here at Casey Research are seeing in our respective sectors right now—from precious metals to energy, technology, big-picture trend investing, and income investing.

Click here to find out more. But hurry—the Casey OnePass offer expires this Friday, April 4.
 

The article Inflation Is Coming, What to Do—NOW was originally published at caseyresearch.com.

Crude Prices Drops on China Economy Worries

By HY Markets Forex Blog

Crude prices were seen falling on Tuesday; dragged lower by China’s manufacturing data which came in mixed, as traders raise concerns about the nation’s economy slowdown.

Talks over the crises in Ukraine continue as the tension between Russia and the Western powers over the country continue to weigh on oil prices. Meanwhile, analysts forecast US crude supplies increased for an eleventh week before the release of the data.

Futures for the North American WTI for May delivery declined 0.15% to $101.43 a barrel on the New York Mercantile Exchange at the time of writing, while Brent crude futures for May settlement slipped 0.10% to $107.66 a barrel on the ICE Futures Europe exchange at the same time. The European benchmark crude was at a premium of $6.35 to WTI.

Crude – Chinese Economy

A fresh government reports revealed that China’s manufacturing level grew at a faster rate in March as the Purchasing Managers’ Index (PMI) came in at 50.2 in March, compared to the previous reading of 50.1 seen in February.

In a separate report from HSBC Holdings Plc and Markit Economics revealed that China’s purchasing managers index dropped to 48.0 in March, the lowest since July and compared to the previous reading of 48.5 in February.

Apart from standing as the world’s second largest economy; China is forecasted to account for approximately 11% of the global oil demand this year, while the US is expected to account for 21%, according to forecasts from the International Energy Agency.

Ukraine

Following the talks between Russia and the US over the weekend on how to ease the ongoing tensions in Ukraine, Russia released a list of requirement that could ease the ongoing tension between the nations. As part of the political requirements is a request for military and political neutrality for Ukraine as well as protection of the Russian minority and acceptance of Crimea’s referendum.

Russia has begun to withdraw troops from Ukraine boarder.

The US crude stockpiles probably climbed to 385 million barrels in the week ending March, according to analysts’ forecasts before Wednesday’s report from the Energy Information Administration.


Visit www.hymarkets.com   to find out more about our products and start trading today with only $50 using the latest trading technology today

The post Crude Prices Drops on China Economy Worries appeared first on | HY Markets Official blog.

Article provided by HY Markets Forex Blog

Gold Prices Lifted on Mixed China Data

By HY Markets Forex Blog

Gold prices were seen trading higher on Tuesday, clearing losses seen in the previous session after the release of the mixed Chinese manufacturing data.

Gold futures for June delivery climbed 0.05% higher to $1,284.00 an ounce at the time of writing, while futures for the silver metal slipped 0.32% to $19.690 an ounce at the same time.

On Monday, the yellow metal prices dropped close to a six-week low, dragged down by the lower physical demand from Asia. Gold lost approximately $40 an ounce in the month of March after climbing by almost $120 an ounce from the start of the year to the end of February.

The US dollar index, which measures the strength of the greenback against six of its major peers, rose 0.02% higher to 80.1140, while holdings in the world’s largest gold-backed exchanged traded-fund, SPDR Gold Trust; came in at 813.08 tons on Monday.

Gold – China PMI

Reports revealed that China’s manufacturing level grew at a faster rate in March as the Purchasing Managers’ Index (PMI) came in at 50.2 in March, climbing from the previous reading of 50.1 seen in February.

In a separate report from HSBC Holdings Plc and Markit Economics revealed that China’s purchasing managers index dropped to 48.0 in March, the lowest since July and compared to the previous reading of 48.5 in February. A reading below 50 indicates contraction.

Gold – Fed Comments

On Monday, the Federal Reserve Chair Janet Yellen said the US economy will still need monetary stimulus to boost the economy before the release of today’s data which may reveal a gauge of manufacturing rose in March.

On March 19, Yellen said the US central bank might increase the benchmark interest rate in the next six months before the end of the asset-purchasing program, which is expected to end later in the year.


Visit www.hymarkets.com   to find out more about our products and start trading today with only $50 using the latest trading technology today

The post Gold Prices Lifted on Mixed China Data appeared first on | HY Markets Official blog.

Article provided by HY Markets Forex Blog

The U.S. Dollar Continued to Sell On a Rise

The EURUSD Retreating from Support Around 1.3720

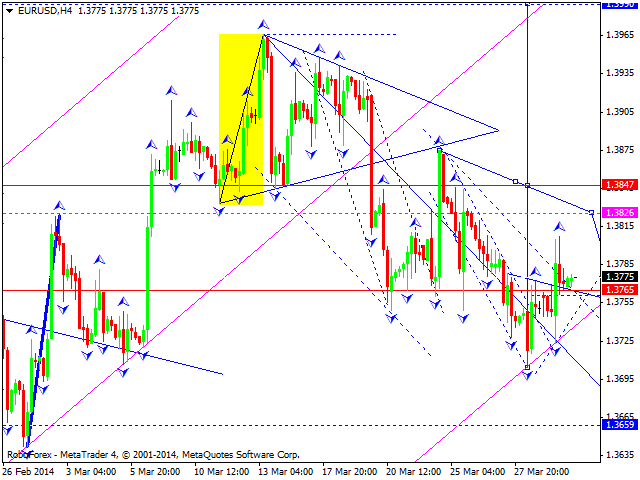
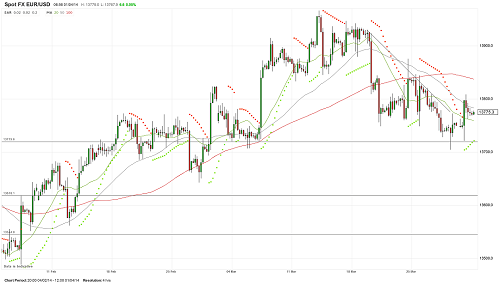
Another testing the support level of 1.3720 by the EURUSD was finished by a rebound and a rise to 1.3808. After failed attempts to break above, the pair retreated to the support around 1.3763. Its ability to hold bears` onslaught is a positive factor for the bulls, which keeps risks to grow to the 39th figure. On the whole, the picture remains unchanged; the pair is in a consolidation phase. To weaken a bullish impulse, the bears need to break below 1.3720—1.3700.

eur

A Positive Sentiment Towards the GBPUSD Remains

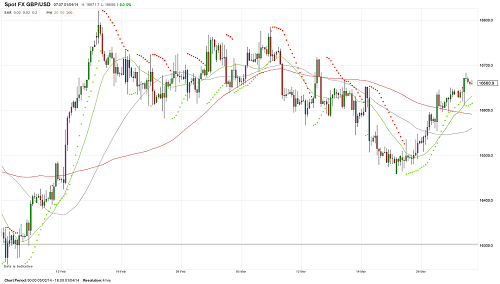
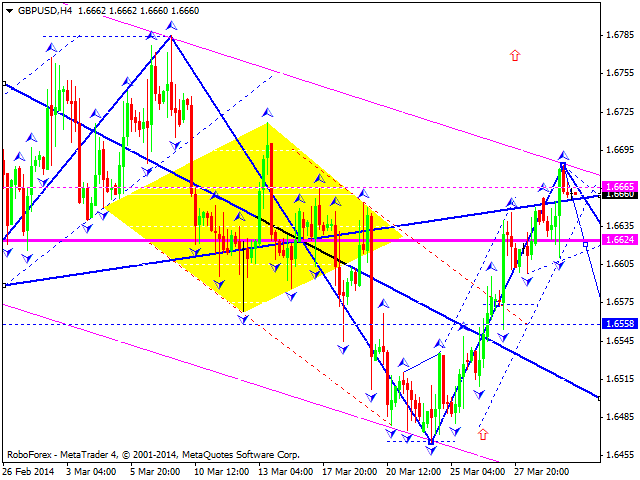
The GBPUSD continues to be bought on dips, so yesterday’s decline to the 1.6611 level has not continued. Instead of this, the pair increased to 1.6683. A positive sentiment remains, though it is not the fact that the bulls could move higher above the 67th figure. Nevertheless, it should not be excluded that it can be tested in the short run. Loss of the support around the 1.6596 level will weaken a bullish impulse and lead to falling to 1.6560—1.6540. Growth and ability to consolidate above the 67th figure will put the resistance around the 68th figure at risk.

gbp

The USDCHF Taking Risk to Resume a Decline

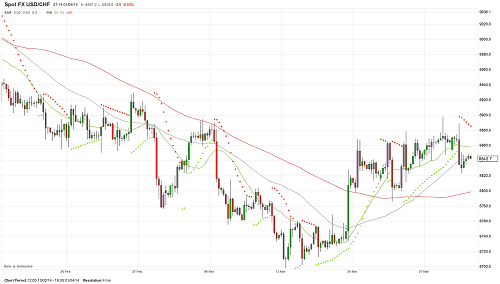
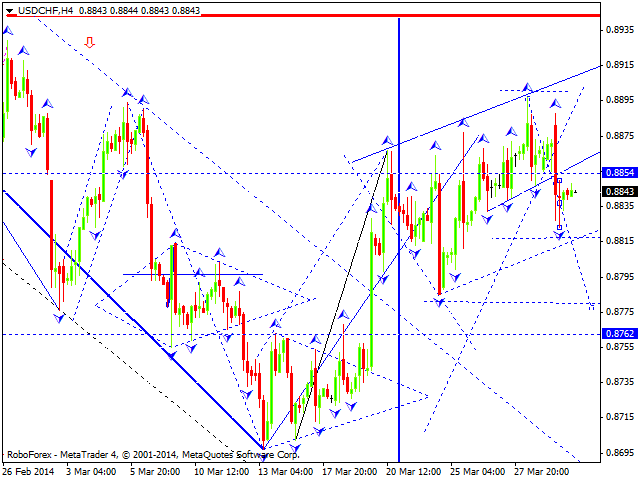
The ascending correction of the USDCHF hauled at the 89th figure, which failed to rise higher. Offers, which are located here, throw the dollar away while every attempt to attack it. Yesterday, after the figure was tested, the dollar decreased to 0.8824. Pressure on it remains and it is running a risk to be below 0.8800. Loss of the support will open the way to the 87th figure, a rise and an ability to consolidate above 0.8800 will return optimism to the dollar bulls.

chf

The USDJPY Can Test 103.76

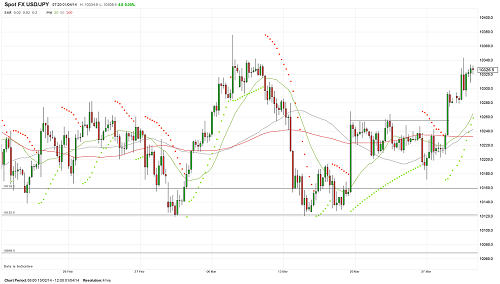
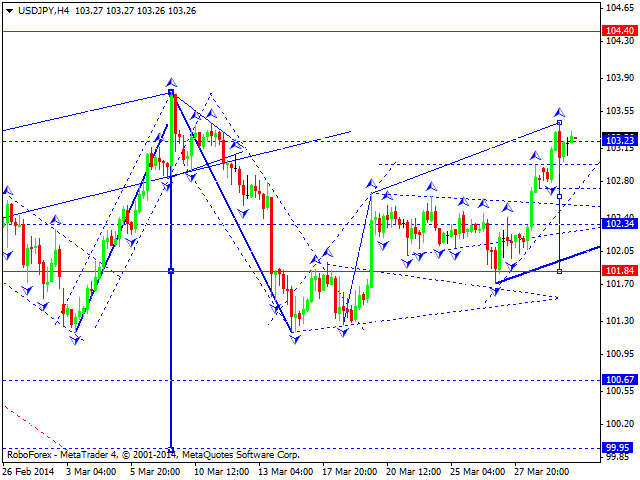
The USDJPY found support around the 102.79 level, from which it rose to 103.43. Dips continue to attract interest to sales that keeps risks to break resistance at 103.76. In this case the bulls can test the 104.00 level. If it is overcome, it will open the way to 102.00. Falling below 102.79 will weaken a bearish impulse and lead to testing 102.00. Ahead of employment data in the U.S. are published, the pair can move higher, but it is hardly possible to expect strong directed movements.

jpy

provided by IAFT


Forex Technical Analysis 01.04.2014 (EUR/USD, GBP/USD, USD/CHF, USD/JPY, AUD/USD, USD/RUB, GOLD)

Article By RoboForex.com

Analysis for April 1st, 2014

EUR USD, “Euro vs US Dollar”

Euro completed the third ascending impulse. We think, today price may form the fifth structure of this wave with target at 1.3826 and then start falling down towards level of 1.3765. Later, in our opinion, instrument may start new ascending wave towards level of 1.3990.

GBP USD, “Great Britain Pound vs US Dollar”

Pound reached new maximum and is still moving upwards. We think, today price may form consolidation channel and reversal pattern to start new descending wave with target at level of 1.6558.

USD CHF, “US Dollar vs Swiss Franc”

Franc completed another descending impulse and right now is consolidating near its minimum; this consolidation may be considered as the third wave. We think, today price may continue moving downwards to reach target at level of 0.8780.

USD JPY, “US Dollar vs Japanese Yen”

Yen rebounded from the upper border of its consolidation channel and may renew maximum of current wave. We think, today price may form reversal pattern to start new descending movement towards level of 100.00.

AUD USD, “Australian Dollar vs US Dollar”

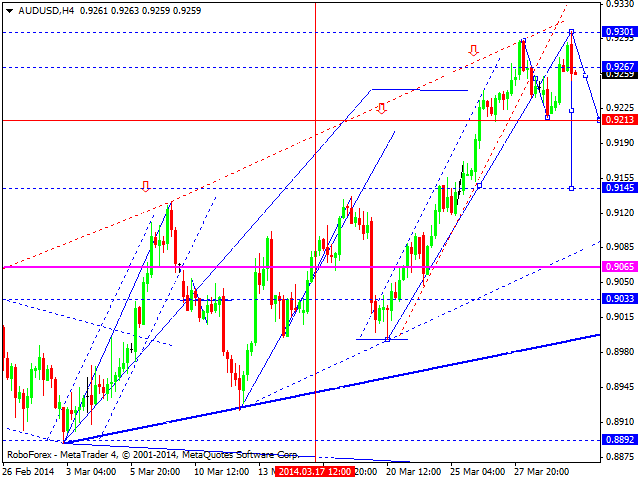
Australian Dollar formed another descending impulse. We think, today price may consolidate for a while and then form reversal pattern to start new descending movement towards level of 0.9200. Later, in our opinion, instrument may continue falling down to reach level of 0.9150.

USD RUB, “US Dollar vs Russian Ruble”

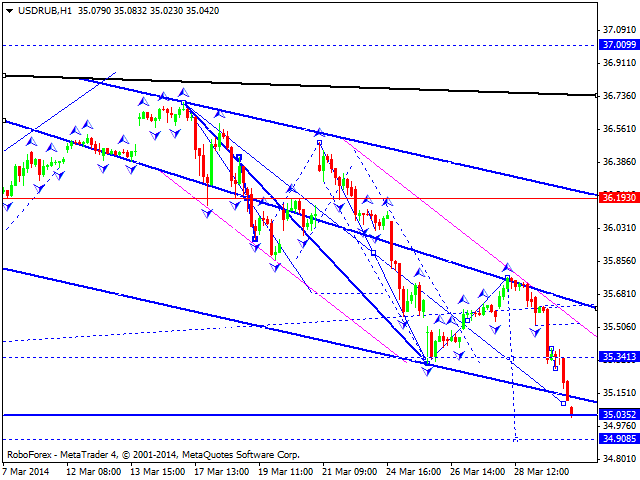
Ruble is still forming descending structure. We think, today price may reach level of 34.90 and then return to 36.20. Later, in our opinion, instrument may start new descending wave.

XAU USD, “Gold vs US Dollar”

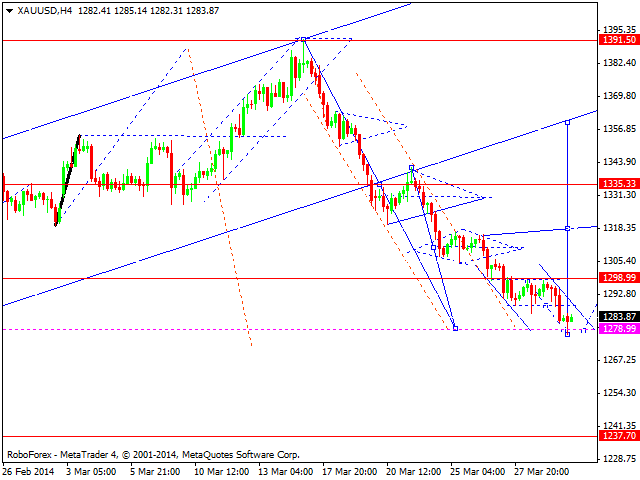
Gold reached target of its descending movement. We think, today price may consolidate for a while, form reversal pattern, and start forming new ascending wave. Target is at level of 1435.

RoboForex Analytical Department

Article By RoboForex.com

Attention!
Forecasts presented in this section only reflect the author’s private opinion and should not be considered as guidance for trading. RoboForex LP bears no responsibility for trading results based on trading recommendations described in these analytical reviews.


Wave Analysis 01.04.2014 (DJIA Index, Crude Oil)

Article By RoboForex.com

Analysis for April 1st, 2014

DJIA Index

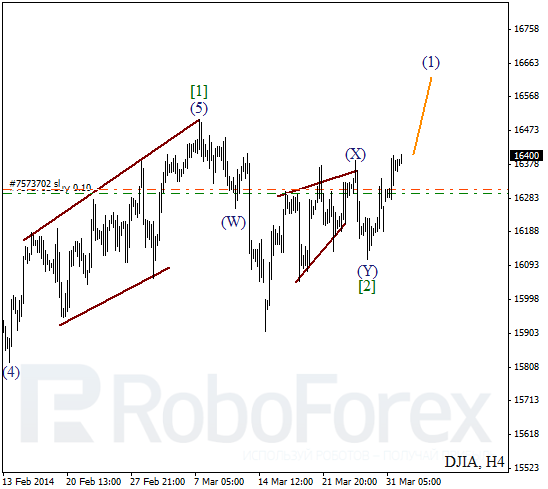
Index is starting new ascending movement. Possibly, wave [2] took the form of double three pattern. Probably, right now price is forming initial ascending impulses inside the third wave. Stop is already in the black. Later instrument is expected to break local maximum.

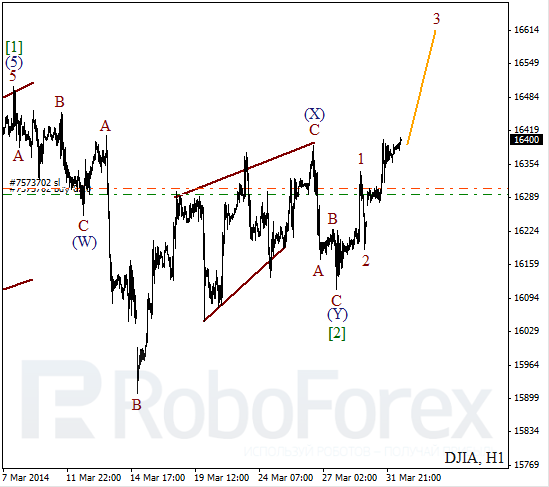
More detailed wave structure is shown on H1 chart. After completing zigzag pattern inside wave (Y), price formed ascending impulse. Most likely, after slight correction, instrument will continue growing up.

Crude Oil

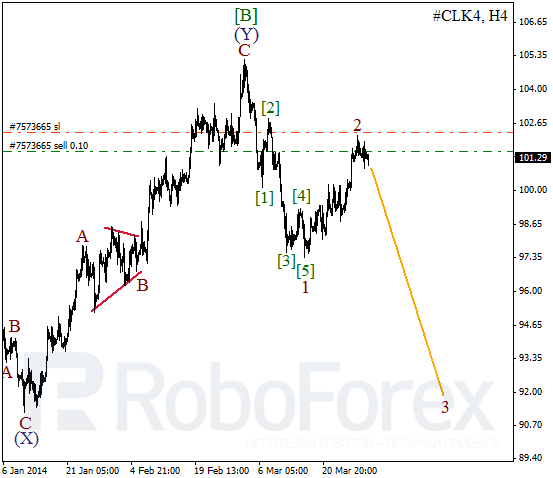
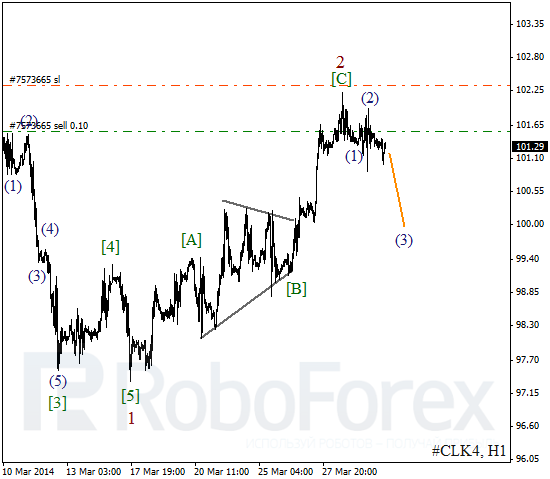
After completing initial impulse inside wave 1, Oil started new correction. Most likely, the second wave has been already completed and right now market is falling down inside the third one. I’ll move stop into the black right after instrument starts moving downwards.

As we can see at the H1 chart, Oil formed zigzag pattern inside wave 2. On minor wave level, price completed bearish impulse inside wave (1). Probably, during the day instrument may start moving downwards inside the third wave.

RoboForex Analytical Department

Article By RoboForex.com

Attention!
Forecasts presented in this section only reflect the author’s private opinion and should not be considered as guidance for trading. RoboForex LP bears no responsibility for trading results based on trading recommendations described in these analytical reviews.


EUR/USD Price Action For April 1st

Article by Investazor.com

EUR/USD Price Action For April 1st

The price made a false breakout below 1.3745, yesterday, and rallied very fast all the way to 1.3800. It did not close, on a 60 minutes chart, above this round level so it dropped back to 1.3761. A close below this local support could mean that the US dollar could get back to 1.3747. A close above the 200 EMA would be a positive signal which would confirm the Falling Wedge. Upside target is 1.3815.

Economic Releases

Even though Technical analysis is important and can help us trade profitable, it is very important to keep our eyes open for important economic releases which could move the market in an unexpected direction.

For today the most important indicators programed to be released are:

EU – Spanish Manufacturing PMI (08:15). In January and February, 2014, the Spanish manufacturing PMI was above estimation. In March it has been published under analysts’ forecasts. Today it is expected to be around 52.9. A release above this number would help the Euro gain, while a lower number could mean a drop for the European single currency.

The post EUR/USD Price Action For April 1st appeared first on investazor.com.

Strong Consumer Spending Pushes up US Stocks

By HY Markets Forex Blog

Stock options traders can use a wide array of information to attempt to predict market volatility, and something that should be on their radar in the coming months is consumer spending.

According to the U.S. Department of Commerce, household purchases increased the most in three months during February, which pushed U.S. stocks higher as shares rebounded. Experts told Bloomberg consumer spending growth won’t stop, which could be good news for stocks in the next couple of months.

“If consumers go back in and are confident enough to start spending again, that supports earnings and will certainly support  the equity market,” Chris Gaffney, senior market strategist at EverBank Financial, told the news source. “I feel like we’re forming a base that we can move high now.”

With the potential for consumer spending to continue to rise, stock options traders may want to use this information to their advantage. Consumer shares were some of the strongest following the Commerce Department’s announcement, as H&R Block Inc and GameStop Corp climbed at least 6.2 percent, which means these types of stocks could be good ones to bet on in the next few months.

One sign that spending could remain strong in the near future is the fact that consumer confidence surged from a 78.3 reading in February to 82.3 in March, according to the Conference Board.

“Consumer confidence improved in March, as expectations for the short-term outlook bounced back from February’s decline,” said Lynn Franco, director of economic indicators at The Conference Board.

Markets are difficult to predict, but information is available to help make educated estimates. Stock options traders can use consumer spending and confidence data to help predict market volatility, and all signs currently point to future increases.

The post Strong Consumer Spending Pushes up US Stocks appeared first on | HY Markets Official blog.

Article provided by HY Markets Forex Blog

Russia, US Talks Critical for Oil Prices

By HY Markets Forex Blog

Tensions have been high between Russia and the U.S. ever since President Vladimir Putin made his first move on the Crimea region in Ukraine. This situation has had an impact on numerous markets, including crude oil.

With the potential for significant sanctions placed on Russia, oil prices have been volatile, as these could cut much of the world off from the Russia oil and gas sector. Investors who take part in crude oil trading will want to keep a close eye on talks between Russia and the U.S.

According to The Associated Press, U.S. Secretary of State John Kerry and Russian Foreign Minister Sergei Lavrov met and agreed that there needs to be a diplomatic resolution. However, nothing is etched in stone, and if talks break off, oil prices could rise, which is something traders need to keep a close eye on.

“The plentiful supply, particularly from Saudi Arabia and Iraq, is offset by the ongoing production outages in Libya and the – albeit fairly remote – prospect of the West imposing sanctions on the Russian oil and gas sector,” said a report from Commerzbank in Frankfurt.

One sign that tensions could be de-escalating is the fact that President Putin told German Chancellor Angela Merkel he would pull some Russian troops from near the border with Ukraine, according to NPR. In response, oil prices may decline, as the threat of the rest of the globe of being cut off from Russia’s supply decreases. This is valuable information for crude traders, as it could allow them to get out ahead of market fluctuations.

The post Russia, US Talks Critical for Oil Prices appeared first on | HY Markets Official blog.

Article provided by HY Markets Forex Blog