Learn to Trade Japanese Candlesticks Like the Pros!

So what is a Japanese candlestick?

In order to understand the term “Japanese candlestick”, we need to go back to the 17th century when the Japanese were using technical analysis to trade rice. Yes, technical analysis is that old! The history of the Japanese candlestick is a bit of a mystery and is mostly left to stories, but we do know that much of the credit belongs to a legendary rice trader by the name of Homma from the town of Sakata. His original ideas and concepts have no doubt been modified since then, but his early development of the candlestick pattern laid the path for further refinement.

picture of charles dow

The Japanese candlestick techniques made popular by Homma later made their way to the US around 1850, where technical analysis and price action were further developed by Charles Dow. You may recognize the name. Charles Henry Dow founded the Wall Street Journal and later invented the Dow Jones Industrial Average as part of his ongoing market research as it relates to price action. You read that correctly, the founder of both the Wall Street Journal and the Dow Jones Industrial Average was adamant about Japanese candlesticks and price action. So much for price action being some form of “hocus pocus” as some fundamental traders have claimed.

The Anatomy of a Japanese Candlestick

Now that we have a better understanding of how  the Japanese candlestick was developed and where it came from, let’s discuss what it is and how we can use it to trade price action. However, before we can use the pattern to trade price action, we need to understand the anatomy of the Japanese candlestick…what makes it “tick”. Pun intended 😉

More: Japanese Candlestick

Justin Bennett is a full-time Forex trader and Owner of Daily Price Action. His Forex trading career began 6 years ago and has followed a path similar to many traders. For the first 3 years he tried nearly every indicator and strategy known to man, but each time the journey ended where it began, frustrated and in search of the next “holy grail” that would bring consistent profits. It wasn’t until he cleared every indicator from his chart that he had his “ah ha” moment. For the past 3 years, Justin has worked to perfect that moment into something that can be easily duplicated by other traders in search of consistent profits.


Crude Prices Drops, Trimming Previous Gains

By HY Markets Forex Blog

Crude prices were seen trading lower on Friday, but holding on to its highest in a month amid the ongoing crises in Ukraine as talks over the tension between the country and Russia and gas supplies are expected to be held. Crude exports from Libya are expected to resume within the next five days.

The North American West Texas Intermediate (WTI) crude for May delivery edged 0.33% lower to $103.07 a barrel on the New York Mercantile Exchange at the time of writing, while Brent crude for May settlement dropped 0.24% to $107.21 a barrel on the ICE Futures Europe exchange at the same time. The European benchmark Brent crude was at a premium of $4.13 to WTI.

Crude – Ukraine Crises

As the ongoing talks between Russia and the Ukrainian central government continues, investors worry over Russia’s gas disruption threat.

In a letter sent to the European leaders, the Russian President Vladimir Putin warned that the increasing debt of Ukraine’s gas threatened supplies to Europe. Gazprom considered forcing Ukraine to pay for gas supplies in advance, however Ukraine refused to pay nearly double the price for the commodity, according to reports.

Libya

In Libya, oil exports from one of the eastern ports are expected to begin within the next five days, Ibrahim Al Awami, the oil ministry measurement director said on Thursday. Approximately 1 million barrels is expected to be loaded by next week, the terminal can handle approximately 8.5% of the country’s export capacity of 1.3 million.

On Thursday, the Organization of the Petroleum Exporting Countries (OPEC) said its production fell by more than half a million barrels a day in March to 29.6 million barrels a day.


Visit www.hymarkets.com   to find out more about our products and start trading today with only $50 using the latest trading technology today

The post Crude Prices Drops, Trimming Previous Gains appeared first on | HY Markets Official blog.

Article provided by HY Markets Forex Blog

Stocks In Europe Edges Lower

By HY Markets Forex Blog

Stocks in Europe were seen falling on the last day of the trading week, following a heavy decline in the US and Asia.

The pan-European Euro Stoxx 50 declined 1.11% to 3,116.50 at the time of writing, while the French CAC 40 edged 1.16% lower to 4,362.30. At the same time the German DAX declined 1.49%, trading at 9,312.80, while the UK’s benchmark FTSE 100 lost 1.21% to 6,561.30.

The global outlook was affected by the steep declines in the US overnight, where the Nasdaq Composite index ended the session dropping to 2.3%, the most since 2011. While Standard Poor’s 500 Index closed the session with a fall of 1.8%.

Germany CPI 

In Germany, the country’s consumer price index climbed 0.3% higher in March on a monthly basis, compared to the previous reading of 0.5% seen in February, reports from the Federal Statistical Office showed. The reading came in line with analysts’ forecasts.

Stocks – Session Losses

The British broker Hargreaves Lansdown dropped 4.83% to 1,260 pence per share, while the chip designer ARM Holdings edged 3.5% lower.

German Steel producer, Salzgitter AG climbed 2.4% higher after Citigroup Inc suggested that investors should sell-off the company.

Russia Tensions

The President of the World Bank, Jim Yong Kim said on Thursday that the ongoing crises between Russia and Ukraine could cause the Russian economy to shrink by approximately 1.8% this year.


Visit www.hymarkets.com   to find out more about our products and start trading today with only $50 using the latest trading technology today

The post Stocks In Europe Edges Lower appeared first on | HY Markets Official blog.

Article provided by HY Markets Forex Blog

Oil Prices Decline on Weak Chinese Trade Data

By HY Markets Forex Blog

After increasing to a five-week high, oil prices slipped following a report that showed weak trade data from China. The relationship between the Chinese economy and oil prices is one investors who participate in crude oil trade should pay close attention to, as the Asian nation surpassed the U.S. as the world’s biggest energy consumer in 2013, according to The Wall Street Journal.

This relationship can help oil traders predict market volatility, as a poor economy could reduce Chinese demand for oil. As a result, the price of oil may fall, as demand is down from the world’s largest energy consumer.

The fear is that these latest trade numbers from China signal a gradual slowdown in the country’s economy. According to ABC News, Chinese imports of crude oil were at the lowest in five months at 5.54 million barrels in March. This is related to the struggle that leaders have had reaching the target of 7.5 percent economic growth this year.

However, oil prices aren’t falling too much on the new Chinese data, as concerns over tension in Russia and Libya has created uncertainty for some of the world’s supply, according to Reuters.

“The market was knocked last night by the Chinese import export data – it was a bearish double whammy,” Matt Smith, analyst at Schneider Electric in Louisville, Kentucky, told Reuters. “But we’re loath to move lower given the dual concern of Moscow and Libya, where there is uncertainty as to when control of those ports will transfer power.”

Moving forward, oil traders should keep an eye on the Chinese economy as any further slowdown could have a much bigger impact on the crude market.

The post Oil Prices Decline on Weak Chinese Trade Data appeared first on | HY Markets Official blog.

Article provided by HY Markets Forex Blog

Wave Analysis 11.04.2014 (DJIA Index, Crude Oil)

Article By RoboForex.com

Analysis for April 11th, 2014

DJIA Index

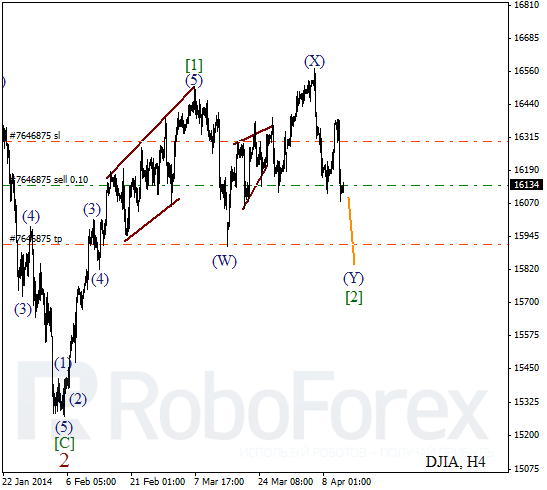
Index is still being corrected. Probably, price is forming double zigzag pattern inside wave [2] with descending wave (Y) inside it. Most likely, during the next several days instrument will break minimum of wave (W) and then start new ascending movement.

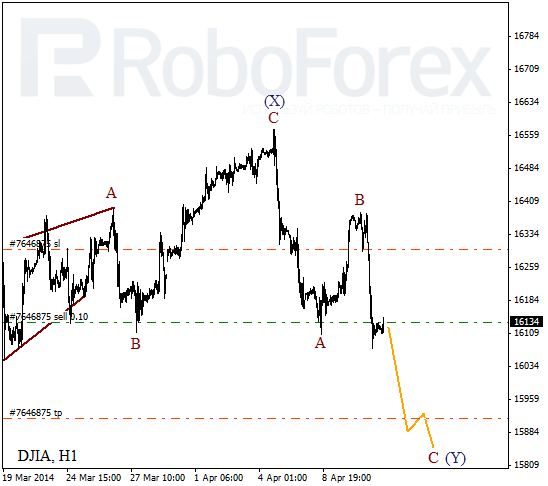
More detailed wave structure is shown on H1 chart. It looks like price is forming zigzag pattern inside wave (Y). On minor wave level, Index completed initial impulse inside wave C, which means that after local correction instrument may continue falling down.

Crude Oil

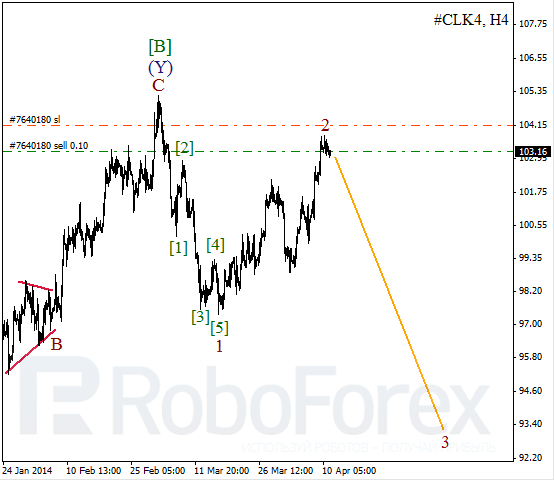
Forecast is still bearish. Earlier Oil finished bearish impulse inside wave 1 and right now is completing the second wave. While price was forming first initial impulses, I opened sell order. In the future, I’m planning to increase my short position.

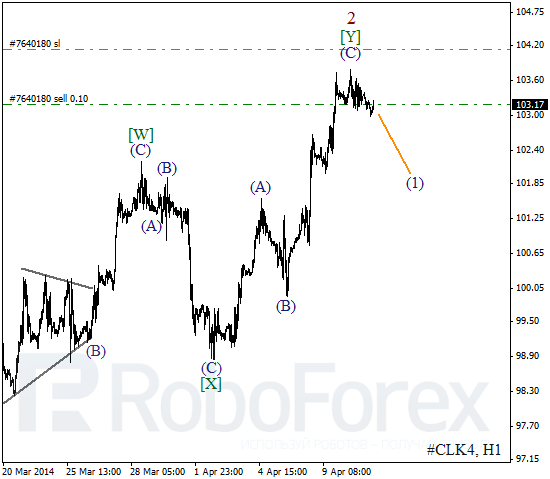
As we can see at the H1 chart, Oil completed zigzag pattern inside wave [Y]. Probably, price started forming bearish wave (1). I’ll move stop into the black as soon as market starts moving downwards.

RoboForex Analytical Department


Article By RoboForex.com

Attention!
Forecasts presented in this section only reflect the author’s private opinion and should not be considered as guidance for trading. RoboForex LP bears no responsibility for trading results based on trading recommendations described in these analytical reviews.


Forex Technical Analysis 11.04.2014 (EUR/USD, GBP/USD, USD/CHF, USD/JPY, AUD/USD, USD/RUB, GOLD)

Article By RoboForex.com

Analysis for April 11th, 2014

EUR USD, “Euro vs US Dollar”

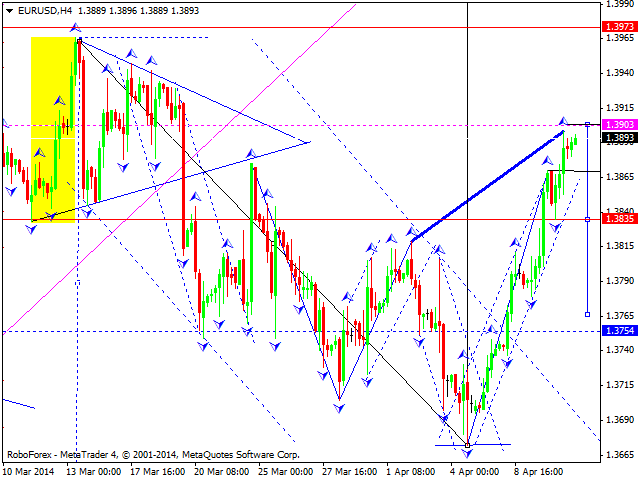
Euro expanded its consolidation upwards and is still moving inside ascending channel. We think, today price may fall down to expand this consolidation channel downwards. The first target is at level of 1.3754.

GBP USD, “Great Britain Pound vs US Dollar”

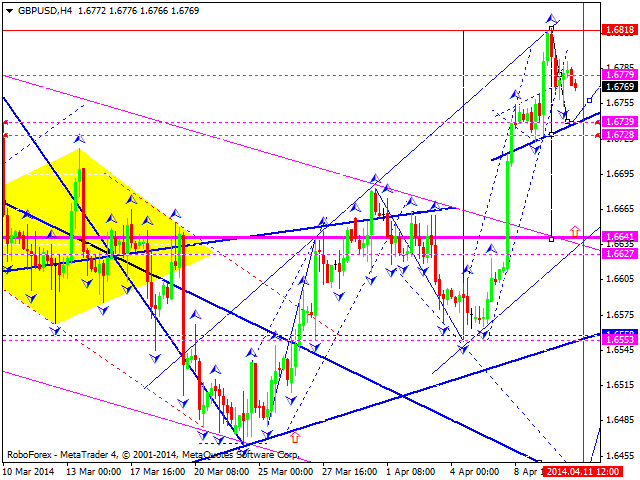
Pound continues forming descending impulse. We think, today price may reach the first target at level of 1.6740, grow up to return to 1.6780, and then continue falling down towards level of 1.6640.

USD CHF, “US Dollar vs Swiss Franc”

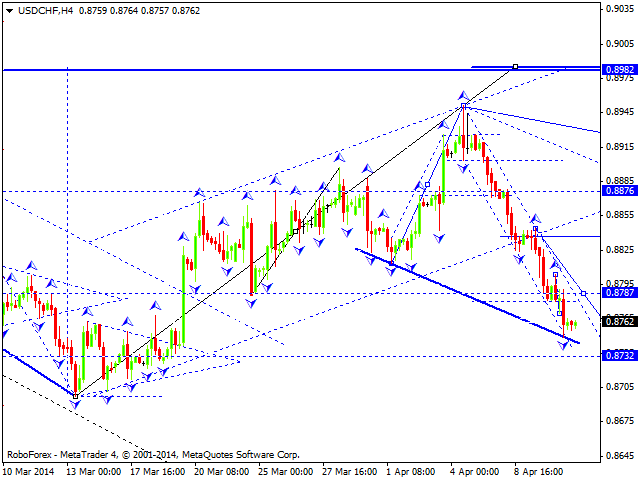
Franc is still moving inside descending structure. We think, today price may fall down to reach level of 0.8730 and then start new correction towards level of 0.8840.

USD JPY, “US Dollar vs Japanese Yen”

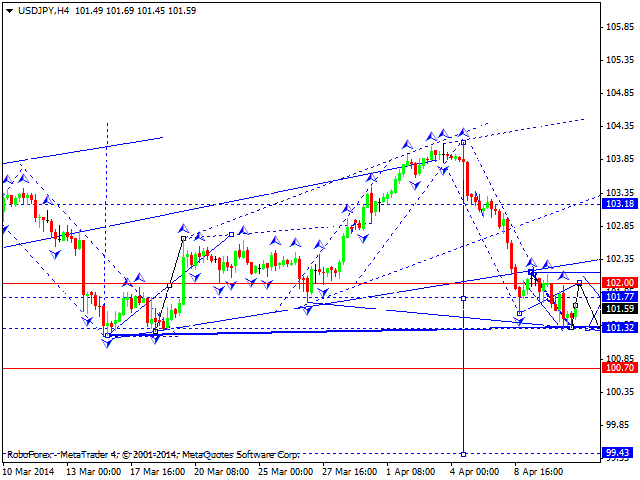
Yen is still consolidating; market completed another descending structure and reached new minimum.  We think, today price may continue falling down towards level of 100.00 without returning to level of 103.00. Alternative scenario implies that pair may start new correction towards level of 103.00 and only after continue moving downwards to reach level of 100.00.

AUD USD, “Australian Dollar vs US Dollar”

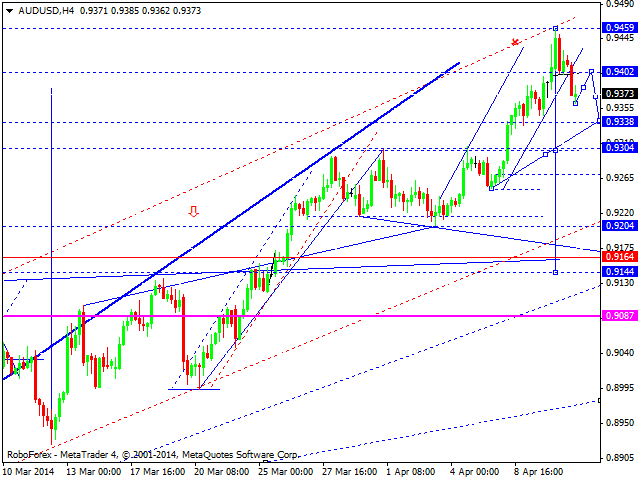
Australian is forming the second descending impulse. We think, today price may correct this impulse towards level of 0.9400 and then form the third descending wave with target at 0.9330. Later, in our opinion, instrument may continue forming head & shoulders reversal pattern by moving towards level of 0.9400. Target of this pattern is at 0.9150.

USD RUB, “US Dollar vs Russian Ruble”

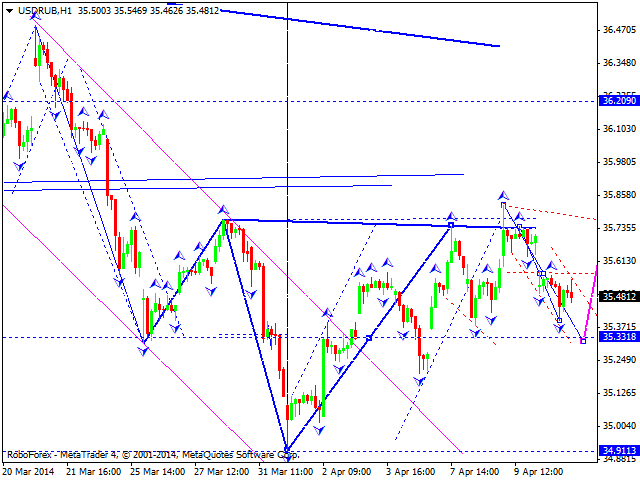
Ruble is still being corrected towards level of 35.33. Later, in our opinion, instrument may ascending wave to break level of 35.80 and then continue growing up towards local target at level of 36.20.

XAU USD, “Gold vs US Dollar”

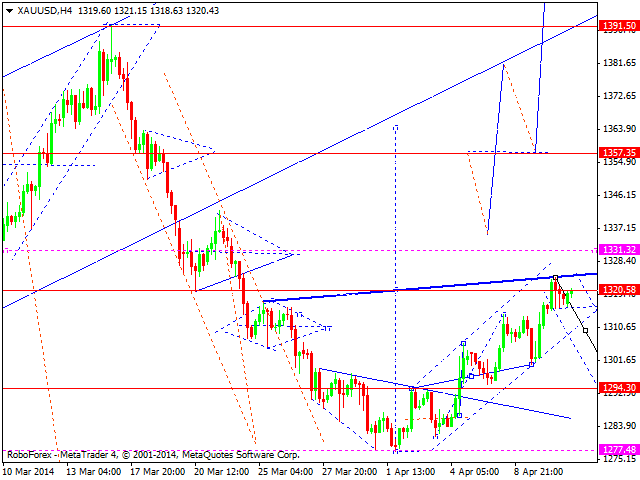
Gold is still consolidating near level of 1320. We think, today price may form reversal pattern to start new correction towards level of 1295. Later, in our opinion, instrument may start new ascending movement towards next target at 1357.

RoboForex Analytical Department

Article By RoboForex.com

Attention!
Forecasts presented in this section only reflect the author’s private opinion and should not be considered as guidance for trading. RoboForex LP bears no responsibility for trading results based on trading recommendations described in these analytical reviews.


AUDUSD pulled back from 0.9461

Being contained by the upper line of the price channel on 4-hour chart, AUDUSD pulled back from 0.9461, suggesting that consolidation of the uptrend from 0.8924 is underway. Deeper decline would likely be seen, and the target would be at the lower line of the channel. However, as long as the channel support holds, the uptrend could be expected to resume, and one more rise to 0.9600 to complete the upward movement is still possible. Only a clear break below the channel support could signal completion of the uptrend.

audusd

Provided by ForexCycle.com

Peru holds rate, H1 growth to be lower than expected

By CentralBankNews.info
     Peru’s central bank maintained its monetary reference rate at 4.0 percent, as expected, and said recent data and surveys pointed to economic growth that would be lower than expected in the first  half of this year.
    The Central Bank of Peru (BCRP), which last cut its rate by 25 basis points in November as a preventative move, also reiterated that inflation was forecast to remain close to the upper band of its target range due to the lagging effect of supply shocks but then converge toward 2 percent, the midpoint of the central bank’s 1-3 percent tolerance range for inflation.
    Peru’s inflation rate eased to 3.38 percent in March from 3.78 percent in February, with inflation without food and energy dropping to 2.78 percent from 2.96 percent.
   Last week a spokesman for the central bank said inflation this year is likely to be around 2.4 percent of 2.5 percent instead of 2 percent as previously estimated. In 2013 inflation was 2.8 percent.
    The BCRP, which has been lowering its reserve requirements several times over the past year, added that “if necessary, it will implement additional measures to ease its monetary policy instruments.”
    On April 1 the central bank lowered the reserve requirements on bank accounts in the sol currency to 12.0 percent from 12.5 percent to improve credit conditions.

    Peru’s Gross Domestic Product expanded by 1.8 percent in the fourth quarter of last year from the third quarter for annual growth of 5.2 percent, up from 4.5 percent.
    In January the economy grew by an annual 4.23 percent, but BCRP President Julio Velarde said last month that growth in February and March would definitely be faster than January, which was affected by a dip in output from a large mine.
    Velarde also said growth this year was expected to reach 6 percent, or 5.9 percent, though tepid economic activity in China, the biggest buyer of Peruvian metals, could lead to lower growth.
    In 2013 Peru’s economy grew by 5.02 percent and the International Monetary Fund forecasts growth this year of 5.5 percent and 5.8 percent in 2015.

    http://ift.tt/1iP0FNb

Why Regulation Isn’t Going To Stop Australian Banks From Risky Lending

By MoneyMorning.com.au

Dear reader, you already know this: Money Morning holds no love for the central bankers of the world. But we’ll grudgingly credit the Bank of England for releasing a paper on how the modern financial system creates money. It removes the fantasy most people have about how the system works. Read it if you can. But it boils down to this: banks create credit. They do not lend the money deposited by savers.

The fantasy is that we all diligently work hard, save our pennies and then the banking system lends this on at interest to productive enterprise. The reality is that banks create bank deposits when they make loans. The loan brings new money into existence. Money from nothing. Or as the paper puts it, ‘For this reason, some economists have referred to bank deposits as “fountain pen money”, created at the stroke of bankers’ pens when they approve loans.

No stability in the system

One role of the central bank in our current system is to keep a rein on this credit creation. That’s why you might have seen the recent story about the Reserve Bank of Australia considering additional measures to limit risky lending in the Australian housing market. Here’s a clip from The Age recently:

The Reserve Bank’s preferred way of reining in a harmful housing credit boom would be to force banks to impose higher "buffers" when testing how borrowers coped with higher interest rates, new documents show.

But unlike its counterpart in New Zealand, Australia’s central bank appears unconvinced about restricting loans with high loan-to-valuation ratios.

‘With banks competing fiercely to sign up new borrowers, documents released under Freedom of Information laws on Monday show the Reserve Bank has examined various options for limiting riskier lending.

If you feel a sense of comfort or security at the idea of more regulation preventing banks from lending money and making it easy for people to get credit until they blow themselves up, we urge you to heed the work of our colleague Phil Anderson.

He’s studied real estate and banking going back 200 years, primarily in the USA. And one conclusion is this: in the wake of every banking crisis for two centuries, the authorities took steps to ‘stabilise’ the system and prevent a future crisis with additional regulations and controls. And for 200 years, major banks have kept collapsing with regular monotony — roughly every 18 years.  Indeed, the scale and numbers get bigger over time.

Take the following examples from Phil’s work since 1970:

In October 1973 the collapse of the US National Bank of San Diego was the biggest in 40 years.

‘An even bigger bank failure followed twelve months later, in October 1974, the Franklin National Bank of New York.

Then in 1989:

For the Bank of New England (BNE), the collapse of real estate values brought difficulties in the form of non-performing loans…The taxpayer funded bailout would ultimately cost $2.3 billion after the FDIC and Reserve Bank decided the bank was simply “too big to fail”.

And in 2008:

The failure of IndyMac Bancorp is the second biggest bank failure in US history, and the largest regulated Savings and Loan institution failure.

Don’t be suckered by the hubris of the RBA

Of course, we’re not suggesting the Australian banks are going to fall over any time soon. We’re just pointing out why you should be sceptical of any claims you hear from economists, politicians and bankers about how ‘risky lending’ is now contained, because they’ve been saying the same thing for decades, and been proven wrong at some point every time.

We vividly recall Trevor Sykes in his book The Numbers Game quoting the former Westpac Chairman Sir James Foots in the opening statement of the 1988 annual report, where Foots declared ‘a splendid performance’ by the bank. It was after a 69% profit increase for 1987–88. What happened in the next four years? Westpac wrote off $6.3 billion in faulty loans and had to have a $1.2 billion rights issue to maintain its capital base. It almost went broke.

We don’t know much more about Sir Foots. But we’ll assume he was just not looking in the right place at the time. Ben Bernanke had the same problem. Even the idolised Warren Buffett said in 2007, ‘Subprime mortgages do not pose a huge danger to the economy, and it’s unlikely that this factor will trigger anything of a massive nature in the general economy.

Everything looks easy in hindsight, so we’re not laughing at these sanguine claims. But Phil’s work suggests banking failures will be here for a long time to come, as long as banks can create credit, especially against capitalised land value. This is how he called the GFC before it happened.

To find out more about how Phil views the economy, you should check out a free series of videos he’s doing with Dan Denning so you don’t get caught by these type of events. He says you’ll be alright if you time your investments within the rhythm of what he calls the real estate cycle.

Callum Newman+
Contributing Editor, Money Morning

Publisher’s Note: Gain Priority Access to an exclusive FREE six-part video series where Phil Anderson, the world’s foremost authority on real estate, stock and commodity cycles reveals the secret life of the investment markets… You’ll learn what’s next for Australian stocks…why real estate and stock market cycles repeat every 18 years…why this means we’re just one year into a historic 14-year housing boom…what it means for Aussie resources…and much more. All you need to do is just click HERE.

From the Port Phillip Publishing Library

Special Report: Mining Boom Act II

Join Money Morning on Google+


By MoneyMorning.com.au

US ‘Stirring up Trouble’ in South China Sea

By MoneyMorning.com.au

US Defense Secretary Chuck Hagel came under some heavy fire Tuesday morning in Beijing…

China’s development can’t be contained by anyone,’ defiantly proclaimed China’s defense minister, Chang Wanquan.

The China-US relationship is neither comparable to US-Russia ties in the Cold War, nor a relationship between container and contained,’ he concluded. Wanquan’s statement was made not long after he stood shoulder to shoulder with his American counterpart at the People’s Liberation Army National Defense University.

Hagel was sharply questioned by Chinese officers,’ relays a Reuters report from the scene. ‘One of them told Hagel he was concerned that the United States was stirring up trouble in the East and South China Sea because it feared someday “China will be too big a challenge for the United States to cope with.’’’

Maybe…just maybe, the bold Chinese officer was referencing the US encirclement of the Middle Kingdom. Yet Hagel assured them that in ‘the American rebalance to Asia-Pacific…our strategic interest is not to contain China… It never has been.

Just moments earlier, he formally re-announced the latest addition to the US presence in the Pacific — two more Navy missile defense ships deployed by 2017 — to protect from an attack from North Korea, of course.

Semantically, Hagel is right. The term ‘containment’ hasn’t been bandied about in reference to China.

‘Pivot’ has.

It was November 2011 when then Secretary of State Hillary Clinton uttered the phrase, ‘The United States stands at a pivot point.’ That meant shifting troops out of the Middle East…and moving more than half of the empire’s naval might to East Asia. Since then, we’ve written that Clinton’s pivot could go down in history as a declaration of a new cold war.

Can’t you hear the top brass cheering in the background?

In an interview, Colin Powell remembered an encounter he had with Mikhail Gorbachev in one of the last years of the Soviet Union.

Ah, General,’ said Gorbachev, ‘I’m so sorry, you’ll have to find a new enemy.

Searching for the next few decades…all the US found were the Saddam Husseins of the world…and terrorism at large. How lame.

Alas, 25 years later, China has become America’s default adversary. From 2003-2012 China has increased its military expenditures by 175%. The U.S. over that period? Just 32%.

Granted, the US spends the most money on defense of all nations, and China is compounding a lesser military might than the US — but it’s still indicative of the buildup going on. And barring serious economic setbacks (such as those Greg Canavan sees in China’s — and Australia’s — future), we don’t see the trajectory changing.

As for the prospect of conflict between the two nations, the same powder keg — a group of uninhabited islands in the East China Sea — lies in wait of a spark.

The lines crisscrossing the map nearby represent the competing territorial claims of not only China and the Philippines, but three more nations as well. The long, U-shaped line is China’s claimed domain.

Speaking in Beijing this morning, Hagel kept American troops and treasure on the hook. Speaking about Japan and the Philippines, he said, ‘We have mutual self-defense treaties with each of those two countries. And we are fully committed to those treaty obligations.

At the risk of sounding like a broken record, we remind you that the empire has a logic of its own. ‘America,’ wrote Independent Institute scholar Ivan Eland recently, ‘is now borrowing money from China to subsidise the defense of rich East Asian allies in their quest to militarily counter…well…China.

Given the pettiness of the situation, let’s hope the region’s military buildup will prove a big waste of money. In the meantime, we’ll continue to follow that flow of dollars and cents on your behalf. At the very least, perhaps you can recoup some of your tax dollars with the right investments.

Addison Wiggin,
Contributing Editor, Money Morning

Ed Note: The above article was originally published in The Daily Reckoning US.

From the Archives…

Why You Should Avoid the ‘Fake Contrarians’ and ‘Do Nothing Investors’
05-04-14 – Kris Sayce

Join Money Morning on Google+


By MoneyMorning.com.au