Copper Climbs on China Government Data

By HY Markets Forex Blog

Copper prices were lifted for a second day on Tuesday. The China’s disappointing manufacturing data and bets on potential government stimulus help boost the commodity.

Copper futures for May 14 delivery traded 0.93% higher at the time of writing, bouncing back from the previous losses seen in the previous session after China reported its disappointing Purchasing Managers’ Index (PMI).

Copper – China

China Purchasing Mangers’ Index for March from HSBC Holdings Plc and Markit Economics came in 48.1 lower, compared to analysts’ estimates of 48.7 and a final reading of 48.5 seen in the previous month.  The figures shows an economic slowdown in China; the world’s second largest oil consumer. A figure below 50 indicates a contraction and above indicates expansion. The slowdown in the nation’s economy is mainly due to the weak domestic demand, as analysts predict Beijing to launch policy measures to ensure steady economy growth. The manufacturing output index dropped to an 18-month low of 47.3 in March, compared to 48.8 seen in the previous month.

“The slowdown in China’s manufacturing sector points to continued weakness in the prices of industrial metal,” Capital Economics wrote in a research note on Tuesday.

Adding, “Admittedly, copper has already fallen to within a whisker of our end-2014 forecast of $6,350 per ton and with strong growth in supply, a squeeze on the use of metals as collateral, and no immediate catalysts for a rebound in final demand, copper prices may well fall further.”

China’s Prime Minister, Li Keqiang tipped-off possible efforts to stabilize the economy growth to maintain employments at appropriate levels, which is currently over the official growth target of 7.5%.


Visit www.hymarkets.com   to find out more about our products and start trading today with only $50 using the latest trading technology today

The post Copper Climbs on China Government Data appeared first on | HY Markets Official blog.

Article provided by HY Markets Forex Blog

Oil Prices Drops Before Crude Stockpiles Report

By HY Markets Forex Blog

Oil prices were seen trading lower on Tuesday as the North American WTI crude dropped for the first time in three days on forecasts that crude stockpiles climbed for the tenth week in the US, the biggest oil user in the world.

WTI for May delivery lost 34 cents to $99.26 a barrel on the New York Mercantile Exchange at the time of writing. While Brent crude for May settlement edged 19 cents lower to $106.62 a barrel on the ICE Futures Europe exchange. The European benchmark crude was at a premium of $7.16 to WTI.

Crude stockpiles in the US most likely added 2.5 million barrels in the last week, according to analysts forecast before the Energy Information Administration report due on Wednesday.

Oil – US Crude Supplies

US fuel supplies climbed to 375.9 million barrels in the week ending March 14, the highest since November, according to reports from the EIA. While refinery units are closed for maintenance in winter and will reopen in the spring to meet the demand for gasoline.

Distillate inventories, including heating oil and diesel, is expected to show a drop by 1.1 million, according to analysts, while gasoline stockpiles is forecasted to have slid by 1.7 million barrels last week.

A separate stockpile report is expected to be released by the American Petroleum Institute later in the day.

Meanwhile, the closure of the Houston Ship Channel is expected to weigh on crude prices. There are 140 vessels waiting to go through the Houston Ship Channel, according to the Coast Guard.

Oil – Russia

On Monday, the Western nations, including the US and the European Union met in Hague and imposed tougher sanctions against Russia, as Russia is expected to be excluded from the G8 if the ongoing tensions do not ease.

Russia is increasing its military along the border with Ukraine, which may signal further territorial changes within the region.


Visit www.hymarkets.com   to find out more about our products and start trading today with only $50 using the latest trading technology today

The post Oil Prices Drops Before Crude Stockpiles Report appeared first on | HY Markets Official blog.

Article provided by HY Markets Forex Blog

USDCHF Forex Trading Pivot Point Levels for 2014.03.25

2014.03.25 12:30 6:30AM ET | USDCHF Currency Pair

SC USDCHF 2014.03.25

Here are the Pivot Points Levels with Support (S) and Resistance (R) for the USDCHF currency pair today. Price action is currently trading at the 0.88289 price level and over the daily pivot point, according to data at 6:30 AM ET. The USDCHF high for the day has been 0.88333 while the low of day has fallen to 0.88001. The pair earlier today opened the Asian trading session below the daily pivot and has trended higher and through the daily pivot this morning.

Daily Pivot Point: 0.88195
— S1 – 0.87737
— S2 – 0.87401
— S3 – 0.86943
— R1 – 0.88531
— R2 – 0.88989
— R3 – 0.89325


Weekly Pivot Points: USDCHF

SC USDCHF 2014.03.25

Prices are currently trading over the weekly pivot point (0.8802) at time of writing. The USDCHF has been on an overall sideways trend so far this week after opening the trading week above the weekly pivot and finding support below the weekly pivot area.

Weekly Pivot Point: 0.88027
— S1 – 0.87371
— S2 – 0.86474
— S3 – 0.85818
— R1 – 0.88924
— R2 – 0.89580
— R3 – 0.90477


By CountingPips.com – Forex Trading Apps & Currency Trade Tools

Disclaimer: Foreign Currency trading and trading on margin carries a high level of risk and volatility and can result in loss of part or all of your investment. All information and opinions contained do not constitute investment advice and accuracy of prices, charts, calculations cannot be guaranteed.


USDJPY Forex Trading Pivot Point Levels for 2014.03.25

2014.03.25 12:30 6:30AM ET | USDJPY Currency Pair

SC USDJPY 2014.03.25

Here are the Pivot Points Levels with Support (S) and Resistance (R) for the USDJPY currency pair today. Price action is currently trading at the 102.227 price level and under the daily pivot point, according to data at 6:30 AM ET. The USDJPY high for the day has been 102.339 while the low of day has reached to 102.084. The pair earlier today opened the Asian trading session below the daily pivot and has trended sideways so far today with the daily pivot providing overhead resistance.

Daily Pivot Point: 102.325
— S1 – 102.012
— S2 – 101.806
— S3 – 101.493
— R1 – 102.531
— R2 – 102.844
— R3 – 103.050


Weekly Pivot Points: USDJPY

SC USDJPY 2014.03.25

Prices are currently trading over the weekly pivot point (102.06) at time of writing. The USDJPY has been on an overall sideways trend this week after opening the trading week modestly above the weekly pivot.

Weekly Pivot Point: 102.066
— S1 – 101.462
— S2 – 100.661
— S3 – 100.057
— R1 – 102.867
— R2 – 103.471
— R3 – 104.272


By CountingPips.comForex Trading Apps & Currency Trade Tools

Disclaimer: Foreign Currency trading and trading on margin carries a high level of risk and volatility and can result in loss of part or all of your investment. All information and opinions contained do not constitute investment advice and accuracy of prices, charts, calculations cannot be guaranteed.


Wave Analysis 25.03.2014 (DJIA Index, Crude Oil)

Article By RoboForex.com

Analysis for March 25th, 2014

DJIA Index

Index is still being corrected. It looks like wave [2] is taking the form of zigzag pattern. On minor wave level, market completed wave (B). Most likely, in the nearest future market will continue falling inside wave (C) of [2] and break latest minimum.

More detailed wave structure is shown on H1 chart. After finishing zigzag pattern inside wave (B), Index formed initial descending impulse. Probably, right now instrument is extending the third wave. Price may reach new minimum during the day.

Crude Oil

Oil is about to start strong descending movement inside wave 3. Earlier price completed initial impulse inside wave 1 and then formed correction inside the second one. I’ve got only one sell order so far, but I’m planning to increase my short position in the future.

As we can see at the H1 chart, wave 2 took the form of zigzag pattern. On minor wave level, market formed diagonal triangle pattern inside wave [C]of 2. Most likely, instrument will continue falling down inside wave [1].

RoboForex Analytical Department

Article By RoboForex.com

Attention!
Forecasts presented in this section only reflect the author’s private opinion and should not be considered as guidance for trading. RoboForex LP bears no responsibility for trading results based on trading recommendations described in these analytical reviews.


Junior Mining Stocks to Beat Previous Highs

By Laurynas Vegys, Research Analyst, Casey Research

Despite last week’s pullback, the precious metals market is off to an impressive start in 2014. Gold is up 10.6%, silver 4.3%, and the PHLX Gold/Silver (XAU) 17.1%. Gold, in particular, had a great February, rising above $1,300 for the first time since November 7, 2013.

This has led to some very handsome gains in our Casey International Speculator portfolio, with a few of our recommendations already logging triple-digit gains from their recent bottoms.

Why Junior Gold Mining Stocks Are Our Favorite Speculations

One of Doug Casey’s mantras is that one should buy gold for prudence, and gold stocks for profit. These are very different kinds of asset deployment.

In other words, don’t think of gold as an investment, but as wealth protection. It’s the only highly liquid financial asset that is not simultaneously someone else’s obligation; it’s value you can liquidate and use to secure your needs. Possessing it is prudent.

Gold stocks are for speculation because they offer leverage to gold. This is actually true of all mining stocks, but the phenomenon is especially strong in the highly volatile precious metals.

Most typical “be happy you beat inflation” returns simply can’t hold a candle to stocks that achieved 10-bagger status (1,000% gains). In previous bubbles—some even generated 100-fold returns. And we may see such returns again.

It’s Not Too Late to Make a Fortune

Here’s a look at our top three year-to-date gainers.

What’s especially remarkable is that all three of these stocks shot up much more than gold itself, on essentially no company-specific news. This is dramatic proof of just how much leverage the right mining stocks can offer to movements in the underlying commodity—gold, in this case. Two of the stocks above are on our list of potential 10-baggers, by the way.

So have you missed the boat? Is it too late to buy?

Looking at the chart, two bullish factors jump out immediately:

  • Gold stocks have just now started to move up from a similar level in 2008.
  • Gold stocks remain severely undervalued compared to the gold price. A simple reversion to the mean implies a tremendous upside move.

Now consider the following data that point to a positive shift in the gold market.

  1. After 13 consecutive months of decline, GLD holdings were up over 10.5 tonnes last month. The trend is similar to other ETFs.
  1. Hedge funds and other large speculators more than doubled their bets on higher gold prices this year.
  1. Increase in M&A—for example, hostile bids from Osisko and HudBay Minerals to buy big assets.
  1. Apollo, KKR, and other large private equity groups have emerged as a new class of participants in the sector.
  1. Gold companies’ hedging of future production—usually a sign of insecurity among the miners—shrunk to the lowest level in 11 years.
  1. China continues to consume record amounts of gold and officially overtook India as the world’s largest buyer of gold in 2013.
  1. Large players in the gold futures market that were short have switched to being long.
  1. Central banks continue to be net buyers.

To top it off, there’s been no fallout (yet) from the unprecedented currency dilution undertaken since 2008—and we don’t believe in free lunches.

The gold mania train has not yet left the station, but the engine is running and the conductor has the whistle in his mouth. This means…

Any correction ahead is a potential last-chance buying opportunity before the final mania phase of this bull cycle takes our stock to new highs, well above previous interim peaks.

In spite of the good start to 2014, most of our 10-bagger gold stocks are still on the deep-discount rack. And you can get all of them with a risk-free, 3-month trial subscription to our monthly advisory focused on junior mining stocks, the Casey International Speculator.

If you sign up today, you can still get instant access to two special reports detailing which stocks are most likely to gain big this year: Louis James’ 10-Bagger List for 2014 and 7 Must-Own Stocks for 2014.

Test-drive the International Speculator for 3 months with a full money-back guarantee, and if it’s not everything you expected, just cancel for a prompt, courteous refund of every penny you paid. Click here to get started now.

I hope you will take advantage of this opportunity in front of us—while shares are still relatively cheap.


The article Junior Mining Stocks to Beat Previous Highs was originally published at caseyresearch.com.

Japanese Candlesticks Analysis 25.03.2014 (EUR/USD, USD/JPY)

Article By RoboForex.com

Analysis for March 25th, 2014

EUR USD, “Euro vs US Dollar”

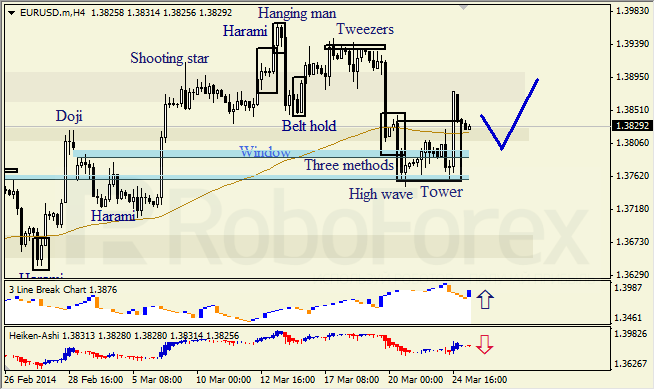
H4 chart of EUR USD shows ascending movement, which is indicated by Tower pattern. Lower Window is support level. Three Line Break chart confirms ascending movement; Heiken Ashi candlesticks indicate bearish pullback.

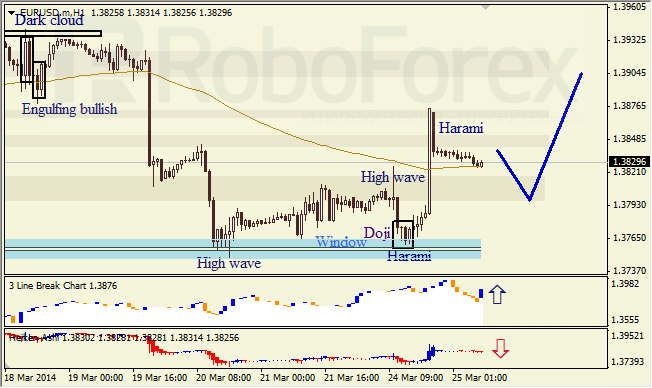
H1 chart of EUR USD shows ascending trend, which started after High Wave and Harami patterns and support from closest Window. Three Line Break chart indicates ascending trend; bearish Harami pattern and Heiken Ashi candlesticks indicate descending movement.

USD JPY, “US Dollar vs Japanese Yen”

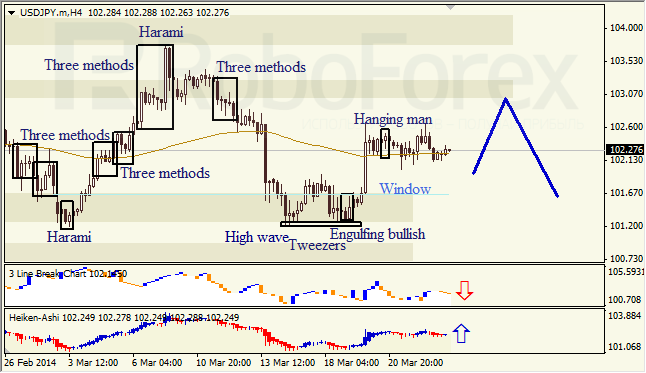
H4 chart of USD JPY shows sideways correction, which is indicated by Hanging Man pattern. Three Line Break chart indicates correction; Heiken Ashi candlesticks confirm that bullish tendency continues.

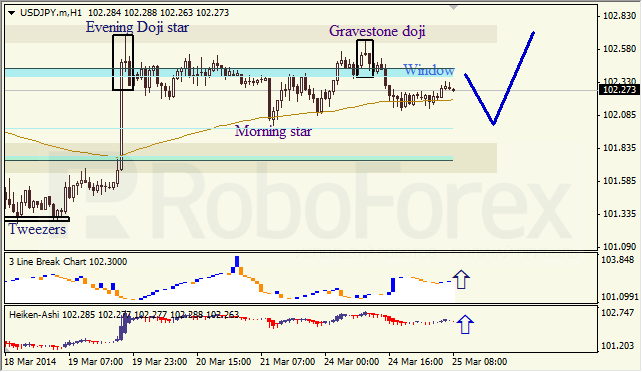
H1 chart of USD JPY shows sideways correction within ascending trend near upper Window, which is indicated by Evening Doji Star and Gravestone Doji patterns. Three Line Break chart and Heiken Ashi candlesticks confirm ascending trend.

RoboForex Analytical Department

Article By RoboForex.com

Attention!
Forecasts presented in this section only reflect the author’s private opinion and should not be considered as guidance for trading. RoboForex LP bears no responsibility for trading results based on trading recommendations described in these analytical reviews.


EUR/USD Price Action For March 25

Article by Investazor.com

Euro had a 90 pips rally yesterday. The EURUSD price went all the way to 1.3875, but pulled back and consolidated near 1.3830. A break above 1.3840 and the 200 EMA, for the 60 minutes chart, could mean another rally to retest 1.3875, 1.3880 or why not 1.3900. Keep your eyes open for a break under 1.3920, because that would be a negative signal. In this case the price could fall back to the 1.3760 support level.

The post EUR/USD Price Action For March 25 appeared first on investazor.com.

Texas Oil Spill Drives Prices Up

By HY Markets Forex Blog

The price of oil is strongly tied to supply, which means whenever an event happens that hampers the availability of this natural resource, costs may go up. The spill that occurred in Texas over the weekend is something investors who participate in crude oil trading should keep a close eye on.

This incident caused marine traffic to shut down on the 52-mile corridor in Texas, which blocked the access of eight refineries to their supply of crude oil, according to Forbes. The period of time this area is closed down due to the spill is valuable information to traders, as the longer refineries don’t have access to their supply, the higher the price of oil could rise.

“The closure could persist all week, so it may prove to supportive for prices, as crude oil deliveries will be hampered,” Michael Fitzpatrick, editor of The Kilduff Report, told USA Today. “Some 10 percent of the nation’s refining capacity if located at the channel.”

The biggest concern surrounding the spill is that it cut off Exxon from it’s refinery in Baytown and Marathon Petroleum from it’s refinery in Texas City, which are two of the biggest in the country. Crude oil traders would be wise to keep a close eye on this news story, because any extended closing of these refineries could have a major impact on supply. As a result, the price of crude oil could be volatile in the coming weeks, which is valuable information to any trader.

The post Texas Oil Spill Drives Prices Up appeared first on | HY Markets Official blog.

Article provided by HY Markets Forex Blog

EURUSD broke above 1.3845 resistance

EURUSD broke above 1.3845 resistance, indicating that the downtrend from 1.3966 had completed at 1.3749 already. Further rise to test 1.3966 resistance could be expected, a break above this level will signal resumption of the uptrend from 1.3477 (Feb 3 low), then the following upward movement could bring price to 1.4500 area. Support levels are at 1.3805 and 1.3749, only break below these levels could trigger another fall towards 1.3550.

eurusd

Provided by ForexCycle.com