WTI Crude Trades Higher as Market Awaits Further Reports

By HY Markets Forex Blog

Crude prices were seen trading slightly higher on the first day of the trading week as the West Texas Intermediate (WTI) climbed slightly higher for the first time in three days. The demand for heating oil in the US strengthened, while downbeat reports from the US such as retails sales and industrial production data weighed on oil prices.

WTI for April delivery climbed 0.35% higher, trading at $100.48 per barrel on the New York Mercantile Exchange at the time of writing; prices for the crude have risen by 2.3% this year.

Brent for April settlement climbed 0.03% higher at $109.12 per barrel on the London-based ICE Futures Europe exchange at the same time. The European benchmark Brent crude was at premium of $8.76 to WTI for the same month.

According to data released by the Cabinet office, Japan’s economy grew at a slower pace, expanding by a seasonally adjusted 0.3% and on an annualized rate , gross domestic product (GDP) eased to 1.0%. The private non-residential investment grew to 1.3% from 0.2% recorded in the previous quarter, while the public investment lowered from 7.2% to 2.3%.

A separate report revealed that industrial production in Japan climbed 0.9% in December last year, compared to 1.1% recorded in the previous month, the Ministry of Economy, Trade and Industry (METI) confirmed on Monday.

METI also confirmed that shipments increased 0.8% in December, while inventories dropped 0.5% over the month.

Crude – Expected Reports

On Monday, the New York Stock exchange will be closed for the President Day holiday.

Market participants will be expecting housing and inflation reports as well as minutes from the Federal Open Market Committee’s (FOMC) meeting.

The US Federal Reserve released the factory output report on Friday, which revealed a 0.3% contraction, compared to analysts forecast of a 0.2% growth.

Crude – US Downbeat Reports

The US retail sales dropped lower than expected in January, declining 0.4% lower in January, compared to the revised reading of a 0.1% decrease in December and the sharpest drop since June 2012.

Meanwhile, the initial US jobless claims for the week ending February 8 climbed to 339,000, compared to the previous reading of 331,000 seen in the previous month, according to reports from the Labour Department.


Visit www.hymarkets.com   to find out more about our products and start trading today with only $50 using the latest trading technology today.

The post WTI Crude Trades Higher as Market Awaits Further Reports appeared first on | HY Markets Official blog.

Article provided by HY Markets Forex Blog
Windsor Brokers Ltd. meets the first EMIR reporting deadline.

For Immediate Release

Limassol, Cyprus, February 14th, 2014:  Windsor Brokers Ltd. announced that it has met its first reporting obligations under the European Market Infrastructure Regulation (EMIR) which entered into effect on the 12th of February 2014.

The new regulation requires all counterparties to report previous day transactions with regards to financial derivatives including but not limited to Spot FX, CFDs, Futures, Equities, Indices and Binary Options.

All counterparties must therefore report all derivative transactions that fall under the EU jurisdiction.   Reporting is made to Trade Repositories (TR), which are entities that are licensed and regulated by ESMA – the European Securities and Markets Authority.  The main objectives of ESMA are to protect investors and to supervise the practices of financial services firms with pan-European reach.

Transactions can be reported directly to the TR or via a third party (partial or full delegation), depending on the internal processes incorporated by each entity and whether they have the necessary reporting expertise and procedures.

It is important to note that whether reporting is performed directly or via a third party, liability for reporting lies on each entity which is subject to the reporting requirements of EMIR.

“We have decided to handle our own reporting obligations, directly to the TR.  We have our internal reporting system, the technological infrastructure and a dedicated and proficient team in several departments.   For these reasons, we were confident that we were able to fulfill the reporting obligation as of day one”, said Mr. Walid Assaf, Windsor’s Project Leader for EMIR reporting.

Although many firms will face challenges with regards to reporting processes, EMIR is expected to bring more transparency and raise the reporting standards of the financial services industry.

About Windsor Brokers Ltd.

Windsor Brokers Ltd. was the first CIF to be licensed and regulated by the Cyprus Securities and Exchange Commission.  Throughout the years, the company has been nominated and has received several awards for its innovative products, services, partnership programs and customer support and was ranked one of the top ten Cypriot investment firms based on capital reserves in 2013.

Windsor employs over 120 people in Cyprus and abroad and is a leading provider of financial services, catering to both retail and corporate clients from over 80 countries worldwide.

More information on www.windsorbrokers.com


“Mistaken Identity” Sends Wrong Stock Blasting 4,900 Percent Higher

By WallStreetDaily.com "Mistaken Identity" Sends Wrong Stock Blasting 4,900 Percent Higher

Google recently announced that it was buying Nest Labs for $3.2 billion.

On the day after the announcement hit, investors accidently triggered a historic stock move.

It’s a phenomenon called a “flash rally,” which is the exact opposite of a “flash crash.”

Why haven’t you heard about flash rallies?

It’s simple, really.

The press favors negative storylines, especially ones where people lose gobs of money.

Such gut-wrenching stories tug at readers’ heartstrings, and garner lots of attention.

During flash rallies, though, investors make gobs of money, which means these stories go virtually unreported.

Nonetheless, flash rallies are happening with increased regularity.

Any stock that doubles in price (or greater) in a single day is said to have experienced a flash rally.

Flash rallies happen, on average, 41 times every day.

Which 41 stocks are ready to double in price tomorrow? Full details.

The “accident” heard round the world…

It doesn’t take much to trigger a flash rally of biblical proportions.

Flash rallies are hypersensitive to news.

Take Google’s plans to buy Nest Labs, for example.

The day after the news hit, a certain company’s stock “accidently” blasted 4,900% higher.

It wasn’t Google’s stock that rocketed higher.

It wasn’t Nest Labs’ stock, either. (Nest Labs isn’t even a publicly traded company.)

However, if you were a shareholder of the stock that did accidently blast 4,900% higher, a modest $1,000 investment could’ve suddenly turned into $50,000, overnight.

Flash rallies (of all magnitudes) are happening to the tune of 41 every day.

To appreciate how hypersensitive flash rallies are to news, let’s examine the fallout from Google’s offer to buy Nest Labs, which sent a totally unrelated company’s stock shooting to the moon.

The next flash rally will commence tomorrow morning at 9:30 AM EST. For details on which stocks are set to be impacted, click here.

A $3.2-billion case of mistaken identity…

Nest Labs was founded in 2010 by the former Senior Vice President of Apple’s iPod Division, Tony Fadell.

Fadell worked alongside Steve Jobs on the first-generation iPod.

He left Apple to financially leverage the massive cloud computing revolution, which paid off in spades the moment Google’s offer hit.

Nest Labs manufactures beautifully designed thermostats and smoke detectors that can be controlled with a smartphone from anywhere.

The Federal Trade Commission has since rubberstamped the deal, and now Nest Labs’ shareholders are set to receive $3.2 billion in cash from Google.

In a case of mistaken identity, though, many investors rushed to buy shares of the wrong company.

The unsuspecting beneficiary, Nestor Inc., enjoyed a 4,900% increase after investors confused it with Nest Labs.

Nestor isn’t even a cloud computing company. Rather, it sells automated traffic enforcement systems to governments, yet happens to have the ticker symbol NEST, hence the accidental stampede to buy shares.

 Movie1

Wall Street loves to restrict access to flash rallies. The less you know, the bigger the profits are for them. To learn how to lift your restrictions to tomorrow’s 41 flash rallies, click here.

Virtually anything can trigger a flash rally…

Last year, a company called Tweeter Home Entertainment enjoyed a 685% price spike on news of Twitter’s IPO plans.

The frenzied buying made no sense considering that Twitter hadn’t even offered shares yet.

Still, investors “accidently” rushed to buy shares of TWTRQ, thinking they were buying Twitter.

Although confusion over ticker symbols can cause massive flash rallies, it’s actually one of the least likely triggers.

Among the 41 stocks, on average, that double in price every day, more traditional news usually serves as the spark.

Insider buying can spark a flash rally.

A licensing deal can spark a flash rally.

Patent approval can spark a flash rally.

Successful product testing can spark a flash rally.

Flash rallies happen to the tune of 41 opportunities every day.

Yet not a single media outlet is likely to report news concerning any of them.

What the experts are saying: Wall Street Daily’s exclusive research into flash rallies is the only known foray into this phenomenon. The study’s results are eye-opening, especially concerning a proprietary algorithm that can identify which 41 stocks are ready to be among tomorrow’s price doubles. Click here to view it now.

Movie2

Ahead of the tape,

Louis Basenese

The post “Mistaken Identity” Sends Wrong Stock Blasting 4,900 Percent Higher appeared first on Wall Street Daily.

Article By WallStreetDaily.com

Original Article: “Mistaken Identity” Sends Wrong Stock Blasting 4,900 Percent Higher

Japanese Candlesticks Analysis 17.02.2014 (EUR/USD, USD/JPY)

Article By RoboForex.com

Analysis for February 17th, 2014

EUR USD, “Euro vs US Dollar”

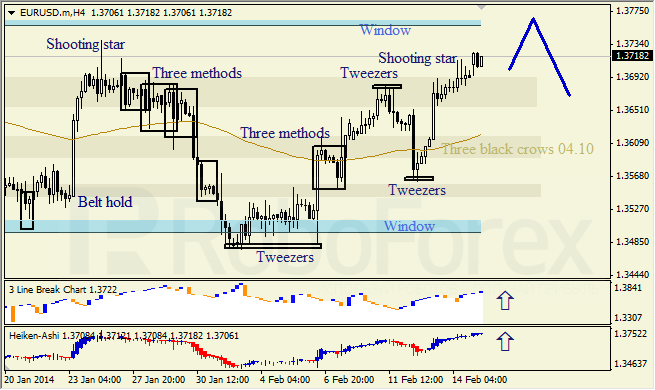
H4 chart of EUR USD shows bullish tendency. Upper Window is resistance level. Three Line Break chart and Heiken Ashi candlesticks confirm ascending movement.

H1 chart of EUR USD shows bullish tendency. Closest Window is broken, now it’s support level. Three Line Break chart and Heiken Ashi candlesticks confirm ascending movement.

USD JPY, “US Dollar vs Japanese Yen”

H4 chart of USD JPY shows bearish tendency within descending trend. Lower Window is broken, now it’s resistance level. Three Line Break chart and Heiken Ashi candlesticks confirm descending movement.

H1 chart of USD JPY shows correction within descending trend. Three Line Break chart and Heiken Ashi candlesticks confirm descending movement.

RoboForex Analytical Department

Article By RoboForex.com

Attention!
Forecasts presented in this section only reflect the author’s private opinion and should not be considered as guidance for trading. RoboForex LP bears no responsibility for trading results based on trading recommendations described in these analytical reviews.


Gold Prices Surge to 3-Month High

By HY Markets Forex Blog

Those who trade gold caused the precious metal to rise to its highest level in three months on Feb. 12, bolstered by hopes that the Federal Reserve will reduce its current regimen of bond purchases gradually.

April gold rose to as much as $1,296.40 per ounce on the Comex division of the New York Mercantile Exchange, according to Bloomberg. This represented the highest value for the futures contract since Nov. 8. April gold later pared these gains slightly, settling at $1,295 an ounce at 2:12 p.m.

Spot gold also appreciated, rising to $1,294.75 per ounce, Kitco News reported. This price was reached as a result of the contract increasing by $3.30 an ounce during the session.

Yellen testimony key to gold appreciation

These gains happened the day after Janet Yellen, who recently took over as the chair of the Federal Reserve, told Congress in testimony that she plans to reduce the central bank’s bond purchases in “measured steps,” the media outlet reported.

The Fed has managed to increase its balance sheet to more than $4 trillion over the last several years, and purchased $85 billion worth of debt-based instruments every month between late in 2012 and January of this year.

Fed recently started tapering stimulus

The Federal Open Market Committee announced definitive plans to reduce this stimulus at the conclusion of its December meeting, indicating that, starting in 2014, it would cut these transactions to $75 billion per month. At the end of the policy meeting that the Fed held in January, it was announced that in the following month, this pace would once again be cut to $65 billion.

Gold prices were thought to receive support from the statements that were provided by Yellen in her testimony, according to Kitco News. This gave market participants the impression that, thus far, her policy decisions have mirrored those made by Ben Bernanke, the former chair of the Fed. The inaugural testimony that she gave to Congress has also created quite a stir among market participants such as investors and traders.

“Yellen has indicated the Fed will remain supportive to prop up the labor market,” Scott Gardner, who works for Verdmont Capital SA in Panama City and contributes to the management of $400 million, told Bloomberg. “This is definitely helping gold, and we are seeing both gold and equities rally on that.”

Gold starts 2014 strong

Those who trade gold have caused the precious metal to surge 7.7 percent so far this year, the media outlet reported. Robust physical demand is one factor that contributed significantly to this appreciation.

The strong returns that gold has enjoyed so far in 2014 represent a strong contrast to what the precious metal did last year. In April 2013, the commodity fell into a bear market, having lost more than 20 percent of its value since reaching an all-time high of more than $1,900 per ounce in 2011.

The precious metal then continued this slide, falling to less than $1,200 per ounce in June of last year. As a result, gold dropped to its lowest value in almost three years. The precious metal then experienced some gains in the remaining months of 2013. However, this recovery did not prevent the precious metal from finishing the year down almost 30 percent.

One major factor that was cited as pushing the price of gold lower was global investors losing faith in the metal. However, some market experts have recently provided bullish predictions for the commodity. One of these individuals is Julian Jessop, head of commodities research at Capital Economics, MarketWatch reported.

“The recent partial recovery in the price of gold vindicates the cautiously positive view we have held since the slump in the first half of 2013,” Jessop wrote in a note on Feb. 12, according to the news source. “We continue to expect further gains over the course of the year.”

While he provided his prediction that the price of the precious metal will rise, he said that the chances that the precious metal will once again rise to the level of more than $1,900 per ounce that was reached late in 2011 are rather low, the media outlet reported. The market expert also warned that as the U.S. economic expansion accelerates, gold prices will lose a powerful source of support.

It was noted by another market expert that global market participants have been assessing not only economic growth in the U.S., but also the expansion that happens on a global level, according to Bloomberg.

“People have been reassessing global growth, and this year we have seen some money flow into gold,” Quincy Krosby, who works for Prudential Financial Inc. as a market strategist, told the news source. “It’s too early to say that it’s a turning point.”

In the event that the recent inflows that the precious metal has been enjoying are indicative of a broader trend, it could result in those who trade gold pushing the commodity significantly higher in value.

The post Gold Prices Surge to 3-Month High appeared first on | HY Markets Official blog.

Article provided by HY Markets Forex Blog

Sri Lanka holds rates, sees minimal hit from Fed tapering

By CentralBankNews.info
    Sri Lanka’s central bank maintained its monetary policy stance, as widely expected, and said there had been a net inflow to the country’s bond and stock markets so far this year, confirming that “the effect of the US quantitative easing programme on the Sri Lanka economy is expected to be minimal.”
    The Central Bank of Sri Lanka maintained the 150 basis point spread in its new Standing Rate Corridor (SCR), with the Standing Deposit Facility Rate (SDFR) at 6.50 percent and the Standing Lending Facility Rate (SLFR) at 8.0 percent.
   The central bank restructured its monetary policy framework last month, with SDFR setting a floor in its new corridor and SLFR the ceiling. At that point it narrowed the spread in its corridor to 150 basis points from 200 points due to reduced volatility in the call money market.
   Net inflows to the Sri Lankan bond and stock markets have amounted to US$ 119 million up to Feb. 10 from the start of the year and the central bank said it had absorbed a net $58.7 million, helping the rupee remain stable. Gross official reserves were at comfortable levels,  the central bank said, and the equivalent of 5.3 months of imports.

    This year the rupee has remained stable against the U.S. dollar, trading at 130.8 dollar today, down by 2.4 percent since the end of 2012.
    Sri Lanka’s inflation rate is expected to remain around the current level throughout 2014, supported by well managed demand and conditions and improved domestic supply, the bank said.
    In January headline inflation eased to 4.4 percent from 4.7 percent in December. The average rate in 2013 was 6.9 percent and the central bank targets inflation of 4-6 percent this year, declining to 3-5 percent in 2015 and 2016.
    Market interest rates adjusted downwards following the central bank’s compression of the rate corridor last month and higher levels of liquidity in the domestic money market due to proceeds from the country’s sovereign bond in January.
    Growth of credit to the private sector by commercial banks accelerated marginally to 7.5 percent in December from 7.3 percent and is expected to grow by some 16 percent this year.
    Referring to the government’s “mega infrastructure drive,” that is increasing the economy’s capacity, the central bank said its board was of the view that it would be “appropriate to further encourage the utilization of this investment potential, since such policies by the government would give rise to increased and accelerated sustainable economic growth in the period ahead.”
    Sri Lanka’s Gross Domestic Product expanded by an annual 7.8 percent in the third quarter, up from a rate of 6.8 percent in the second quarter, the third quarter of accelerating growth. The central bank has estimated that the economy grew by 7.2 percent last year and should grow by 7.8 percent this year.
    Last month Ajith Nivard Cabraal, governor of the central bank, said in an interview with Bloomberg that interest rates were at an appropriate level and the central bank would probably keep rates steady for the next three to six months under current conditions.
    Sri Lanka raised US$ 1 billion in last month’s sovereign bond issue to help finance its investment program, with the bond priced around 6 percent. U.S. investors purchased more than 60 percent of the bond, a central bank official said.
   
    http://ift.tt/1iP0FNb


USDJPY failed to break above channel resistance

USDJPY failed to break above the upper line of the price channel on 4-hour chart. Now the fall from 102.70 would possibly be resumption of the downtrend from 105.44. Deeper decline to test 100.75 support would likely be seen, a breakdown below this level will trigger another fall towards 95.00. Key resistance is now at 102.70, only break above this level could signal completion of the downtrend.

usdjpy

Daily Forex Analysis

The Eurozone Will be Forced to Print Money — and You Can Profit from It

By MoneyMorning.com.au

With deflation threatening the eurozone, investors had expected European Central Bank boss Mario Draghi to at least discuss the need to do something when he gave a press conference recently. If nothing else, talking down the euro might help buoy the weaker eurozone economies.

But instead he actively downplayed the risk of falling prices. As a result, the euro shot higher.

Meanwhile, Germany’s highest court decided that the ECB’s big proposed bailout scheme – the fabled ‘OMT’ – exceeded its powers. This could kick the OMT into the long grass for at least two years as it bounces between Germany and the European courts.

It looks like Berlin and Brussels plan to have their cake and eat it. The threat of money printing stops investors from driving up borrowing costs for troubled nations. But they never actually follow through, which keeps the Germans happy.

Can they pull this big con game off? Is it time to buy the euro?

I suspect not. But you can profit either way…

Brussels Can be Creative and Flexible When it Has to

OMT stands for Outright Monetary Transactions. This scheme would allow the ECB to buy the bonds of troubled eurozone countries directly, driving down their borrowing costs. The mere threat of OMT stopped the exodus from eurozone bonds dead in its tracks in 2012, with Draghi’s ‘whatever it takes‘ speech.

But the OMT has never been activated. That’s partly because it’s never actually been approved.

The idea of the European Central Bank buying bonds is not popular with many Germans. They see it as a backdoor bailout. Why would the Greeks ever restructure their economy if they can get free money from the ECB? The Germans also worry that ECB money printing could lead to inflation.

So Germany challenged the OMT on the grounds that it exceeds the ECB’s power. And last week, Germany’s Constitutional Court voted to refer the matter to the European Court of Justice.

Some people think this really makes things tricky for the ECB if it wants to start printing. But I’m not so sure.

We now have a situation where a Brussels-based court is going to decide whether the ECB – also in Brussels – has too much power. Call me cynical, but it rather looks as though the German Constitutional Court wants to appear tough (to appease the Germans), while tacitly approving the OMT.

Even the risk of delay might be overstated. Brussels likes to insist that eurozone countries implement European Union law to the letter. But as we all know, it is prepared to be ‘flexible’ and ‘creative’ when it suits, as shown by the fact that auditors have repeatedly found significant material errors in the EU’s accounts. So expect them to devise a way around this if push comes to shove.

Will the ECB be forced to print?

So the question isn’t: will the Germans allow the ECB to print? It’s more: will circumstances force the ECB to act?

I think the answer is yes.

Eurozone banks are still unwilling to lend (because they’re still in a huge mess). That means – as has happened in the UK and the US – that the only institution that can provide the economy with the money it needs to grow is the ECB.

But with the ECB currently sitting on its hands, monetary growth is very weak. Capital Economics notes that M3, the best measure of money supply, is only growing by 1% a year, and falling.

As a result, Capital Economics thinks the eurozone economy will barely grow at all this year. And some of the most debt-ridden countries – such as Italy – will stay in recession.

That won’t help reduce Europe’s massive unemployment. And it means countries will also miss their debt reduction targets, which may mean more austerity.

So the eurozone faces ongoing economic pain, meaning miserable, discontented voters. And there’s one man who could use this discontent to bring things to a head: Silvio Berlusconi.

Last year was a disaster for Italy’s former prime minister. He was sentenced to home imprisonment (for tax fraud) and expelled from the Senate. An attempt to bring down the government backfired when key members of his coalition failed to back him.

However, the economic pain has helped him to launch yet another comeback, reviving Forza Italia. Unsurprisingly, he has put anti-German sentiment at the heart of his relaunch.

Several former allies have re-joined his coalition, eroding the power of the current government. If you take these smaller parties into account, his coalition leads the polls with 38%.

This matters. Changes to electoral law in Italy give a big seat bonus to the largest coalition group in an election, as long as it gets over 37% of the vote.

So if an election were held today in Italy, Berlusconi could well become prime minister. Again.

Of course, there is the small matter of his ban from public office. But he is challenging this in the courts. And even if he is barred, he can delegate the leadership to a figurehead – possibly his daughter – and run things from the sidelines.

Sell the Euro, Buy Shares

This leaves the ECB, Brussels and Berlin with the same sticky problem they’ve always had.

They can squeeze the troubled nations, particularly Italy and Greece – as long as they offset the pain with a weak euro and loose monetary policy.

Or they can keep monetary policy tight and the euro strong – as long as German taxpayers are willing to pay to alleviate some of the pain in their southern partners.

But if they want to keep the euro, they can’t have both. One way or another, the struggling countries need some sort of help or debt relief. Or eventually a populist politician will lead them to the logical conclusion – ditch the euro.

The exit of Greece or Italy can’t be ruled out completely. But it seems far more likely that when push comes to shove, money printing by the ECB will be a more palatable solution.

That would send the euro much lower from here. You can bet against the single currency by spread betting or via an exchange-traded fund. But I think there’s a better way. We already know that money-printing sends stocks higher (just see Japan, Britain and the US). And we know that stocks in the most troubled countries remain cheap, despite rallying sharply over the past 18 months or so.

Matthew Partridge,
Contributing Editor, Money Morning

Join Money Morning on Google+


By MoneyMorning.com.au

What it Means for the Market When Debt Increases…

By MoneyMorning.com.au

So there you have it.

After a rotten start to the year, the markets are pretty much back to square one.

In fact, based on Friday’s close, the Aussie market is up four points for the year…or 0.08%.

It’s not much. But considering where the market was just two weeks ago, we’ll take it.

The last two weeks should have taught you a valuable lesson – there’s nothing to gain from panicking, and everything to lose. Those who sold their stocks fearing a crash have missed out on making back their money as the market has rallied 5% in less than two weeks.

But barely a day goes past without another faux potential disaster hitting the headlines. More often than not it’s China…

According to the Financial Times:

The boom in lending augurs well for the Chinese economy in the coming months, allaying fears that higher market interest rates will starve companies of financing and weigh on growth.

But it also adds to concerns that China has become increasingly reliant on debt and that the government is struggling to wean banks and companies off that dependence.

We’ll make one tiny but hugely relevant point about that. Perhaps the FT would like to show us an economy that isn’treliant on debt‘.

We’re not sure such an economy exists. All developed and sophisticated economies rely on debt to some degree. If it weren’t for debt, arguably it would be much harder for any economy to grow.

That doesn’t mean we’re in favour of individuals or businesses leveraging up to the eyeballs. But by the same token it’s silly to think that all debt is bad.

Here’s why…

No Savings Without Debt in This World

The one thing easily forgotten by those who rail against debt is that on the other side of the ledger to debt is savings.

(We won’t get into the argument about whether savings create debt or debt creates savings; that’s not important.)

A saver is someone who doesn’t have an immediate use for their money. So, they choose to save until they may need it in the future. One incentive for them to save for the future is that they’ll need a source of income after they’ve stopped working.

Another incentive is that someone will pay them (interest) if they forgo spending today, and save the money instead.

The person prepared to pay for the use of these savings (via a bank) is the borrower. The bank pools the savings and lends it out to a borrower. (Again, we’re not getting into the complexities of banking, we know how it works. We’re keeping this nice and simple to illustrate a point.)

The saver hopes that the bank lends responsibly so that they’ll earn interest and of course, get their principle back too.

That was one of the key problems with the subprime mortgage mess. The investment banks were so obsessed with issuing loans and selling them as investments to earn big fees that they stopped lending responsibly.

That was the problem. It wasn’t debt per se. It was the quality of the debt.

Rising debt and rising stocks go hand in hand

That’s the issue facing China today. There’s a lot of talk about the stability and fragility of China’s banking system.

But that’s not unique to China. The nature of a paper-based money system with no backing except the word of the government and central bank will always face problems.

However, that doesn’t mean an economy has to collapse today. For a start, let’s look at China’s debt to GDP ratio. Based on the last published figures from 2012, China’s gross public debt to GDP was 22.8%. That’s according to the International Monetary Fund (IMF).

To give you a comparison, Australia’s gross debt to GDP was 27.2%, and the US gross debt to GDP was 106.5%.

So, what should we make of that? Well, consider the following chart of US total public debt going back to 1965:


Source: Federal Reserve Bank of St Louis
Click to enlarge

What do you notice?

That’s right, US debt to GDP was at 30% in 1980. This increased every year until 1995, when it peaked at 65%. This was also the same period as the US Savings and Loan Crisis, when 23% of US Savings and Loan institutions (the equivalent of building societies) went bust.

But what also happened at this time? You got it…the Dow Jones Industrial Average gained 359.9%. That’s even taking into account the 1987 stock market crash.

The Biggest Growth Opportunity in 40 Years

Now, we’ve warned in the past about the tendency of investors and investment pros to take a historical event, apply it to today and assume the same thing will happen.

There’s no guarantee that China’s economy will continue to grow just because US markets soared even as government debt soared, and even as a full-blown ‘banking’ crisis played out in the 1980s and 1990s.

Although it’s worth noting that as government debt took off again in 2009, during another full-blown banking crisis, the US market gained 128.7%. And from 1980 through to today the US market has gained 1,825%.

Before long we’ll have to throw away that hackneyed old saying about markets not liking uncertainty. It seems that sometimes markets love uncertainty.

In short, while those in the mainstream worry about China’s rising and potentially dangerous debt levels, we suggest you look at it a different way – as an opportunity. An opportunity to profit from a rapidly growing economy, which in the years ahead is set to become bigger than the US economy. (We’ll have more on what that means for the Aussie market later this week.)

As an investor, given China’s proximity to Australia and ongoing demand for resources, that puts you in the box seat to benefit.

Playing the China growth game isn’t without risks, but as far as we see it, the biggest risk is not taking part in it. Because if you stay on the sidelines you’re potentially missing out on the biggest growth opportunity the world economy has seen in the last 40 years.

Cheers,
Kris+

Special Report: The Last Time This Stock Bottomed Out…

Join Money Morning on Google+


By MoneyMorning.com.au

Monetary Policy Week in Review – Feb 10-14, 2014: Guidance evolves as Armenia cuts, Georgia raises rates

By CentralBankNews.info
    The evolution of forward guidance was the main focus of global monetary policy last week as only two central banks changed their policy rates: Armenia, which cut its rate, and Georgia, which raised its rate.
    Eight other central banks (Iceland, Mozambique, Indonesia, Sweden, Serbia, South Korea, Peru and Russia) maintained their rates so the Global Monetary Policy Rate (GMPR) – the average rate by the 90 central banks followed by Central Bank News – remained at 5.58 percent, up from 5.41 percent at the end of December.
    Last week’s policy decisions came against a backdrop of improving sentiment in global financial markets, with Janet Yellen, the new chair of the U.S. Federal Reserve, and Sweden’s central bank essentially declaring that January’s volatility – which triggered concern that contagion would engulf emerging markets and drag down advanced economies – will have limited impact on the global economic recovery.
    In her first public appearance since taking over from Ben Bernanke at the start of this month, Yellen said the recent volatility in global financial markets did “not pose a substantial risk to the U.S. economic outlook,” while Sweden’s Riksbank said the “recent financial market turbulence has had limited contagion effects and is not expected to prevent a recovery in the global economy.”
    Although it’s too early to conclude that the prospects for 2014 are bright and rosy, both South Korea and Indonesia’s central banks were cautiously optimistic about the outlook despite the obvious risk that the Fed’s continued reduction in asset purchases will trigger further volatility as financial markets adjust to reduced global liquidity.
    The forward guidance used by both the Fed and the Bank of England (BOE) to keep long-term interest rates low was the subject of much public debate last week, with some commentators criticizing the central banks for moving the goal posts, almost irritated that the two central banks were not planning to tighten monetary policy.
    Both the Fed and BOE had set out certain unemployment rates as thresholds for reconsidering their policy stance and in both cases reality has now caught up with these thresholds.
    Looking back, it was obvious that monetary policy decisions could not be put on auto pilot and in retrospect the Fed and BOE may have gone too far in their attempts to make complex and far-reaching decisions transparent and easy to grasp.

    Through the first seven weeks of this year, six central banks have raised rates, or 9.3 percent of this year’s 64 policy decisions, marginally down from the previous week’s 9.4 percent. Seven central banks have cut rates, or 10.9 percent of this year’s policy decisions, down from 11.3 percent the previous week.
   Four of the six rate rises have come from the large emerging market central banks (Brazil, Turkey, India and South Africa) along with rate rises by Georgia and Ghana.
    The seven rate cuts have mainly come from central banks in frontier markets (two cuts by Romania and one by Jordan) and central banks in other markets (Armenia, Tajikistan and Uzbekistan) and just one by a central bank in an emerging market, namely Hungary.
  
LIST OF LAST WEEK’S CENTRAL BANK DECISIONS:

TABLE WITH LAST WEEK’S MONETARY POLICY DECISIONS:

COUNTRYMSCI     NEW RATE           OLD RATE        1 YEAR AGO
ARMENIA7.50%7.75%8.00%
ICELAND6.00%6.00%6.00%
GEORGIA4.00%3.75%4.75%
MOZAMBIQUE8.25%8.25%9.50%
INDONESIAEM7.50%7.50%5.75%
SWEDENDM0.75%0.75%1.00%
SERBIA FM9.50%9.50%11.75%
KOREAEM2.50%2.50%2.75%
PERUEM4.00%4.00%4.25%
RUSSIAEM5.50%5.50%8.25%
    This week (Week 8) seven central banks will be deciding on monetary policy, including Sri Lanka, Japan, Namibia, Turkey, Chile, Hungary and Ghana.

    In addition, central bank governors and finance ministers from the Group of 20 leading economic nations will meet in Sydney next weekend, Feb. 22 and 23. Australia is this year’s G20 president and host, culminating in a summit of G20 political leaders on Nov. 15 and 16 in Brisbane.

COUNTRYMSCI             DATE CURRENT  RATE        1 YEAR AGO
SRI LANKAFM17-Feb6.50%7.50%
JAPANDM 18-Feb                 N/A0.10%
NAMIBIA18-Feb5.50%5.50%
TURKEYEM18-Feb10.00%5.50%
CHILEEM18-Feb4.50%5.00%
HUNGARYEM18-Feb2.85%5.25%
GHANA19-Feb18.00%15.00%