Thoughts from the Frontline: Forecast 2014 The Human Transformation Revolution

By John Mauldin – Thoughts from the Frontline: Forecast 2014 The Human Transformation Revolution

It is that time of the year when we peer into our darkened crystal balls in hopes of seeing portents of the future in the shadowy mists. This year I see three distinct wisps of vapor coalescing in the coming years. Each deserves its own treatment, so this year the annual forecast issue will in fact be three separate weekly pieces.

The final letter of the series will discuss what I see as potentially developing in the markets this year, but such prognostication has to be framed within the context of two larger and far more important streams. Next week we will examine the larger economic problems facing much of the developed world, and specifically we’ll consider the Era of Unfulfilled Expectations. What happens when governments and central banks find it impossible to live up to the promises that they have made to their constituencies? Throw in a mix of frustrating demographics and disastrous economic policy choices, and you have a witch’s brew of uncertainties.

Thankfully, an even greater force of progress will ultimately overwhelm the unintended consequences of meddling governments to ultimately deliver a very positive future, even if the the benefits are somewhat unevenly distributed in the shorter term. In this week’s letter we’ll look at the economic effects of the Age of Transformation, countering the arguments that call for a bleak, low-growth future wherein all the marvelous innovations that have occurred in the course of the human experience are behind us. Are we not to see yet again a development with the impact of the steam engine, electrical grid, telecommunications, or combustion engine? I think we will – in fact, fundamental, life-changing innovations are happening all around us today. We are just looking in the wrong places, expecting the future to resemble the past. If the depressing models of zero future growth are right, then our investment choices should be far different than if we have an optimistic view of the human experiment. Yes, we must balance our optimism with an appreciation of the uncertainties that will inevitably result from the antics of overreaching governments and their hubristic economic and monetary policies; but we must first and foremost have our eyes wide open to possibilities for growth.

It might help to think of the process as one of exploration. I imagine a group of intrepid adventurers (I picture in my mind Daniel Boone) topping one mountain pass after another, each time gazing off into the distance … to the next mountain pass. Between them lie beautiful valleys and rivers – as well as parched deserts and dead-end canyons full of potentially hostile natives. So the path is both uncertain and unending, as we head toward some ultimate destination we can barely even speculate about. Such a journey should not be undertaken without a great deal of thought and preparation, and it helps if you can find an experienced guide to assist in the process.

Before we set off on this week’s leg of the journey, since this New Year’s Thoughts from the Frontline is normally the most widely read issue of the year, let me welcome new readers and note that this weekly letter is free, and you can subscribe at http://www.MauldinEconomics.com. And feel free to send this letter on to your friends and associates – I hope it will spark a few interesting conversations.

The End of Growth?

There is a school of thought that sees the first and second industrial revolutions as having been driven by specific innovations that are so unique and so fundamental that they are unlikely to be repeated. Where will we find any future innovation that is likely to have as much impact as the combustion engine or electricity or (pick your favorite)?

This is a widespread school of thought and is nowhere better illustrated than in the work of Dr. Robert Gordon, who is a professor of economics at Northwestern University and a Nobel laureate. I have previously written about his latest work, a paper called “Is US Economic Growth Over?”

Before I audaciously suggest that he and other matriculants in his school of thought confuse the products of industrial revolutions with their causes, and thus despair over the prospects for future growth, let’s examine a little bit of what he actually says. (You can of course read the original paper, linked above.) To do that we can turn to an article by Benjamin Wallace-Wells that I cited in Outside the Box last June. He explains Robert Gordon’s views better than anyone I am aware of.

“[T]he scope of his [Gordon’s] bleakness has given him, over the past year, a newfound public profile,” Wallace-Wells notes. Gordon offers us two key predictions, both discomfiting. The first pertains to the near future, when, he says, our economy will grow at less than half its average rate over the last century because of a whole raft of structural headwinds.

His second prediction is even more unsettling. He thinks the forces that drove the second industrial revolution (beginning in 1870 and originating largely in the US) were so powerful and so unique that they cannot be equaled in the future.

(A corollary view of Gordon’s, mentioned only indirectly in Wallace-Wells’s article, is that computers and the internet and robotics and nanotech and biotech are no great shakes compared to the electric grid and internal combustion engine, as forces for economic change. Which is where he and I part company.)

Gordon thinks, in short, that we do not understood how lucky we have been, nor do we comprehend how desperately difficult our future is going to be. Quoting from Wallace-Wells:

What if everything we’ve come to think of as American is predicated on a freak coincidence of economic history? And what if that coincidence has run its course?

Picture this, arranged along a time line.

For all of measurable human history up until the year 1750, nothing happened that mattered. This isn’t to say history was stagnant, or that life was only grim and blank, but the well-being of average people did not perceptibly improve. All of the wars, literature, love affairs, and religious schisms, the schemes for empire-making and ocean-crossing and simple profit and freedom, the entire human theater of ambition and deceit and redemption took place on a scale too small to register, too minor to much improve the lot of ordinary human beings. In England before the middle of the eighteenth century, where industrialization first began, the pace of progress was so slow that it took 350 years for a family to double its standard of living. In Sweden, during a similar 200-year period, there was essentially no improvement at all. By the middle of the eighteenth century, the state of technology and the luxury and quality of life afforded the average individual were little better than they had been two millennia earlier, in ancient Rome.

Then two things happened that did matter, and they were so grand that they dwarfed everything that had come before and encompassed most everything that has come since: the first industrial revolution, beginning in 1750 or so in the north of England, and the second industrial revolution, beginning around 1870 and created mostly in this country. That the second industrial revolution happened just as the first had begun to dissipate was an incredible stroke of good luck. It meant that during the whole modern era from 1750 onward – which contains, not coincidentally, the full life span of the United States – human well-being accelerated at a rate that could barely have been contemplated before. Instead of permanent stagnation, growth became so rapid and so seemingly automatic that by the fifties and sixties the average American would roughly double his or her parents’ standard of living. In the space of a single generation, for most everybody, life was getting twice as good.

At some point in the late sixties or early seventies, this great acceleration began to taper off. The shift was modest at first, and it was concealed in the hectic up-and-down of yearly data. But if you examine the growth data since the early seventies, and if you are mathematically astute enough to fit a curve to it, you can see a clear trend: The rate at which life is improving here, on the frontier of human well-being, has slowed.

To continue reading this article from Thoughts from the Frontline – a free weekly publication by John Mauldin, renowned financial expert, best-selling author, and Chairman of Mauldin Economics – please click here.

© 2013 Mauldin Economics. All Rights Reserved.
Thoughts from the Frontline is a free weekly economic e-letter by best-selling author and renowned financial expert, John Mauldin. You can learn more and get your free subscription by visiting www.MauldinEconomics.com.

Please write to [email protected] to inform us of any reproductions, including when and where copy will be reproduced. You must keep the letter intact, from introduction to disclaimers. If you would like to quote brief portions only, please reference www.MauldinEconomics.com.

To subscribe to John Mauldin’s e-letter, please click here: www.mauldineconomics.com/subscribe
To change your email address, please click here: http://www.mauldineconomics.com/change-address

Thoughts From the Frontline and MauldinEconomics.com is not an offering for any investment. It represents only the opinions of John Mauldin and those that he interviews. Any views expressed are provided for information purposes only and should not be construed in any way as an offer, an endorsement, or inducement to invest and is not in any way a testimony of, or associated with, Mauldin’s other firms. John Mauldin is the Chairman of Mauldin Economics, LLC. He also is the President and registered representative of Millennium Wave Advisors, LLC (MWA) which is an investment advisory firm registered with multiple states, President and registered representative of Millennium Wave Securities, LLC, (MWS) member FINRA and SIPC, through which securities may be offered. MWS is also a Commodity Pool Operator (CPO) and a Commodity Trading Advisor (CTA) registered with the CFTC, as well as an Introducing Broker (IB) and NFA Member. Millennium Wave Investments is a dba of MWA LLC and MWS LLC. This message may contain information that is confidential or privileged and is intended only for the individual or entity named above and does not constitute an offer for or advice about any alternative investment product. Such advice can only be made when accompanied by a prospectus or similar offering document. Past performance is not indicative of future performance. Please make sure to review important disclosures at the end of each article. Mauldin companies may have a marketing relationship with products and services mentioned in this letter for a fee.

Note: Joining The Mauldin Circle is not an offering for any investment. It represents only the opinions of John Mauldin and Millennium Wave Investments. It is intended solely for investors who have registered with Millennium Wave Investments and its partners at http://www.MauldinCircle.com (formerly AccreditedInvestor.ws) or directly related websites. The Mauldin Circle may send out material that is provided on a confidential basis, and subscribers to the Mauldin Circle are not to send this letter to anyone other than their professional investment counselors. Investors should discuss any investment with their personal investment counsel. John Mauldin is the President of Millennium Wave Advisors, LLC (MWA), which is an investment advisory firm registered with multiple states. John Mauldin is a registered representative of Millennium Wave Securities, LLC, (MWS), an FINRA registered broker-dealer. MWS is also a Commodity Pool Operator (CPO) and a Commodity Trading Advisor (CTA) registered with the CFTC, as well as an Introducing Broker (IB). Millennium Wave Investments is a dba of MWA LLC and MWS LLC. Millennium Wave Investments cooperates in the consulting on and marketing of private and non-private investment offerings with other independent firms such as Altegris Investments; Capital Management Group; Absolute Return Partners, LLP; Fynn Capital; Nicola Wealth Management; and Plexus Asset Management. Investment offerings recommended by Mauldin may pay a portion of their fees to these independent firms, who will share 1/3 of those fees with MWS and thus with Mauldin. Any views expressed herein are provided for information purposes only and should not be construed in any way as an offer, an endorsement, or inducement to invest with any CTA, fund, or program mentioned here or elsewhere. Before seeking any advisor’s services or making an investment in a fund, investors must read and examine thoroughly the respective disclosure document or offering memorandum. Since these firms and Mauldin receive fees from the funds they recommend/market, they only recommend/market products with which they have been able to negotiate fee arrangements.

PAST RESULTS ARE NOT INDICATIVE OF FUTURE RESULTS. THERE IS RISK OF LOSS AS WELL AS THE OPPORTUNITY FOR GAIN WHEN INVESTING IN MANAGED FUNDS. WHEN CONSIDERING ALTERNATIVE INVESTMENTS, INCLUDING HEDGE FUNDS, YOU SHOULD CONSIDER VARIOUS RISKS INCLUDING THE FACT THAT SOME PRODUCTS: OFTEN ENGAGE IN LEVERAGING AND OTHER SPECULATIVE INVESTMENT PRACTICES THAT MAY INCREASE THE RISK OF INVESTMENT LOSS, CAN BE ILLIQUID, ARE NOT REQUIRED TO PROVIDE PERIODIC PRICING OR VALUATION INFORMATION TO INVESTORS, MAY INVOLVE COMPLEX TAX STRUCTURES AND DELAYS IN DISTRIBUTING IMPORTANT TAX INFORMATION, ARE NOT SUBJECT TO THE SAME REGULATORY REQUIREMENTS AS MUTUAL FUNDS, OFTEN CHARGE HIGH FEES, AND IN MANY CASES THE UNDERLYING INVESTMENTS ARE NOT TRANSPARENT AND ARE KNOWN ONLY TO THE INVESTMENT MANAGER. Alternative investment performance can be volatile. An investor could lose all or a substantial amount of his or her investment. Often, alternative investment fund and account managers have total trading authority over their funds or accounts; the use of a single advisor applying generally similar trading programs could mean lack of diversification and, consequently, higher risk. There is often no secondary market for an investor’s interest in alternative investments, and none is expected to develop. You are advised to discuss with your financial advisers your investment options and whether any investment is suitable for your specific needs prior to making any investments.

All material presented herein is believed to be reliable but we cannot attest to its accuracy. Opinions expressed in these reports may change without prior notice. John Mauldin and/or the staffs may or may not have investments in any funds cited above as well as economic interest. John Mauldin can be reached at 800-829-7273.


Update: My 2014 Gold Outlook

By for Daily Gains Letter

Gold OutlookIn 2013, gold prices saw the worst tumble in a few decades. This decline in prices caused many to panic, and the negativity towards the yellow metal increased significantly. As we begin 2014, this sentiment seems to be holding on. It’s not uncommon to hear analysts or investors say how gold bullion isn’t worth holding and that there are better opportunities.

However, I’ve been bullish on gold for some time, and I stand by my bullishness. The main reason for my take on the precious metal comes down to the most basic factors that determine price—supply and demand. I continue to see a declining supply and increasing demand. Keeping all else the same, this is the perfect recipe for higher prices ahead.

On the demand side, we are seeing buying from countries across the globe. This was something that was said to have slowed when the gold bullion prices were going down back in April of 2013 and then again in June of 2013.

Australia’s Perth Mint reported sales of gold bullion coins and bars increased by 41% in 2013 compared to a year ago. The Mint sold 754,635 ounces of gold bullion in 2013 compared to 533,333 ounces in 2012. (Source: Sedgman, P., “Perth Mint Gold Sales Surge 41% in 2013 on Worst Rout Since 1981,” Bloomberg, January 2, 2013.)

At the U.S. Mint, the increase in sales of gold bullion coins has been similar to that of Australia’s. The U.S. Mint, for the entire year of 2013, sold 856,500 ounces of gold bullion in American Eagle coins. This was 13% higher compared to the same period a year ago, when the U.S. Mint sold 753,000 ounces of gold bullion in American Eagle coins. (Source: “Bullion Sales/Mintage Figures,” United States Mint web site, last accessed January 3, 2013.)

When I look at nations like India and China—two of the biggest gold bullion–consuming nations—the demand looks robust, as well. In India, the government and central bank have imposed restrictions on buying; they want to slow the demand for gold bullion, but they are failing. Smuggling has become a new major way of bringing the yellow shiny metal into the country. In China, exact numbers aren’t really available, but just by looking at the imports of gold bullion from Hong Kong, those numbers show that the appetite for the yellow shiny metal in China remains solid.

On the supply side, the conditions are becoming bleak, and the production of gold, according to some indicators, is already declining. Consider the U.S. gold bullion mine production. In the first nine months of 2013, mine production declined by 2.85% compared to the same period a year earlier. Between January and September of 2013, U.S. mines produced 170,000 kilograms (kg) of gold bullion. In the same period of 2012, these mines produced 175,000 kg. (Source: “Mineral Industry Surveys,” December 2013, U.S. Geological Survey web site, last accessed January 6, 2014.)

With all this said, one thing has to be made very clear: the negativity towards gold bullion can continue for some time, and the prices may go down further. Investors looking to buy the metal may want to consider investing in an exchange-traded fund (ETF) like SPDR Gold Shares (NYSEArca/GLD). These investors also have to remember to not over-leverage their portfolio with gold bullion; a limited percentage of the portfolio value placed in gold will do the job. By following this investment strategy, investors will protect their portfolio from massive draw-downs and won’t miss out on their future goals.


Trouble Ahead for Housing in 2014?

By Michael Lombardi, MBA

Will the gains that the U.S. housing market made in 2012 and 2013 continue into 2014? As you’ll read below, the biggest threat to the housing market is moving in the opposite direction—against housing.

Sure, the Case-Shiller S&P Home Price Index, which tracks prices in the U.S. housing market, shows an overall increase of 13.6% in home prices in the first 10 months of 2013 (see the chart below).

            Chart courtesy of http://stockcharts.com/


But for growth in the housing market to continue, you need favorable market conditions for buyers. Unfortunately, the “favorable” conditions of 2011 through to 2013 are now becoming “unfavorable.”

Interest rates on mortgages are rising sharply. In November of 2013, the popular 30-year fixed mortgage rate tracked by Freddie Mac stood at 4.26%. In the same period a year ago, this rate was only 3.35%. (Source; Freddie Mac web site, last accessed January 3, 2013.) The interest rate on the standard 30-year fixed mortgage has gone up 27% in twelve months. And the higher mortgage rates go, the more the affordability for home buyers declines.

But rising interest rates are not the only factor weighing against the housing market in 2014.

Adjustable-rate mortgages (ARMs), which virtually disappeared after 2007, are making a big comeback.

According to DataQuick, in November of 2013, about 11% of all homes in Southern California were bought using ARMs. This has doubled in the area from the same period a year ago. (Source: Los Angeles Times, January 1, 2013.) ARMs have a fixed interest rate for a certain period of time, and then rates on the typical ARM adjust to market rates. What will happen to all those home buyers who purchased houses using ARMs over the past three years as interest rates increase? They will have added monthly costs—that’s what will happen.

Any softness for the U.S. housing market at this point will spell disaster for an already delicate U.S. economy. I’d be weary of the housing market recovery in 2014.

This article Trouble Ahead for Housing in 2014? was originally published at Profit Confidential


This Cheap Sector Set to Outperform in 2014

By for Daily Gains Letter

Outperform in 2014With the new year just beginning, many investors will begin looking at their portfolio and trying to figure out how to shift their investment strategy to include sectors that should outperform in 2014.

One investment strategy I like to use during the beginning of the year is to look for a situation where fundamentals are improving, but market sentiment remains weak.

At year-end, many times you will see tax loss selling occurring. Essentially, investors are selling those holdings that have gone down the most to crystallize the losses for tax purposes. This also presents an opportunity—if the long-term investment strategy is sound.

One sector that has been hit hard is the precious metals sector. This should be no surprise to many readers, as the sell-off in precious metals has gotten a lot of negative media attention. However, I would like to bring to your attention an investment strategy of looking to add industrial precious metals, such as platinum and palladium, to your portfolio.

The vast majority of demand for both platinum and palladium is for industrial purposes, especially for catalytic converters in the automobile industry. These precious metals are crucial for the production of vehicles, and demand in this sector continues to rise.

While total vehicle sales for the full year of 2013 aren’t in yet, it is expected that U.S. auto sales will be the highest in six years, with an approximately 50% jump from the lows experienced in 2009. In 2014, U.S. auto sales will continue to be strong, with an estimated total number of over 16 million units sold.

The investment strategy in these industrial metals is to determine whether or not demand is fundamentally increasing or decreasing. Both here in America and globally, it’s quite clear that industrial use will continue to rise.

The price of palladium has remained near its highs for the year, but platinum followed other precious metals lower in 2013. Part of the selling pressure earlier in the year was due to exchange-traded funds (ETFs) that were selling precious metals across the board. Plus, over the past month, I believe the market was experiencing tax loss selling in both precious metals and mining stocks.

With 2014 upon us, I think these precious metals look quite favorable. Much of the selling by ETFs appears to have ended, yet fundamental demand for these precious metals remains strong. In this situation, it appears that a bullish scenario is emerging as an investment strategy.

Sprott Physical Platinum and Palladium Trust Chart

Chart courtesy of www.StockCharts.com

One way to incorporate this investment strategy of adding these industrial precious metals to a portfolio is through an ETF, such as the Sprott Physical Platinum and Palladium Trust (NYSEArca/SPPP). This particular ETF holds physical precious metals and is a relatively cost-effective method of incorporating this investment strategy without the additional fees of buying and selling physical coins and bars as an individual.

Stillwater Mining Chart

Chart courtesy of www.StockCharts.com

If one were interested in a stock that has exposure to these industrial precious metals, I would consider a firm like Stillwater Mining Company (NYSE/SWC). The company’s investment strategy is to focus on both mining precious metals and extracting platinum and palladium from spent catalytic converters. With operations here in America, there is a lot less risk than other companies with mines in South Africa and Russia.

I’m a value-oriented person, and I like adding stocks in assets when others are selling them as part of my overall investment strategy. I think the entire precious metals sector, including gold and silver along with platinum and palladium, has been oversold. When we look back at 2014, we will see just how cheap this sector was at the beginning of the year.


Business Models of Forex Brokers

Guest Post By Alex Eliades

I have recently been exposed to the various business models that Forex brokers use to profit from offering trading services and it is definitely an area that should be more transparent. To define them we are looking at market making, STP (straight through processing) and ECN (electronic communication network) along with various cocktails of the three.

As many of you will know a broker that works as a market maker matches buyers and sellers together on their own network but makes money by charging a difference in the spread. However, a large percentage of Forex brokers are not able to physically match up the buying and selling of trades as there is very rarely enough orders to do so. If they were to try, then a client would place a trade and often have a long wait until it was matched up with another trade and get processed.

Therefore, a Forex company that offers the market making model uses an external price feed, fulfills orders by becoming the buyer or seller of currency itself. Therefore, in a way a broker offering a market maker model is trading directly with its clients. This means that for a market maker broker the total client trade must overall be negative in order for the broker to profit. At first it may appear like a bad idea to trade with a market maker because a trader could believe that if they consistently make money then it is not in the broker’s interest to have them as a client. Well, if a broker is operating as a 100% market maker then that would be true but most brokers identify traders that profit and large trade volumes of risk and they cover those positions with prime brokers or liquidity providers at a spread lower than they are giving to those clients. This way brokers that operate market maker models can still accommodate and profit from traders that profit. The negative side of this is that while small trades are processed instantly anything over a certain threshold would go to a dealer, who would either accept an order for the broker or pass the risk on to a prime broker. If an order is requested at a price that is unobtainable in the market or is seen too risky then the dealer can reject the order and issue an alternative re-quote, which the client can accept or decline. The whole market maker model does work well for brokers but as many have noted does have a conflict of interest between the client and the broker. It is in the interest of the broker for a novice trader to deposit a lot of money, trade badly and lose everything. If a trader is consistently profitable then a broker operating as a market maker is at risk and will take measures to protect themselves, which in some cases can work against the trader.

Looking at the agency business models otherwise known as STP and ECN there are some distinct differences and advantages when compared to the market maker model. The first thing to understand is that with the agency model the broker acts as a middle man passing trades between a prime broker and its client. The broker covers their operating cost by either adding a mark-up in the spread or by charging a commission on each trade. This way it is in the interest of the broker for the clients to make a lot of trades, profit and continue trading. It is not in the interests of the broker for a client to make a huge deposit and lose everything in a single trade as the broker does not profit from losses. Therefore, the agency model aligns the interests of the trader and the broker and gives the broker a great incentive to provide the best trading environment to its clients so that they can become profitable and trade more. This also makes brokers that follow the agency model ideal for traders that use scalping and hedging strategies or EAs. It is also worth noting that the agency models make re-quotes a thing of the past as orders do not go through a dealing desk. However, it is important to understand that as orders are passed through directly to the market there are some cases when orders cannot be executed at the price ordered in the traders platform. Instead, they get executed at the closest possible price instantly with what is known as ‘slippage’, which is a difference in the order and execution price. This can happen due to latency between the traders PC, the server placing the order and the actual market liquidity itself. Slippage can be both positive and negative and good brokers will always pass on positive slippage to their clients as well as negative slippage. A trader of a direct market access broker will usually experience a 50-50 split between positive and negative slippage when it occurs at all. Under a market maker model the equivalent re-quote will never be positive.

Let’s take a look at the STP and ECN agency models in more depth to understand how they work and differ from one another.

First up, the STP model stands for Straight Through Processing and does as its name suggests. Using an STP model a broker takes the pricing offered from an institutional broker and offers it to the trader with either a spread mark-up or a commission fee per trade.

Second, the ECN model stands for electronic communication network and this works by taking pricing from a pool of liquidity providers and relaying all prices as well as market depth to the trader so that the trader can get the best pricing from many sources. Just like the STP model, a broker offering an ECN to their clients will cover their operating costs through a mark-up in the spread or on commission per trade.

By default, the most popular trading platform MT4 is not capable of passing through ECN pricing from multiple sources with the market depth without the aid of a plugin. For this reason only brokers that offer platforms such as MT5, Saxo Trader and Currenex can offer a true ECN environment to their traders. Despite this many MT4 brokers claim to offer ECN accounts. They either do this with an unofficial MT4 plugin or they are actually offering STP/ECN accounts, which is a cocktail of the two models. Under the STP/ECN model a broker would offer MT4 (that doesn’t support multiple price feeds) and using a bridge have it connected to an ECN so that the best pricing is displayed from multiple liquidity providers in one price feed. This results in the lowest spread forex brokers that offer the MT4 platform.

With the fierce competition between brokers and the push towards transparency in the Forex market it seems that the people will be in search of the best ECN Forex broker for the foreseeable future. Market makers will still continue to operate but the fight between the various broker models will continue to be thrashed out for quite some time and I am sure dominance will boil down to which one can offer the most advantageous trading environment.

Guest Post by Alex Eliades


Intraday Elliott Wave Analysis For AUDUSD And German DAX

From a technical perspective I expect weaker AUD against the buck, but price is still above that 0.8882 key level that needs to be broken for a bearish case. I would love to see push down to 161.8% Fibonacci extension target to make sure that pair is forming an impulsive fall. In such case we would confirm bearish view and look for possible shorts in rest of the week.

AUDUSD 1h elliott wave analysis

If you are intraday trader on German Dax then current price action may be very interesting for you as we see price correcting up with (A)-(B)-(C) formation that represents just a temporary recovery within larger incomplete downtrend. Keep an e ye on that 9500 and 9540 figures from where sell-off may occur.

Dax30( Mar 2014) 1h elliott wave analysis

Written by www.ew-forecast.com

Get 14 Days Trial Just For €1 at >>> Elliott Wave Analysis Service


Fibonacci Retracements Analysis 07.01.2014 (EUR/USD, USD/CHF)

Article By RoboForex.com

Analysis for January 7th, 2014

EUR/USD

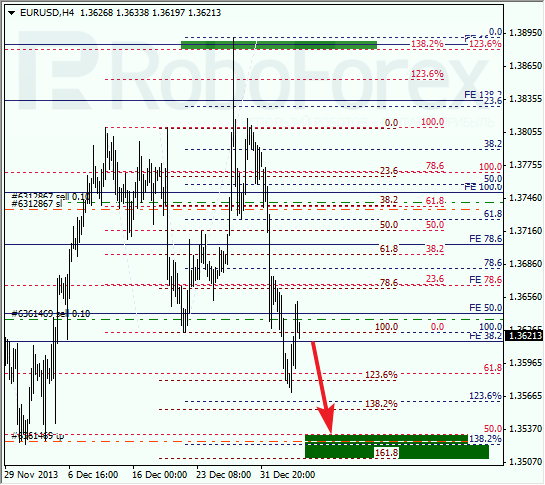
It looks like Eurodollar is about to complete current correction. Possibly, pair may reach new minimum during Tuesday. Main target for the next several days is located near several lower fibo-levels at level of 1.3530.

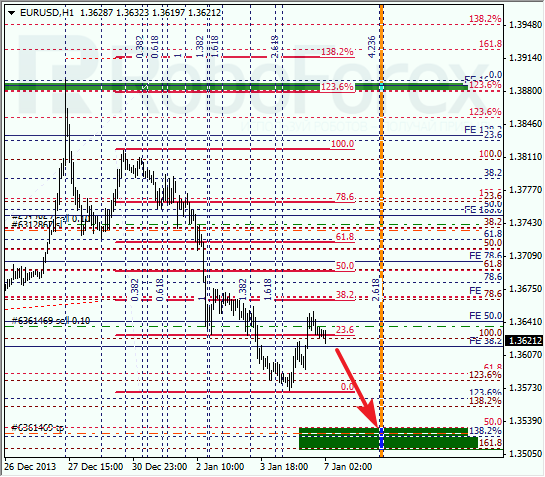
At H1 chart, current correction has almost reached level of 38.2%. Right now, market is trying to start new descending movement. According to analysis of temporary fibo-zones, predicted targets may be reached on Wednesday.

USD/CHF

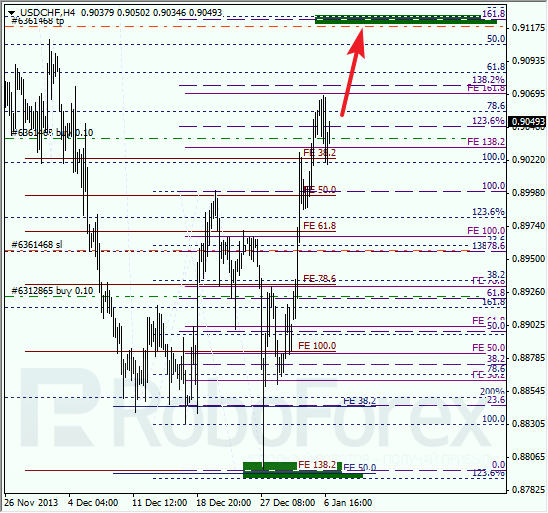
Franc is also trying to start new movement inside main trend. During correction, I opened one more buy order. Main target for bulls is inside upper target area which is very close to level of 0.9120.

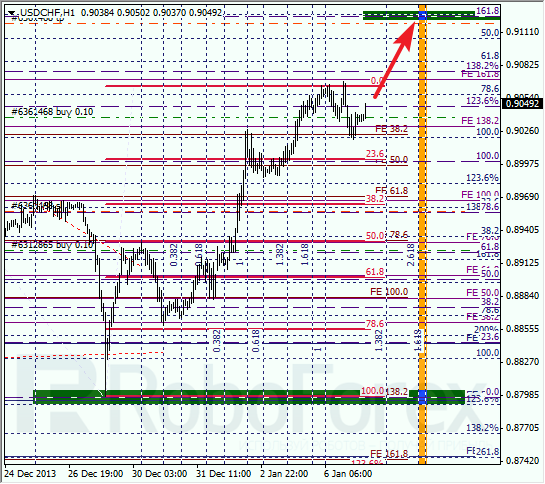
At H1 chart, price couldn’t reach level of 23.6%; bulls are already trying to start new ascending movement to reach new maximums. According to analysis of temporary fibo-zones, bulls may reach upper levels by the middle of this week.

RoboForex Analytical Department

Article By RoboForex.com

Attention!
Forecasts presented in this section only reflect the author’s private opinion and should not be considered as guidance for trading. RoboForex LP bears no responsibility for trading results based on trading recommendations described in these analytical reviews.


Gold Futures Rises as Asian Demand Expected to Increase

By HY Markets Forex Blog

Gold Futures rebounded on Tuesday, picking up from a drop earlier in the day during the Asian trading session as metal investors expect a boost in physical demand in Asia against slowing investment demand.

Bullion for February delivery climbed 0.15% higher to $1,239.80 an ounce on New York’s Comex at the time of writing. Prices for the yellow metal climbed to $1,248.51 yesterday, the highest price since December 16.

Silver futures added 0.2% to $20.2237 an ounce, climbing for the fourth day in a row, while Platinum gained 0.2% to $1,420.50 an ounce at the same time.

The Federal Reserve (Fed) confirmed it would reduce its monthly bond purchases from $85 million to $75 billion, starting this month.

Holdings in the world’s largest exchange-traded product, SPDR Gold Trust, stood at 794.62 tons yesterday, the lowest level since 2009.

Gold Futures – China

“The Chinese will certainly be looking at taking advantage of these lower prices,” said Gavin Wendt, founder and senior resource analyst at Mine Life Pty. “Institutional funds might have one view on gold which is negative but, on the other hand, it seems as though the moms and dads and smaller investors have been buying,” he added.

Last year, the yellow metal dropped by 28.63%, the most since 1981, as investors focus on China after the country used the sinking prices to boost its buying hunger for Gold.

Gold shipments from Hong Kong to China climbed to an estimated 1,017 tons in the first 11 months of the year, according to reports from the Hong Kong Census and Statistics Department. Estimates from the World Gold Council (WGC) showed that China overtook India’s position as the world’s biggest bullion consumer last year.


Visit www.hymarkets.com   to find out more about our products and start trading today with only $50 using the latest trading technology today.

The post Gold Futures Rises as Asian Demand Expected to Increase appeared first on | HY Markets Official blog.

Article provided by HY Markets Forex Blog

AUD/USD: Australian Dollar Falls on Trade Deficit Data

By HY Markets Forex Blog

The Australian dollar dropped on Tuesday towards $0.89 against the greenback. Analysts are predicting the currency to drop further as the trade balance indicates a shortage.

The Australian currency dropped 0.36% lower to $0.8926 at the time of writing, dropping from $90.05, its highest level since Dec 12. While the total value of trade between Australia and China, its biggest trading partner, declined for the first time in five months.

“It’s notable that speculators continue to punish the Aussie dollar even though there seems to be no fresh reason to do so,” said Sean Callow, a senior currency strategist at Westpac Banking Corp. “It provides us a reminder that 90 U.S. cents look as though it is hard work near term. On the downside, it’s fair game anywhere to about 88.50.”

The yields on 10-year Australian government debt dropped by 0.06% to 4.32%, down from the previous reading of 4.415, the highest since Dec 9.

Reserve Bank of Australia Governor Glenn Stevens has been set on strengthening the nation’s currency. “I thought $0.85 would be closer to the mark than $0.95,” Stevens said in an interview, “To the extent that we get some more easing in financial conditions, at this point it’s probably more preferable for that to be via a lower currency at the margin than lower interest rates,” Stevens added.

Australia Trade Deficit

The trade deficit slid from the previously revised 358 AUD million to 118 AUD million in November, according to reports from the Australian Bureau of Statistics on Tuesday. The reading came in lower than $300 million deficit forecasted by analysts.

Exports increased by $94 million in a month to approximately $27.27 billion in November, while import came in 1% lower to $27.49 billion.


Win a luxurious trip to the Maldives & up to $30,000 cash for trading with us!

Visit for details http://alturl.com/2kysk 

The post AUD/USD: Australian Dollar Falls on Trade Deficit Data appeared first on | HY Markets Official blog.

Article provided by HY Markets Forex Blog

Murray Math Lines 07.01.2014 (AUD/USD, EUR/JPY, SILVER)

Article By RoboForex.com

Analysis for January 7th, 2014

AUD/USD

Australian Dollar rebounded from trend line, but market couldn’t keep price below Super Trends so far. I’m keeping two sell orders and expecting pair to break the 0/8 level. Target for the next several days is at the -2/8 level.

At H1 chart, price rebounded from the 7/8 level, which may be considered as the first sign of reverse downwards. Possibly, price may break the 4/8 level in the nearest future. If later pair is able to stay below the 3/8 level, price will continue falling down towards the 0/8 one.

EUR/JPY

At H4 chart, EUR/JPY rebounded from Super Trend. The first target for bears will be the 6/8 level. If they break it, pair may start new and deeper correction.

At H1 chart, price is already moving below the 3/8 level and Super Trends, which are in “red zone”. Short‑term target is at 0/8 level, where I’ve placed Take Profits on my sell orders.

SILVER

Silver rebounded from the 0/8 level and Super Trends formed “bullish cross”. During correction, I opened short-term buy order. If market is able to keep price above the 5/8 level, instrument will continue growing up towards the 8/8 one.

At H1 chart, price is still trying to enter “overbought zone”. Possibly, Silver may break the 8/8 level during Tuesday. If later instrument breaks the +2/8 level, lines at the chart will be redrawn.

RoboForex Analytical Department

Article By RoboForex.com

Attention!
Forecasts presented in this section only reflect the author’s private opinion and should not be considered as guidance for trading. RoboForex LP bears no responsibility for trading results based on trading recommendations described in these analytical reviews.