Australian Dollar Climbs 5-Week High on Jobs Data Forecast

By HY Markets Forex Blog

The Australian dollar began the trading week higher, touching a month-high on Monday as the US dollar dropped following the release of the jobs labour data last week; which came in below analysts’ forecast.

The aussie gained 150 pips after the jobs data released on Friday revealed the report missed estimates. The Australian currency gained against 14 out of 16 major currencies, supported by the report which revealed home loans advanced in November.

The aussie came in above the $0.90 mark, adding 50 pips to $0.9042, the highest since Dec 13. The Australian dollar jumped 0.45% higher at $0.9032 at the time of writing.

Australia’s ten-year bond yield dropped four basis points to 4.23%.

Australian Dollar – Australia Data

November’s home loans climbed by 1.1%, slightly higher than analysts forecast of a 1% rise and also supports the recent data which shows the strength in Australia’s construction sector.

“Home loan and job ads data were both in line with recent trends,” the RBC analysts wrote in a note on Monday. “A solid pace of activity in the housing market but as yet little sign that the broader economy is in a position to meaningfully add to headcount.”

Australia’s employment figures are expected to be released next week as analysts predict an additional 10,000 jobs were added in Australia’s employment sector, following November’s 21,000 rise. In the US, jobs increased by 74,000 in December, below forecasts of a 197,000 rise.

While the US unemployment rate dropped 6.7%, dropping from November’s record of 7%.

Fed Tapering

The disappointing jobs report released last week set off speculation over the Federal Reserve (Fed) monthly bond purchases. Traders are predicting the Fed officials to delay the expected further-reduction in the banks stimulus.


Win a luxurious trip to the Maldives & up to $30,000 cash for trading with us!

Visit for details http://alturl.com/2kysk 

The post Australian Dollar Climbs 5-Week High on Jobs Data Forecast appeared first on | HY Markets Official blog.

Article provided by HY Markets Forex Blog

Gold Extend Gains to One-Month High on Fed-Taper Speculation

By HY Markets Forex Blog

Gold futures rose to the highest level in a month on Monday, rising for a third straight session on speculations the Federal Reserve will slow down further cuts to its bond purchases after the US payrolls came in lower than forecasted.

Gold deliveries for February rose 0.17% higher to $1,249.10 an ounce at the time of writing on New York’s Comex, while silver futures dropped 0.42% to $20.140 an ounce. At the same time platinum climbed 0.4% to $1.442.21 an ounce.  Prices for the metal were also driven by the weakened US dollar, while the US dollar index declined 0.10% lower to 80.63 points at the time of writing.

Spot gold rose for a third week, the longest since August, while jobs in the US increased by 74,000 in December, below forecasts of a 197,000 rise.

The net-long position for the yellow metal increased by 18% to 40,229 futures and options in the week ended Jan; US Commodity Futures Trading Commission data reveled.

Gold – Fed Tapering

In the US, the non-farm payroll data that was released on Friday showed that jobs were increased by 74,000 in December, below forecasts of a 197,000 rise and dropping from the revised 241,000 positions added in November.

The report also showed that the world’s largest economy’s unemployment rate dropped 6.7%, dropping from November’s record of 7% and the lowest since Oct 2008.

Traders are predicting the Fed officials to delay the expected further-reduction in the banks stimulus due to the recent macroeconomic data. Last month, the Federal Reserve (Fed) announced it will begin to reduce its $85 billion monthly bond purchases by $10 billion.


Visit www.hymarkets.com   to find out more about our products and start trading today with only $50 using the latest trading technology today.

The post Gold Extend Gains to One-Month High on Fed-Taper Speculation appeared first on | HY Markets Official blog.

Article provided by HY Markets Forex Blog

Violence Threatens to Thwart Iraqi Oil Resurgence

By OilPrice.com

A wave of violence has swept parts of Iraq at the start of 2014 as the central government fights back against Al-Qaeda aligned militants in Anbar Province. The Islamic State of Iraq and the Levant (ISIL) reportedly took control of Ramadi and Fallujah, bombing police headquarters and killing dozens. On New Year’s Day Prime Minister Nouri al-Maliki sent in reinforcements to take back control of Anbar Province’s two largest cities. The clashes kick off 2014 in much the same way as 2013 ended – a return to violence in a country that had seen important security gains in recent years.

Over 7,800 civilians were killed in Iraq in 2013, the bloodiest year over the past five. The latest violence occurred in Anbar Province, a region that dogged the U.S. military during its decade-long war. ISIL is also engaged in fighting Syrian President Bashar al-Assad, and the latest string of events indicates that the violence of the Syrian civil war is spreading deeper into Iraq.

The conflict has yet to affect Iraq’s oil fields, and production hit 3.2 million barrels per day (bpd) in December, the most since August 2013, according to Bloomberg. To be sure, the violence does not pose an immediate threat to Iraq’s oil output, as three-fourths of the country’s production comes from the South, and much of the rest from Kurdistan in the North. In fact, according to the EIA, a majority of Iraq’s oil production comes from three fields – Kirkuk, and the North and South Rumaila fields near Basra. The latest violence is not located near these areas.

Still, the instability and the loss of control of key cities by the Iraqi government underscores the intense security challenge facing the country as it seeks to ramp up oil production in the coming years. Iraq has a stated goal of tripling oil production to 9 million bpd by 2020. In a 2012 special report on Iraq, the IEA estimates a slightly less rosy figure of 6.1 million bpd by the end of the decade in its central scenario.

With the immense challenges facing Iraq’s oil sector, even doubling today’s output over the next six years looks rather ambitious. Iraq still has not agreed on a hydrocarbons law that would outline oil governance. Kurdistan is making brazen moves aimed at increasing its independence from the central government in Baghdad. This may help to boost Kurdish oil production, but political conflict between the semi-autonomous region and the Maliki government casts a shadow of uncertainty over the country’s oil industry. Most importantly, however, is the violence that threatens the stability of Iraq, which is now the second largest OPEC producer after Saudi Arabia.

While Iraq’s failure to meet its ambitious oil production goals may seem to be a problem solely for Iraq, oil consumers around the world may be more dependent than they realize on the oil fields of Rumaila and Kirkuk. Over the next 20 years, according to the IEA’s latest World Energy Outlook, Iraq will account for the largest source of additional oil production to global markets. Yet, its failure to live up to those hopeful projections – and given the latest reports of violence, that seems entirely plausible – will send prices much higher than the 2035 price of $128 per barrel that the IEA predicts, as supply does not keep pace with demand.

Source: http://oilprice.com/Energy/Crude-Oil/Wave-of-Violence-Threatens-Ambitious-Iraqi-Oil-Goals.html

By. Nicholas Cunningham of Oilprice.com


EURUSD Elliott Wave Analysis: Corrective Rally

EURUSD moved higher on Friday which should not be a surprise as we know that after every five waves correction follows. We can count impulse down in red wave 1) so current upward reaction is normal. We are tracking wave 2) that represents a contra-trend reaction that should be made by three legs. We will be tracking A-B-C waves up to 1.3700-1.3750 region from where pair could turn down again, back to 1.3543. Critical, or invalidation level remains at 1.3891; as long it will hold, trend is down.
EURUSD 4h Elliott Wave Analysis
eurusd elliott wave analysis
Written by www.ew-forecast.com
14 Days Trial Just For €1 >> www.ew-forecast.com/register


Warning: Cheesepocalypse is Upon Us!

By WallStreetDaily.com Warning: Cheesepocalypse is Upon Us!

Analysts and economists can’t resist fretting over the potentially terrifying impact of the Fed’s taper, which begins this month. I’m here to tell you that a more dire crisis is unfolding – an imminent shortage of everyday Americans’ most beloved commodity.

“We want you to hear directly from us that it’s true,” reads Velveeta’s official Tumblr page. “We are experiencing a temporary scarcity of our nation’s most precious commodity: Liquid Gold.”

At the start of the NFL playoffs? Say it isn’t so!

Sadly, it is so, my fellow Wall Street Daily readers.

Kraft (KRFT) blames the shortage on “a combination of minor manufacturing challenges.”

After last year’s hysteria over a potential shortage of chicken wings, you’d think companies providing the most popular football-season food items would take precautions. Apparently not.

While Kraft swears that it’s a “short-term issue,” I wouldn’t trust them. If you’re having a Super Bowl party, stock up!

Now, as far as what impact the appropriately dubbed “Cheesepocalypse” will have on Kraft’s overall business and stock price, I can’t tell you. Not until February 13. That’s when the company is slated to report fourth-quarter results.

And that brings us to the next issue I want to address today – earnings. Because this time around, there are two things we should be extremely concerned about as the reporting activity kicks into high gear…

Where it’s At

Forget having “two turntables and a microphone” like the Beck song suggests. When companies start reporting earnings en masse in a few weeks, earnings growth is “where it’s at.”

Why? Because stock prices ultimately follow earnings. But lately, they’ve been advancing on the backs of multiple expansions. So investors are paying more and more for the same penny of earnings.

Case in point: In the last 12 months, the price-to-earnings (P/E) ratio on the S&P 500 Index expanded almost 20% – from 14.7 to 17.3.

That’s not a sustainable situation. When P/E ratios soar uncontrollably, the end of the bull market is nigh.

Now, there are two ways to keep multiple expansions in check. Either the denominator in the calculation (earnings) increases or the numerator (prices) decreases.

It goes without saying, of course, that we want the former to happen. After all, declining prices are only good for short sellers.

With that in mind, here’s what’s troubling me…

At the end of September 2013, analysts estimated that S&P 500 companies would grow earnings by 9.6% in the fourth quarter.

Over time, analysts always revise those estimates downward as they get more data. In fact, during the last five years, the average decline in estimates has been 5.8%, according to FactSet’s latest Earnings Insight report.

However, this go-round, they didn’t lower expectations as much as usual. They now expect fourth-quarter earnings to grow by 6.3% – a drop of only 3.3%.

That means either the underlying data driving their calculations strengthened – or analysts are way too optimistic.

If it’s the latter, the stage could be set for major disappointments. Investors don’t tend to take kindly to companies reporting lower-than-expected profit growth.

So, like I said before, companies better bring it when it comes to reporting growth results. Otherwise, stock prices could start dropping – quickly.

Why So Glum, Chum?

Guidance promises to be another critical factor this earnings season.

Why? Because an obvious disconnect currently exists between the underlying economic data and company outlooks…

You see, the latest economic reports, most notably the recent GDP figures, point to an economy that’s accelerating. And more economic activity on the horizon should translate into more sales and profits for companies.

However, the overwhelming majority of S&P 500 companies that provided guidance so far don’t reflect such a reality. Of the 107 companies in the S&P 500 that have issued fourth-quarter earnings guidance, 88% issued negative guidance.

Granted, companies love to underpromise and overdeliver. Hence, the five-year average percentage for negative guidance of 64%, according to FactSet. But we’re talking about an abnormally high level of pessimism right now.

If companies don’t start issuing upbeat guidance, there could be trouble on the horizon that has yet to show up in the economic data.

Bottom line: It’s common for bull markets to climb proverbial “walls of worry.” But at this stage in the bull market, slowing growth and overly negative outlooks aren’t worries we can simply overlook.

So keep an eye on the data. Because the implications could be far more disastrous than a Cheesepocalypse.

Ahead of the tape,

Louis Basenese

The post Warning: Cheesepocalypse is Upon Us! appeared first on Wall Street Daily.

Article By WallStreetDaily.com

Original Article: Warning: Cheesepocalypse is Upon Us!

EURUSD – Short Term Rectangle Pattern

Article by Investazor.com

eurusd-short-term-rectangle-pattern-resize-13.01.2014

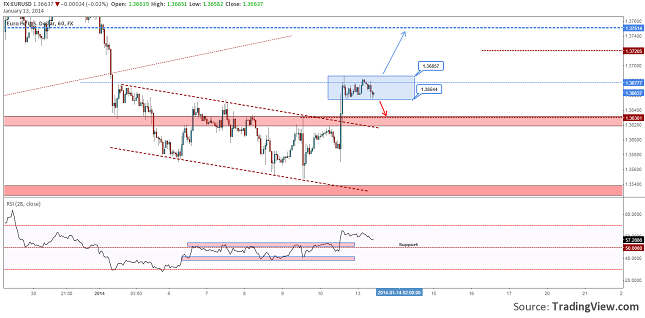
EURUSD bounced back from the top hit on Friday and retested a local low at 1.3654. The price has drawn a Rectangle pattern right after a clear up move. Statistics shows that from here the probability is higher for the price to break above the resistance of the pattern (1.3685) and continue the previous move. Any bounce, or false breakout, can be a good bullish signal. The upside targets for the continuation of the rally is at 1.3720 and 1.3750.

Don’t stick with only one direction. A close under 1.3654 could mean that bears are putting some pressure and the price might fall back to retest 1.3630/10. From here I am tented to say again long, but the price action should be read again at the given moment.

The post EURUSD – Short Term Rectangle Pattern appeared first on investazor.com.

Apple Inc. Price Action Entering the 5th Wave

Article by Investazor.com

aapl-entering-5th-wave-resize-13.01.2014

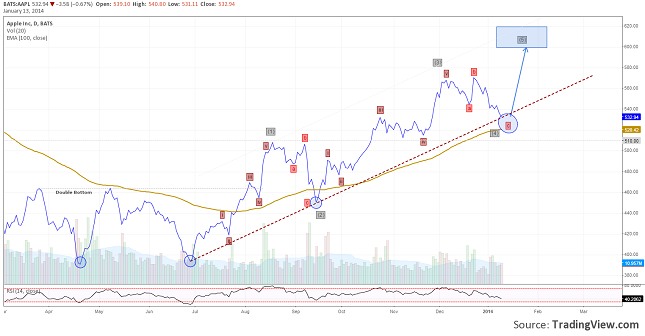
On the 27th of June the price of Apple Inc.’s stocks reached the second low of the Double Bottom pattern ,confirmed in the end of July by a breakout above 463$ per share. The pattern gave a very good signal for the trend reversal.

From the beginning of July until the mid of September the price has drawn a 5 small waves up moves, drawing Wave 1 on a higher level, and an abc correction, ending as well the 2nd wave. From 16th of July started another up move formed by 5 lower rang waves, which in my opinion has drawn the 3rd wave at the higher level that has ended in the beginning of December.

From 5th of December all the way to 10th of January 2014, the price has drawn a 3 wave, corrective move, which has touched the uptrend line and got pretty close to the 100 EMA. This means that around the price can find a good support area around 525$ per share. If the 4th wave will be over around here, I expect the price to rally to 600$ per share, ending this way the 5 wave pattern mentioned in Elliott Wave Theory.

Even though the price moved beautiful conform EWT I would be attentive at this support zone. If bulls will not pressure the price to bounce, we might see a fall under the trend line. A daily close under the 100 EMA could annihilate the current analysis and the price might fall back to retest 500$ per share, or, why not, even lower.

The post Apple Inc. Price Action Entering the 5th Wave appeared first on investazor.com.

Japanese Candlesticks Analysis 13.01.2014 (EUR/USD, USD/JPY)

Article By RoboForex.com

Analysis for January 13th, 2014

EUR/USD

H4 chart of EUR/USD shows bullish tendency, which started after Harami and Tweezers patterns. Three Methods pattern, Three Line Break chart, and Heiken Ashi candlesticks confirm that bullish tendency continues.

H1 chart of EUR/USD shows also shows bullish tendency, which continued after Morning Star and Tweezers patterns. Closest Window is resistance level. Three Line Break chart and Heiken Ashi candlesticks confirm ascending movement.

USD/JPY

H4 chart of USD/JPY shows bearish tendency, which is indicated by Tower pattern. Closest Window is broken; now it’s resistance level. Three Line Break chart and Heiken Ashi candlesticks confirm descending movement.

H1 chart of USD/JPY shows descending trend. Closest Window is resistance level. Three Line Break chart and Heiken Ashi candlesticks confirm descending movement.

RoboForex Analytical Department

Article By RoboForex.com

Attention!
Forecasts presented in this section only reflect the author’s private opinion and should not be considered as guidance for trading. RoboForex LP bears no responsibility for trading results based on trading recommendations described in these analytical reviews.


Murray Math Lines 13.01.2014 (AUD/USD, EUR/JPY, SILVER)

Article By RoboForex.com

Analysis for January 13th, 2014

AUD/USD

Correction turned out to be deeper than we expected; market formed bearish Wolfe Wave, that’s why price may yet continue falling down. I opened quite a risky sell order and plan to move stop into the black right after pair rebounds from Wolfe Wave’s upper border.

At H1 chart we can see, that bulls have already reached the 8/8 level. If pair rebounds from it during the day, bears will return to the market. Closest target is at the 6/8 level: if price breaks it, pair will continue falling down.

EUR/JPY

Right after the market opening, pair reached new minimum and I moved stop on my order into the black. I’m planning to close my sell order using Take Profit at the 2/8 level. However, if price breaks this level, I may open sell orders again.

At H1 chart, Super Trends formed “bearish cross”; earlier price rebounded from the 7/8 level several times. Right now, market is being corrected, but may start new descending movement in the nearest future.

SILVER

Silver is moving upwards and trying to rebound from the 8/8 level. In addition to that, price is very close to the already tested trend line, which means that instrument may start, at least, new local descending movement.

The lines at the H4 and H1 charts are completely the same. If price is able to stay below Super Trends and later break the 4/8 level, I’ll increase my short position. However, this trade is quite risky, that’s why I’m planning to move stop into the black right after instrument starts moving downwards.

RoboForex Analytical Department

Article By RoboForex.com

Attention!
Forecasts presented in this section only reflect the author’s private opinion and should not be considered as guidance for trading. RoboForex LP bears no responsibility for trading results based on trading recommendations described in these analytical reviews.


Crude Oil Trading Pushes Price of WTI to 8 Month Low

By HY Markets Forex Blog

Crude oil trading resulted in West Texas Intermediate crude falling to its lowest price in eight months on Jan. 9.

This contract managed to decline in value as traders expressed their concerns about the supply-demand fundamentals that exist for the commodity, according to The Wall Street Journal. These industry participants emphasized that the demand for petroleum fell last week, and that domestically, the production of crude oil recently rose to record levels.

Prices fall to eight-month low

February WTI futures settled at $91.66 a barrel on the New York Mercantile Exchange, which represented the lowest closing price for the contracts since May 1, Bloomberg reported. In addition, brent futures scheduled for February settlement finished the session down 0.7 percent at $106.39 a barrel on the London-based ICE Futures Europe exchange.


Oil Production Surges

On Jan. 8, WTI experienced a 1.4 percent decline, which coincided with data released by the Energy Information Administration, indicating that during the most recent week, 8.15 barrels of crude were produced per day, according to the news source. This represented the highest amount generated since September 1998.

One factor that has helped to bolster the production of U.S. oil companies is advances in available technology, which have made it easier for industry participants to extract the commodity from shale rock formations, The Wall Street Journal reported.

“There’s been a huge increase in domestic crude-oil production,” Adam Wise, who works for Manulife Asset Management in Boston as a managing director, told Bloomberg. “The gains in output should continue. They’ve turned on the spigot and are getting better at finding ways to move the oil to market.”


Libya speculation helps provides headwinds

Another factor that helped stimulate crude oil trading and push the price of the commodity lower was speculation that in the near future, the African nation of Libya will start generating a greater amount of oil, according to Investing.com.

In 2013, the nation’s production of oil was curtailed sharply as protestors helped to hinder operations, the media outlet reported. Amid these challenges, Libya managed to create around 100,000 barrels per day. In 2014, this production has reportedly risen to 650,000 barrels per day. Even though Libya has started generating more oil, the nation is only generating roughly 50 percent of what it is capable of producing.

The Sharara oil field recently resumed generating the raw material, and other locations in the nation have started producing the commodity once again, according to Bloomberg. Ibrahim Al Awami, who is the top official at the oil ministry’s department of measurement and inspection, told the media outlet on Jan. 8 that crude supplied by Sharara will soon by exported by the port of Zawiya, which is located in Western Libya.

The price of oil received a minor boost during the day as a result of production problems in the North Sea, The Wall Street Journal reported. The Buzzard field, which usually generates about 200,000 barrels of oil every day, stopped operating, according to Bloomberg. Operator Nexen Inc. told the media outlet that the the field would soon be producing once again.

“The halt of Buzzard production gave the market a pop,” John Kilduff, partner at New York-based hedge fund Again Capital LLC, told the news source. “Disruptions in North Sea supply have repeatedly boosted prices over the last year.”


Government data indicates surging stockpiles

In addition, government reports indicating the robust stockpiles of oil that the United States has accumulated helped to put downward pressure on the price of the commodity, according to The Wall Street Journal.

Data provided by the EIA revealed that during the week that ended on Jan. 3, a total of 357.9 million barrels worth of oil were held in U.S. stockpiles, Investing.com reported.

In addition, the total reserves of motor gasoline inventories rose by 6.24 million barrels during the period, which was far higher than the increase of 2.28 million barrels that was expected, according to the news source. The existing stockpile of distillate fuel also rose during the week, increasing by 5.83 million barrels.

“We’re still digesting yesterday’s EIA data,” Bob Yawger, who works for Mizuho Securities USA Inc. as director of the futures division, told Bloomberg. “Crude supplies have dropped more than 33 million barrels in six weeks, which is huge. This is being balanced by an avalanche as far as the products are concerned.”

Demand concerns

Many traders have indicated that they are concerned about the demand that exists for distillates and gasoline, according to The Wall Street Journal. The reserves of these two rose by more than expected during the week ending Jan. 3.

“The fundamentals don’t look good,” Phil Flynn, senior market analyst at the Price Futures Group in Chicago, told Bloomberg. “Crude production continues to surge ahead and the refiners are processing this into fuel that is going into storage.”

The post Crude Oil Trading Pushes Price of WTI to 8 Month Low appeared first on | HY Markets Official blog.

Article provided by HY Markets Forex Blog