How Putin Conquered South Africa

By Marin Katusa, Chief Energy Investment Strategist, Casey Research – How Putin Conquered South Africa

In the global war for energy supremacy, Russia has won another victory over the United States.

This time, the battleground has been South Africa, where Russia’s state-owned nuclear power company, Rosatom, has just signed an agreement to build eight new reactors. Once all of them are operational, South Africa’s nuclear capacity will increase more than sixfold—from 1.8 gigawatts (GW) to 11.4 GW over the next 15 years.

This means that Russia will help develop the entirety of South Africa’s nuclear energy sector, including financing and training.

And just as importantly, South Africa will be using Russia’s nuclear fuel.

Rosatom has been busy signing these types of deals with other foreign countries as well—Finland, Turkey, Ukraine, even the United Kingdom—which guarantees that Russia will be able to keep a stranglehold on these countries’ nuclear industries.

The strategy is clear: Rosatom is aiming to become the world’s largest supplier of uranium in the coming years.

Remember what we said about the ongoing “Putinization” of Europe’s oil and gas; how Russia is planning to leverage its control over Europe’s energy to gain political and economic benefits?

The same thing is happening in uranium, except the stakes are even higher—because Putin is now looking to dominate the global nuclear market.

Russia and the former Soviet nations (colloquially called “the -stans”) already control nearly half of the world’s uranium supply:

Similarly, they hold more than half of the world’s capacity for uranium enrichment, a necessary part of fuel fabrication:

Note that the United States only controls 3% of global uranium supply—and less than 15% of the enrichment capacity, despite the fact that it’s the largest consumer of uranium in the world.

While nuclear energy powers one out of every five homes in America, the US currently imports more than 90% of the uranium required for its nuclear reactors.

So what happens when one day Rosatom says “Nyet” to the American utilities? You can be sure that they’ll be scrambling to find any source of uranium they can get their hands on.

And they’ll pay far more than the current spot price of US$34.50/lb. You should know that the price of uranium accounts for just 3% of the total costs of a nuclear power plant, so whether the utilities pay $100 or even $200 per pound of yellowcake is irrelevant, as long as they can keep the reactors running and the lights on in America.

As the US and other countries scramble to get out from under Putin’s heavy thumb, for the right uranium producers outside of Russia’s sphere of influence, this will be a bonanza for the history books.

***

You just read an article from the Casey Daily Dispatch, Casey Research’s informative daily e-letter. Get the Daily Dispatch in your inbox every day and stay in the loop on the ever-changing energy, gold, and technology sectors, as well as big-picture economic trends… all completely free of charge. Click here to get it now.


Monetary Policy Week in Review – Jan 6 -10, 2014: ECB sharpens guidance as BOE likely to tweak its guidance

By CentralBankNews.info
    Last week’s main event in global monetary policy was the European Central Bank’s (ECB) sharpening of its commitment to maintain an accommodative monetary policy, illustrating the advantage of its so-called ‘open-ended guidance’ and the contrast to the Bank of England’s (BOE) version of ‘state-contingent’ guidance.
    The ECB on Thursday underlined its readiness to “take further decisive action” if the inflation outlook worsens or money market rates rise. It also added the words of “strongly emphasizes” and “firmly reiterate” to its guidance from July that it will maintain an accommodative stance for a long as necessary and that rates are expected to remain at their current, or lower levels, for an extended period of time.
    For the ECB, it was relatively simple to adjust its forward guidance to financial markets and investors seemed to understand the ECB’s message.
    Major central banks are currently employing their own versions of forward guidance with the ECB’s version a qualitative indication of the length of time that it believes its policy rates will remain at current levels. The ECB has been very deliberate in not defining what it means by “extended period,” even going so far as to issue a statement last July that corrected statements by board member Joerg Asmussen who said the period goes beyond 12 months.
    The advantage of this open-ended guidance is clearly the flexibility it gives the ECB in adjusting its message to new economic data.
    However, the drawback is the lack of specific information that can affect expectations about short-term interest rates.

    The pros and cons of the BOE version of forward guidance, known as ‘state-contingent’ guidance, was also a topic of much public debate last week.
    In August the BOE adopted this form of forward guidance, saying it would not raise its bank rate from its current level of 0.5 percent at least until the unemployment rate had fallen to “a threshold of 7%.”
    But UK unemployment rate has fallen much faster than the BOE had projected so financial markets are now wondering whether the BOE will raise rates sooner than expected.
    When the BOE set out its unemployment threshold in August, the UK unemployment rate was 7.8 percent and the rate was first forecast to hit the threshold in late 2016, implying the bank rate would first be raised that year.
    But the economy has improved much faster than projected and the jobless rate already fell to 7.4 percent in October and is forecast by some economists to hit the 7.0 percent threshold in coming months, raising the possibility that the BOE could raise rates already this year.
    This has ignited speculation that the BOE could lower its unemployment threshold to 6.5 percent as the governor, and other BOE officials and most economists, do not believe the UK economy is strong enough right now to handle higher rates.

    The UK debate echoes the debate within and around the Federal Reserve for most of last year.
    Like the BOE, the Fed picked unemployment as its threshold for considering any rate rise, with the Fed setting its eye on a jobless rate of 6.5 percent, a lower number given its dual mandate.
    A discussion over the Fed’s forward guidance was triggered by its statement May 2013 that it may to start to reduce its asset purchases “in the next few meetings.” Financial markets interpreted a tapering of asset purchases as sign that the Fed was getting ready to raise rates.
    But this was not the Fed’s intention and Fed officials spent the next months making sure the markets understood that it was still a long way away from considering rate rises. Fed policymakers then debated how to strengthen the guidance surrounding its fed funds rate to avoid another spike in market rates when the eventual decision to trim asset purchases was taken.
    The result was that in December, when the Fed announced it would start trimming asset purchases, it adjusted the guidance by adding the phrase that rates would be held at its current level “well past the time” that the unemployment rate reaches the 6.5 percent threshold.

    So how is the BOE likely to respond based on the Fed’s experience?
    The first point is that the BOE in August and in its latest November inflation report described the 7.0 percent unemployment rate as a “threshold” and not a “trigger” for a rate rise. Reaching the threshold will therefore not automatically result in a rate rise but rather merely open the discussion.
    The second point is that the BOE, like the Fed, has been engaged in asset purchases, so-called quantitative easing.
    A few economists had expected the BOE to issue a comment on its guidance last week following its policy meeting, but most are looking for the BOE to use the publication of its inflation report on Feb. 12 as the right occasion to fine-tune its guidance.
    Based on the Fed’s experience, the BOE is likely to do two things.
    First, it will reiterate and possibly tweak the guidance surrounding the unemployment threshold, emphasizing and repeating that the threshold is a “way station” – as Governor Mark Carney said in August – at which the bank will reassess its appropriate stance.
    Lowering the unemployment threshold, as some commentators have suggested, after only six months seems very unlikely as it would damage the BOE’s credibility.
    Second, the BOE is likely to draw a distinction between its asset purchases and the bank rate. As the Fed’s experience showed, investors and markets are not always adept at distinguishing between less monetary accommodation, i.e. taking the foot slightly off the gas pedal, and an actual tightening of the policy stance.
    The BOE has been undertaking quantitative easing since March 2009 and last boosted the volume of its asset purchases in July 2012 to the current total of 375 billion pounds. At this point, the BOE is maintaining the stock of assets purchases, meaning that it reinvest bonds that mature.
    Describing the conditions for winding down asset purchases as a prelude to normalizing policy would be an obvious first step by the BOE to ensure that investors don’t confuse fewer asset purchases with monetary tightening and also strengthen the BOE’s forward guidance.

    In addition to the ECB and the BOE, the central banks that maintained rates last week included Poland, South Korea, Indonesia and Peru. The only bank that cut rates was Romania.
    Through the first two weeks of the year, 2 central banks have cut their rates, or 20 percent of this year’s 10 policy decisions taken by the 90 central banks followed by Central Bank News. The other 80 percent of decisions have favored unchanged rates. This compares with the end of 2013 when 23.2 percent of last year’s 505 policy decision resulted in rate cuts.
   

LIST OF LAST WEEK’S (WEEK 2) DECISIONS: 

TABLE WITH LAST WEEK’S MONETARY POLICY DECISIONS:

COUNTRYMSCI             DATE CURRENT  RATE        1 YEAR AGO
ROMANIAFM3.75%4.00%5.25%
POLANDEM2.50%2.50%4.00%
SOUTH KOREAEM2.50%2.50%2.75%
INDONESIAEM7.50%7.50%5.75%
UNITED KINGDOMDM0.50%0.50%0.50%
EUROSYSTEMDM0.25%0.25%0.75%
PERUEM4.00%4.00%4.25%
This week (Week 3) four central banks will be deciding on monetary policy, including Brazil, Serbia, Chile and Egypt.

COUNTRYMSCI     NEW RATE           OLD RATE        1 YEAR AGO
BRAZILEM15-Jan10.00%7.25%
SERBIAFM16-Jan9.50%11.50%
CHILEEM16-Jan4.50%5.00%
EGYPTEM16-Jan8.25%9.25%


Chen Lin Says Investors Should Bank on Balance Sheets While Waiting for the Next Wave in Gold and Gold Miners

Source: Kevin Michael Grace of The Gold Report  (1/13/14)

http://www.theaureport.com/pub/na/chen-lin-says-investors-should-bank-on-balance-sheets-while-waiting-for-the-next-wave-in-gold-and-gold-miners

For over a decade, mining companies have relied on a rising gold price to reward their decisions, regardless of whether they were good decisions. Those days are over, and Chen Lin, author of the What is Chen Buying? What is Chen Selling? newsletter, says that investors must embrace companies that can grow their balance sheets even with gold as low as $1,000/ounce. Companies that can generate cash flow and acquire assets at fire sale prices today will likely be the winners in the next wave. In this interview with The Gold Report, Lin identifies a handful of producers that meet this threshold and one explorer well positioned to join their ranks.

The Gold Report: You told The Gold Report in June that you were still bullish on gold “in the long run.” Are you still bullish? And how soon is the long run?

Chen Lin: Gold may continue to correct in 2014 and maybe even longer. There is a chance it will hit $1,000/ounce ($1,000/oz). However, inflation will pick up as the result of all the money printing by the central banks. That’s when gold’s run will really begin.

TGR: You’ve said that the price of gold is being controlled by the “paper market on Wall Street.” Could you elaborate on that?

CL: You can use very little money down to buy gold using the future markets. This leverage is guaranteed by the biggest financial institutions in the United States and the world. In turn, those financial institutions are guaranteed by taxpayers. So the gold price has really been controlled by the paper-market traders. But this could change.

TGR: Isn’t gold supposed to be a real thing that cannot be duplicated endlessly?

CL: There is a difference between physical gold and paper gold. But traders see gold as no different from other stocks. There are a lot of things going on we won’t know until later.

Right now, China is the biggest gold bullion buyer. And the gold price will probably peak around the Chinese New Year, which is at the end of January. How much further it will bounce from there, it’s hard to say.

TGR: Are you worried about China’s future?

CL: I’m very concerned. The housing bubble is showing signs of bursting. A lot of empty apartments have been built and are still being built. The strain on the Chinese banking system is very high. In the past few months, most of the banks have not been able to issue mortgages because they don’t have the money to lend.

TGR: I’ve seen it reported that there is far more quantitative easing in China than anywhere else, most of it unofficial.

CL: China’s central bank is not very transparent. At least with Ben Bernanke we know how much money the Federal Reserve is creating. In China, this is a state secret. But the money printing in China is enormous, really massive. The Chinese private investor is right to buy physical gold, just in case something blows up.

My concern is that if China really runs into some trouble, the gold price will get hit because China is the largest gold buyer. We saw this during the Asia crisis of 1997–1998. Back then, people were selling gold, silver and even kidneys, believe it or not, to survive.

TGR: How much of the current woes of the precious metal equities can be blamed on low prices and how much on mismanagement?

CL: Bad management teams deserve a lot of the blame. They pay themselves a lot of money. They live lavishly. Most are overaggressive. They buy properties at the top of the market, and they raise money at the bottom. They constantly issue more shares, which kills investor confidence.

But the brokers are guilty, too. Every day they try to talk management into raising capital because they get commissions. And if management doesn’t issue shares, it usually get less coverage. That’s the link. It’s as if miners are paying commissions for coverage.

TGR: Is there a herd mentality at work?

CL: As they say, when everybody’s buying, you should consider selling. When gold reached its peak in 2011, everyone thought the price would go up forever.

TGR: Do you think tax-loss selling will depress mining equities even further?

CL: A little, especially for the small caps.

TGR: Could this bottom lead to a rally?

CL: It’s possible. Some of the better gold companies are quite cheap. Unfortunately, they are not buy-and-hold candidates because if this market climate continues, it will be very difficult for them to raise money. And when companies raise money in this market, existing shareholders get taken to the cleaners.

TGR: What are the fundamentals mining companies need to possess in order to prosper in volatile metals markets?

CL: A prudent management that can execute and deliver. A property that can produce at low cost, can withstand gold’s volatility and can generate free cash flow, even at $1,000/oz gold.

It’s not just about cheap ounces. It’s about seeing a balance sheet that increases every quarter. Companies like that can expand their operations and buy neighboring properties now at very depressed prices. Companies like that will make a lot of money in the long run.


TGR: Name a company that demonstrates these fundamentals.


CL: One company I like a lot is OceanaGold Corp. (OGC:TSX; OGC:ASX). Its management has been very prudent and owns a lot of shares. The company has done everything possible to avoid dilution. Its stock is now at $1.80/share. It raised its last private placement at $3/share. The one before that was at $4/share. And OceanaGold hasn’t wasted its money on foolish acquisitions.


TGR: Oceana’s Didipio gold-copper mine in the Philippines began commercial production in April. How do you rate that project?


CL: Didipio is a very, very low-cost producer. Because of the copper credits, the cost of gold is actually negative. The ramp up has been very smooth—one of the best I’ve seen. OceanaGold is generating a lot of cash flow, paying off its debt and talking about a dividend next year.


Interestingly, Oceana also hedged gold earlier this year. In this manner, management was able to strengthen its balance sheet by locking in gold prices at much higher levels than today’s price.


TGR: OceanaGold has made an acquisition: Pacific Rim Mining Corp. and its El Dorado gold project in El Salvador. Was this a sound buy?


CL: There have been permitting problems on the property, but this is high-grade, more than 10 grams per ton (10 g/t) gold equivalent, and it can be mined very profitably. OceanaGold is generating so much cash that I expect it will make more acquisitions in the future.


TGR: Would you like to talk about other companies you are following?


CL: I follow Pretium Resources Inc. (PVG:TSX; PVG:NYSE), which has the Brucejack project in northern British Columbia. I think this project is relatively straightforward. The company already had a permit on another part of the property. That expired years ago, but we are talking about a reapplied permit situation. This is an already disturbed area—it’s not greenfields. There has been a mine in this area before. There are no fish in the nearby lake. Right now, the real controversy is the grade of the mine.


TGR: How so?


CL: There was a big dispute between two geological companies—Strathcona and Snowden—about the Valley of the Kings portion of Brucejack. Strathcona quit working for Pretium because it believes Snowden’s resource estimate was overaggressive. Of course, Snowden believes otherwise.


TGR: How did the bulk sampling turn out?


CL: Fantastic. Pretium mined 10,300 tons and produced 5,865 oz gold and 4,950 oz silver. As a result, its stock rebounded very nicely. I and some of my subscribers made good money buying those shares at a dip. In 2014, the company will do a better-defined reserve estimate and a prefeasibility study.


Eventually, I think Pretium will probably be sold to a major. Bottom line, I feel that permits should not be a problem. The deposit has very high-grade but very thin veins, and there is a dispute about how to measure this resource. Having been to the property, I take the side of Snowden and Pretium’s management.


TGR: One low-cost gold producer you have followed closely for some time is Petaquilla Minerals Ltd. (PTQ:TSX; PTQMF:OTCBB; P7Z:FSE). It has a big decision coming up, right?


CL: Petaquilla has the producing Molejon mine in Panama and the Lomero-Poyatos polymetallic mine in Spain, which is at the bulk-sampling stage. Previously, the company was talking about shipping the bulk sampling from Spain to Panama to process. That would be expensive because it’s not very efficient: across the Atlantic Ocean and from one end of the Panama Canal to the other.


The company is mining gold at $500–600/oz. At the current gold price, Petaquilla should be able to generate some cash flow and improve its balance sheet.


TGR: Molejon is adjacent to First Quantum Minerals Ltd.’s (FM:TSX; FQM:LSE) $6.2-billion Cobre Panama copper project. How does this affect Petaquilla?


CL: Petaquilla has a big contract—up to $100 million ($100M)—with First Quantum to provide aggregate mining.


TGR: Do you think there’s a possibility of Petaquilla being bought out by First Quantum?


CL: I feel there’s a real chance this could happen. After all, Inmet, which got bought out by First Quantum, tried to buy Petaquilla twice.


TGR: Which established producers show good potential at the start of 2014?


CL: I like Orvana Minerals Corp. (ORV:TSX). The company has two producing properties: the El Valle-Boinás/Carlés gold-copper mine in Spain and the Don Mario gold mine in Bolivia. Both are doing well, especially the mine in Spain, which I have visited. The company is generating good cash flow. It’s paying off the debt, so its balance sheet is improving. It gets better quarter by quarter.


TGR: Orvana’s latest quarterly report, released Dec. 6, shows adjusted net income of $12.4M.


CL: To generate cash flow under these market conditions—that’s pretty good, I would say. And this is a cash flow story because Orvana has got two mines going—one in 2011 and one in 2012—which are running smoothly and being improved. Orvana has another property in Michigan, Copperwood, which is copper and silver. I think Orvana will either joint venture it or sell it. If it can sell it at a good price, it can further improve the balance sheet.


TGR: What other producers do you like?


CL: Alacer Gold Corp. (ASR:TSX: AQG:ASX). I’ve visited the company’s Çöpler gold mine in Turkey. It’s very low cost at $425/oz all-in. Right now, Alacer is still mining the oxide and generating a lot of cash flow.


In a few years, Alacer begins mining the sulphide. So it will need to build up its sulfide plant and so forth. When you take the current cash balance plus the cash flow it will generate from the mine life of Çöpler, this equals, if not tops, Alacer’s current market cap. So then investors get the rest of its operations basically for free. This is a quite undervalued stock.


TGR: Any other producers you’d like to comment on?


CL: I don’t own Agnico-Eagle Mines Ltd. (AEM:TSX; AEM:NYSE) or cover it in my newsletter, but I keep up with it. The company has had some fantastic results. I like the management, and I’ve been impressed by what Agnico has done in the last few years. I think the stock could be a good one in the long term.


TGR: How about the majors?


CL: I like Goldcorp Inc. (G:TSX; GG:NYSE) and Yamana Gold Inc. (YRI:TSX; AUY:NYSE; YAU:LSE): low-cost gold producers that can generate a lot of cash flow in this market. But I’m really into the juniors and not the majors.


TGR: Can we expect more junior success stories from Nevada?


CL: I own some companies there, but their performance has not been up to par in the past year or so.


TGR: Who do you like in particular?


CL: Gold Standard Ventures Corp. (GSV:TSX.V; GSV:NYSE) has a good discovery, the Railroad gold project. I was surprised the stock didn’t go up further in November, when the company announced 4.01 g/t over 13.6 meters (13.6m) and 0.86 g/t over 102.1m.


The question the market is asking companies like this is: Do you need to raise money? That’s the problem with a lot of juniors. Gold Standard is one of the better juniors out there, but it got hit pretty hard, just like so many others.


TGR: Going back to the topic of takeovers, are you surprised we haven’t seen more, especially considering how prices for juniors and mid-caps have fallen?


CL: Most of the majors are in disarray and are not in the position to acquire properties, even though, as you say, prices are cheap. But, if the price of gold remains stable for the next year or two, I would think that many of the majors may be able to repair their balance sheets and start buying again.


When the market is bad, we hear about the problems associated with new projects: permitting, feasibility studies, etc. But in a good market, a lot of these properties would already have been bought out. It all depends on the market, and right now the market is very tough.


TGR: Could some of the juniors that have been battered in 2013 make big comebacks in 2014?


CL: To make big comebacks requires a change of market sentiment. Will the market sentiment change this year? I do not know. It’s an open question. Obviously, investors want to see their stocks come back big time. They want to make all their losses back in one year. I think investors need to be patient.


TGR: Considering a bear market of longer than 2.5 years, many investors think they’ve been more than patient already.


CL: But only time will cure a lot of the mistakes that have been committed in this market. When you have companies that keep their heads down, generate cash flow and continually improve their balance sheets—that’s what will ensure big winners when the market sentiment changes.


As I said before, companies like these are in the position to acquire good properties on the cheap. OceanaGold is one of these companies. It has tremendous cash flow coming. Orvana is also in this position. I’ve talked to its new CEO, Michael Winship, and I know the company is looking to acquire new properties.


Companies like Oceana and Orvana are positioning themselves to be the big winners when the next cycle begins.


TGR: Did you personally take a big hit this year?


CL: I’ve taken a lot of hits in the gold miners. In gold bullion, I bought in the summer when the price was low. Then, when it hit $1,400/oz, I told my subscribers I was selling. That was a very nice trade. Also, I got Pretium when it was down to $3/share. I sold out on the bounce and made good money.


In general, I’ve been fortunate because I’ve been trading my position, and I’ve been underweighting gold since 2011 because I saw some subtle problems with the gold mining industry in general.


TGR: What have you learned this year?


CL: I’ve been trying to trade more actively instead of buying and holding. I’ve held some miners that have been hit very hard. Do I look back and wish I’d sold all my shares of gold companies in 2011? Probably. But I want to keep some positions, even though it’s painful. When the market turns, I expect to be rewarded for all this pain and suffering.


TGR: Chen, thank you for your time and your insights.


Chen Lin writes the popular stock newsletter What Is Chen Buying? What Is Chen Selling?, published and distributed by Taylor Hard Money Advisors, Inc. While a doctoral candidate in aeronautical engineering at Princeton, Lin found his investment strategies were so profitable that he put his Ph.D. on the back burner. He employs a value-oriented approach and often demonstrates excellent market timing due to his exceptional technical analysis.


Want to read more Gold Report interviews like this? Sign up for our free e-newsletter, and you’ll learn when new articles have been published. To see a list of recent interviews with industry analysts and commentators, visit our Streetwise Interviews page.


DISCLOSURE:
1) Kevin Michael Grace conducted this interview for The Gold Report and provides services to The Gold Report as an independent contractor. He or his family own shares of the following companies mentioned in this interview: None.
2) The following companies mentioned in the interview are sponsors of The Gold Report: Pretium Resources Inc., Orvana Minerals Corp. and Gold Standard Ventures Corp. Goldcorp Inc. is not associated with The Gold Report. Streetwise Reports does not accept stock in exchange for its services or as sponsorship payment.
3) Chen Lin: I or my family own shares of the following companies mentioned in this interview: Alacer Gold Corp., Gold Standard Ventures Corp., OceanaGold Corp., Orvana Minerals Corp., Petaquilla Minerals Ltd. and Pretium Resources Inc. I personally am or my family is paid by the following companies mentioned in this interview: None. My company has a financial relationship with the following companies mentioned in this interview: None. I was not paid by Streetwise Reports for participating in this interview. Comments and opinions expressed are my own comments and opinions. I had the opportunity to review the interview for accuracy as of the date of the interview and am responsible for the content of the interview.
4) Interviews are edited for clarity. Streetwise Reports does not make editorial comments or change experts’ statements without their consent.
5) The interview does not constitute investment advice. Each reader is encouraged to consult with his or her individual financial professional and any action a reader takes as a result of information presented here is his or her own responsibility. By opening this page, each reader accepts and agrees to Streetwise Reports’ terms of use and full legal disclaimer.
6) From time to time, Streetwise Reports LLC and its directors, officers, employees or members of their families, as well as persons interviewed for articles and interviews on the site, may have a long or short position in securities mentioned and may make purchases and/or sales of those securities in the open market or otherwise.


Streetwise – The Gold Report is Copyright © 2014 by Streetwise Reports LLC. All rights are reserved. Streetwise Reports LLC hereby grants an unrestricted license to use or disseminate this copyrighted material (i) only in whole (and always including this disclaimer), but (ii) never in part.


Streetwise Reports LLC does not guarantee the accuracy or thoroughness of the information reported.


Streetwise Reports LLC receives a fee from companies that are listed on the home page in the In This Issue section. Their sponsor pages may be considered advertising for the purposes of 18 U.S.C. 1734.


Participating companies provide the logos used in The Gold Report. These logos are trademarks and are the property of the individual companies.


101 Second St., Suite 110
Petaluma, CA 94952

Tel.: (707) 981-8999
Fax: (707) 981-8998
Email: [email protected]


NZD/USD Forecast For January 13-17

Article by Investazor.com

The New Zealand Dollar started 2014 on positive ground in pair with the American dollar. This week’s top release is the NZIER business confidence. If you would like to find more, you will find in this article analysis on the fundamental releases and a technical view over the price action of the NZD/USD currency pair.

Last week the NZD started with the left foot, but it managed to recover on Friday after the bad labor market releases from the USA, which pushed investors to sell the US dollar and buy safer assets like the Euro, Japanese yen and the NZD.

This week’s economic calendar is low on macro releases for the NZD.

Economical Calendar

NZIER Business Confidence – Monday (21:00 GMT). Scheduled to be released in an hour, NZIER Business Confidence is a level of diffusion based on surveyed manufacturers, builders, wholesalers, retailers and service provider and it is the most important release of this week. Last month reading was of 38.

FPI – Tuesday (21:45). It is a low impact indicator which shows the change in the price of food and food services purchased by householders. Last month dropped with 0.2%.

Technical View

Chart: NZDUSD, Daily

nzdusd-daily-forecast-13-17-13.01.2014-resize

Support: 0.8235, 0.8100;

Resistance: 0.8400, 0.8543

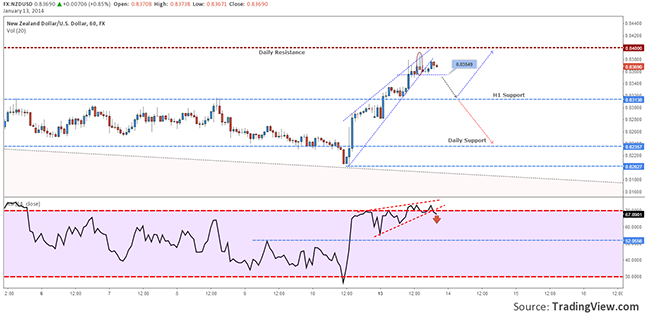
On the daily chart we can see that the price has rallied to 0.8400, which is also the next important resistance, after it broke the down trend channel and retested it. At this point bulls seem to be in control and might put some pressure on the price. A break through the next resistance could open the door for new highs and the new rally could target 0.8543.

Chart: NZDUSD, H1

nzdusd-h1-forecast-13-17-13.01.2014 - resize

Support: 0.8355, 0.8313, 0.8235, 0.8202;

Resistance: 0.8400;

On the H1 chart, the price action gives some pretty interesting bearish signals. The 14 periods RSI has drawn a rising wedge as well as the price evolution and a Shooting Star pattern has given the high of the day. Presuming that the current trend will continue, the upside move will find a good resistance from the daily chart at 0.8400 (also round number). On the other had a drop under the local support, 0.8355, could confirm the bearish signals and the price might fall back to 0.8235.

Bullish or Bearish?

On the medium term I am still bullish on the NZD. Fundamentals from the US dollar will probably trigger some high volatility and whipsaws but in my opinion 0.8400 will be touched until the end of this week. On the lower time frame I would really keep a close eye over the technical analysis and the bearish signals.

The post NZD/USD Forecast For January 13-17 appeared first on investazor.com.

USD/JPY Forecast For January 13-17

Article by Investazor.com

Last week the USDJPY currency pair posted a small loss, even though in the first part of the week the dollar had more buyers. Here is a wrap up of what happened and this week’s forecast on macro and technical analysis.

The Japanese Yen lost some ground in the beginning of last week, in front of the US dollar mainly because of the good economic releases from the United States. Thursday the yen started to be bought right after the ECB press conference. It gained some speed in its recovery on Friday after the Non-Farm Payroll release but it didn’t stop there because today the price of the USD/JPY currency pair dropped even more, touching a low at 102.85.

Next you will find several economic releases that might influence the USDJPY in the current week:

Current Account – Monday (23:50 GMT). Last month it dropped by 0.06T even though it was expected to rise with 0.12T. This month Japan’s Current Account it is expected to drop again with 0.02T.

Economy Watchers Sentiment – Tuesday (05:00 GMT). Readings above 50 mean that watchers are optimists in what concerns the economy’s evolution. For the past three publications the values were above expectations. Tomorrow economists are forecasting a value of 54.2 for this indicator.

Core Machine Orders m/m – Wednesday (23.50 GMT). This indicator is referring to changes in the total value of new private-sector purchase orders placed with manufacturers for machines, excluding ships and utilities. Last month’s publication was of 0.6% growth and the current expectations are of a 1.2 percent rise.

Tertiary Industry Activity – Wednesday (23:50 GMT). After a 0.7% drop in the December’s publication, this week it is forecast at 0.8% rise.

Consumer Confidence – Friday (05:00 GMT). For this indicator a high of the past 6 months was hit in October at 45.4. This week’s estimations are of a 43.4.

Economical Calendar

Current Account – Monday (23:50 GMT). Last month it dropped by 0.06T even though it was expected to rise with 0.12T. This month Japan’s Current Account it is expected to drop again with 0.02T.

Economy Watchers Sentiment – Tuesday (05:00 GMT). Readings above 50 mean that watchers are optimists in what concerns the economy’s evolution. For the past three publications the values were above expectations. Tomorrow economists are forecasting a value of 54.2 for this indicator.

Core Machine Orders m/m – Wednesday (23.50 GMT). This indicator is referring to changes in the total value of new private-sector purchase orders placed with manufacturers for machines, excluding ships and utilities. Last month’s publication was of 0.6% growth and the current expectations are of a 1.2 percent rise.

Tertiary Industry Activity – Wednesday (23:50 GMT). After a 0.7% drop in the December’s publication, this week it is forecast at 0.8% rise.

Consumer Confidence – Friday (05:00 GMT). For this indicator a high of the past 6 months was hit in October at 45.4. This week’s estimations are of a 43.4.

Technical View

Chart: USDJPY Daily

usdjpy-daily-forecast-week13-17-13.01.2014 resize

Support: 102.00, 101.00;

Resistance: 103.82, 105.41;

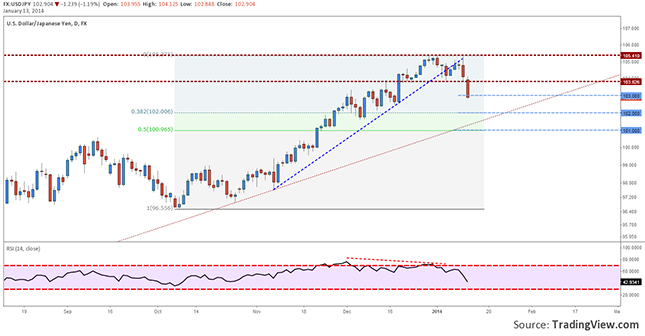
On the daily chart we can see that the uptrend line was broken after the RSI signaled a negative divergence. Friday and today were pretty good days for the Japanese yen which has fallen from a high of 105.33 all the way to 102.85. If the current day will close under 103.00 the probability for the price to continue the fall will be quite big. Next downside targets could be 102.00 and 101.00.

Chart: USDJPY H1

usdjpy-h1-forecast-week13-17-13.01.2014 - resize

Support: 102.00;

Resistance: 103.80

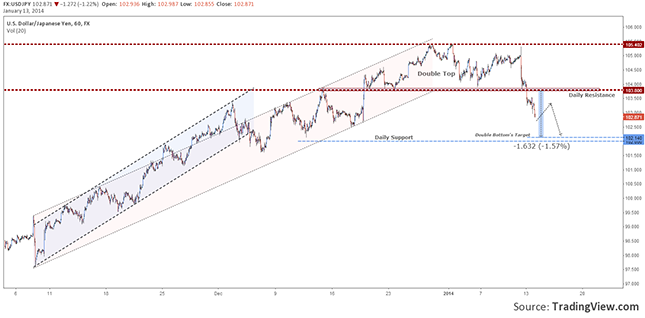
After the price confirmed the Double Top pattern by a breakout under 103.80, it continued the downside move all the way to 102.85 low, hit today. The price pattern’s target it is found at 102.14, really close to the daily support from 102.00 (which is actually the 38.2 Fibonacci retrace from the entire uptrend.) A recovery of the US dollar can find a good resistance area around the daily resistance at 103.80.

Bullish or Bearish?

I believe that the Japanese yen will continue its rally in front of the US dollar during this week time. But I would be very attentive to a throwback that could aim to retest 103.80, which was a pretty support level. This last one mentioned could be a good selling level (in case of a retrace) if other bearish signals appear.


The post USD/JPY Forecast For January 13-17 appeared first on investazor.com.

Why Macy’s Is Such a “Good” Retail Play

By George Leong, B. Comm.

In the retail sector, it’s all about vision and execution. The reality is it’s all in the details, especially in the department store sector, where it’s all about product offerings and marketing.

Of the department stores in the retail sector, Macy’s, Inc. (NYSE/M) is probably the best-managed and best-performing company. Simply take a look at rival J. C. Penney Company, Inc. (NYSE/JCP), and you’ll understand why it has been a lot better for Macy’s investors than J. C. Penney’s. (Read more of my thoughts on this in “J. C. Penney, Coach Joining the Losers in the Retail Sector?”)

While Macy’s continues to look for ways to continue its sales growth and profitability, J. C. Penney is just trying to stay afloat in the retail sector and avoid a possible bankruptcy down the road.

The chart below shows the divergence in share price between Macy’s and J. C. Penney since October 2012. Macy’s has steadily climbed, as reflected by the red candlesticks, compared to J. C. Penney, as shown by the dark green line, based on my technical analysis.

            Chart courtesy of www.StockCharts.com


It’s amazing how the wrong strategy could backfire in the retail sector and cost a company like J. C. Penney billions of dollars, while rewarding a company like Macy’s for excellent execution.

Macy’s announced it would cut about 2,500 workers, which is a small fraction of its total headcount of about 175,000. The company will also look at other cost cuts that could shave about $100 million off the expense side beginning this year. (Source: “Macy’s, Inc. Outlines Cost Reduction Initiatives to Support Continued Profitable Sales Growth,” Yahoo! Finance, January 9, 2014.)

While J. C. Penney is showing some encouraging metrics, the likelihood of the company to turn around its sinking ship and try to catch up with the likes of Macy’s is a long shot at best.

The retail sector is ruthless. One wrong move and it could leave you with years of declines and a difficult path to retrace.

In the department store sector, I would stick with Macy’s.

The current difficulty in the retail sector is made even clearer when Family Dollar Stores, Inc. (NYSE/FDO), one of my favorite discount stocks, fails to deliver. When this seller of cheap merchandise is struggling, you really have to take a step back and wonder about the overall retail sector.

In the case of Family Dollar Stores, not only did the company fall short on earnings, but it also made a downward revision of its fiscal second-quarter earnings guidance to below the consensus estimate. The discounter also lowered its sales and earnings guidance for fiscal 2014 to below guidance. Revenue growth was a mere 3.2%, while the key same-store sales fell 2.8%.

The key over the next few months will be to monitor the retail sector and see which companies can deliver like Macy’s does in a tough economic climate.

This article Why Macy’s Is Such a “Good” Retail Play was originally posted at Profit Confidential


Future Looks Bright for This Little-Known Niche Market

By Mitchell Clark, B. Comm.

Acuity Brands, Inc. (AYI) manufactures lighting, and business is really good. The Atlanta-based company just reported an excellent quarter and the stock blasted higher after handily beating consensus on earnings and revenues.

The stock has been a powerhouse, up five-fold since its 2009 low, and has been especially strong over the last 12 months, like so many other positions.

Acuity Brands provides all kinds of indoor and outdoor lighting and its products are sold all over the world. Any application you can name, this company likely makes a light for it. The company’s products are mostly for industrial/commercial use in offices and buildings, but the company also produces lighting for sports facilities, underwater applications, garages, emergency exits, decorative and landscape applications, and parking lots, along with some residential lighting.

Then there are all the controls and components required to make the lighting work. Acuity Brands manufactures these as well.

In its fiscal first quarter of 2014 (ended November 31, 2013), the company said it achieved all-time records in first-quarter sales, earnings, and diluted earnings per share.

Total sales for the quarter came to $574.7 million, representing a solid 20% gain over the first quarter of 2013.

Earnings were $44.5 million, representing a substantial 70% gain over the comparable quarter (including a $5.0 million insurance recovery gain).

Acuity Brands finished its fiscal first quarter with cash and cash equivalents of $398 million, for a gain of $39.0 million over the previous quarter. Management said it expects demand for its lighting products to improve and become more broad-based. The renovation and tenant (improvement) markets are expected to be growth areas.

On the stock market, Acuity Brands jumped 15% on the day of its earnings report. The company’s one-year stock chart is featured below:

            Chart courtesy of www.StockCharts.com


The fact that this position is richly priced did not deter investors from bidding the stock after its latest earnings on a down day for the broader market. The company surpassed Wall Street’s expectations by a wide margin and once again demonstrated just how good a business it is. (Read about another stock that’s excelling in its business in “Why This Company Should Be a Case Study in Business Schools.”)

I view Acuity Brands’ results as a positive economic indicator and I give credit to the company for filing its SEC form 10-Q commensurate with its earnings press release.

With the exception of a one-percent unfavorable impact to sales due to currency translation, all of the company’s increased sales during the latest quarter were due to stronger volume. The company cited North American sales were increasing especially significantly. LED-based lighting, which represented just over one-quarter of the company’s total first-quarter sales, saw sales more than double comparatively.

Management estimates that the North American lighting market, which is helped by new construction, renovation, and retrofitting, should grow by the mid-single digits in fiscal 2014. Wall Street currently expects the company’s fiscal 2014 total sales to grow approximately 10% and nine percent in fiscal 2013.

I suspect the Street’s revenue and earnings estimates for Acuity Brands’ future periods will creep higher over the coming weeks. The company’s fiscal first quarter was very solid.

Other than monetary policy, the most important data for equity investors is what corporations say about their businesses. For industrial lighting, business conditions are improving.


This article Future Looks Bright for This Little-Known Niche Market was originally published at Profit Confidential

Thoughts from the Frontline: Forecast 2014: The Killer D’s

By John Mauldin – Thoughts from the Frontline: Forecast 2014: The Killer D’s

It seems I’m in a constant dialogue about the markets and the economy everywhere I go. Comes with the territory. Everyone wants to have some idea of what the future holds and how they can shape their own personal version of the future within the Big Picture. This weekly letter is a large part of that dialogue, and it’s one that I get to share directly with you. Last week we started a conversation looking at what I think is the most positive and dynamic aspect of our collective future: The Human Transformation Revolution. By that term I mean the age of accelerating change in all manner of technologies and services that is unfolding before us. It is truly exhilarating to contemplate. Combine that revolution with the growing demand for a middle-class lifestyle in the emerging world, and you get a powerful engine for growth. In a simpler world we could just focus on those positives and ignore the fumbling of governments and central banks. Alas, the world is too complex for that.

We’ll continue our three-part 2014 forecast series this week by looking at the significant economic macrotrends that have to be understood, as always, as the context for any short-term forecast. These are the forces that are going to inexorably shift and shape our portfolios and businesses. Each of the nine macrotrends I’ll mention deserves its own book (and I’ve written books about two of them and numerous letters on most of them), but we’ll pause to gaze briefly at each as we scan the horizon.

The Killer D’s

The first five of our nine macro-forces can be called the Killer D’s: Demographics, Deficit, Debt, Deleveraging, and Deflation. And while I will talk about them separately, I am really talking threads that are part of a tapestry. At times it will be difficult to say where one thread ends and the others begin.

Demographics – An Upside Down World

One of the most basic human drives is the desire to live longer. And there is a school of economics that points out that increased human lifespans is one of the most basic and positive outcomes of economic growth. I occasionally get into an intense conversation in which someone decries the costs of the older generation refusing to shuffle off this mortal coil. Typically, this discussion ensues after I have commented that we are all going to live much longer lives than we once expected due to the biotechnological revolution. Their protests sometimes make me smile and suggest that if they are really worried about the situation, they can volunteer to die early. So far I haven’t had any takers.

Most people would agree that growth of the economy is good. It is the driver of our financial returns. But older people spend less money and produce far less than younger, more active generations do. Until recently this dynamic has not been a problem, because there were far more young people in the world than there were old. But the balance has been shifting for the last few decades, especially in Japan and Europe.

An aging population is almost by definition deflationary. We can see the results in Japan. An aging, conservative population spends less. An interesting story in the European Wall Street Journal this week discusses the significant amount of cash that aging Japanese horde. In Japan there is almost three times as much cash in circulation, per person, as there is in the US. Though Japan is a country where you can buy a soft drink by swiping your cell phone over a vending machine data pad, the amount of cash in circulation is rising every year, and there are actually proposals to tax cash so as to force it back into circulation.

A skeptic might note that 38% of Japanese transactions are in cash and as such might be difficult to tax. But I’m sure that Japanese businesses report all of their cash income and pay their full share of taxes, unlike their American and European counterparts.

Sidebar: It is sometimes difficult for those of us in the West to understand Japanese culture. This was made glaringly obvious to me recently when I watched the movie 47 Ronin. In the West we may think of Sparta or the Alamo when we think of legends involving heroic sacrifice. The Japanese think of the 47 Ronin. From Wikipedia:

The revenge of the Forty-seven Ronin (四十七士 Shi-jū-shichi-shi, forty-seven samurai) took place in Japan at the start of the 18th century. One noted Japanese scholar described the tale, the most famous example of the samurai code of honor, bushidō, as the country’s “national legend.”

The story tells of a group of samurai who were left leaderless (becoming ronin) after their daimyo (feudal lord) Asano Naganori was compelled to commit seppuku (ritual suicide) for assaulting a court official named Kira Yoshinaka, whose title was Kōzuke no suke. The ronin avenged their master’s honor by killing Kira, after waiting and planning for almost two years. In turn, the ronin were themselves obliged to commit seppuku for committing the crime of murder. With much embellishment, this true story was popularized in Japanese culture as emblematic of the loyalty, sacrifice, persistence, and honor that people should preserve in their daily lives. The popularity of the tale grew during the Meiji era of Japanese history, in which Japan underwent rapid modernization, and the legend became subsumed within discourses of national heritage and identity.

The point of my sidebar (aside from talking about cool guys with swords) is that, while Japan may be tottering, the strong social fabric of the country, woven from qualities like loyalty, sacrifice, and diligence, should keep us from being too quick to write Japan off.

“Old Europe” is not far behind Japan when it comes to demographic challenges, and the United States sees its population growing only because of immigration. Russia’s population figures do not bode well for a country that wants to view itself as a superpower. Even Iran is no longer producing children at replacement rates. At 1.2 children per woman, Korea’s birth rates are even lower than Japan’s. Indeed, they are the lowest in the World Bank database.

A basic equation says that growth of GDP is equal to the rate of productivity growth times the rate of population growth. When you break it down, it is really the working-age population that matters. If one part of the equation, the size of the working-age population, is flat or falling, productivity must rise even faster to offset it. Frankly, developed nations are simply not seeing the rise in productivity that is needed.

As a practical matter, when you are evaluating a business as a potential investment, you need to understand whether its success is tied to the growth rate of the economy and the population it serves.

In our book Endgame Jonathan Tepper and I went to great lengths to describe the coming crisis in sovereign debt, especially in Europe – which shortly began to play itself out. In the most simple terms, there can come a point when a sovereign government runs up against its ability to borrow money at reasonable rates. That point is different for every country. When a country reaches the Bang! moment, the market simply starts demanding higher rates, which sooner or later become unsustainable. Right up until the fateful moment, everyone says there is no problem and that the government in question will be able to control the situation.

If you or I have a debt issue, the solution is very simple: balance our family budget. But it is manifestly more difficult, politically and otherwise, for a major developed country to balance its budget than it is for your average household to do so. There are no easy answers. Cutting spending is a short-term drag on the economy and is unpopular with those who lose their government funding. Raising taxes is both a short-term and a long-term drag on the economy.

The best way to get out of debt is to simply hold spending nominally flat and eventually grow your way out of the deficit, as the United States did in the 1990s. Who knew that 15 years later we would be nostalgic for Clinton and Gingrich? But governments almost never take that course, and eventually there is a crisis. As we will see in a moment, Japan elected to deal with its deficit and debt issues by monetizing the debt. Meanwhile, in Europe, the ECB had to step in to save Italy and Spain; Greece, Ireland, and Portugal were forced into serious austerities; and Cyprus was just plain kicked over the side of the boat.

There is currently a lull in the level of concern about government debt, but given that most developed countries have not yet gotten their houses in order, this is a temporary condition. Debt will rear its ugly head again in the not-too-distant future. This year? Next year? 2016? Always we pray the prayer of St. Augustine: “Lord, make me chaste, but not today.”

Deleveraging and Deflation – They Are Just No Fun

At some point, when you have accumulated too much debt, you just have to deal with it. My associate Worth Wray forwarded the following chart to me today. There is no better explanation as to why the current recovery is the weakest in recent history. Deleveraging is a b*tch. It is absolutely no fun. Looking at this chart, I find it rather remarkable and somewhat encouraging that the US has done as well as it has the past few years.

As I’ve outlined at length in other letters and in Code Red, central banks can print far more money than any of us can imagine during periods of deleveraging and deflation. For the record, I said the same thing back in 2010 when certain hysterical types were predicting hyperinflation and the end of the dollar due to the quantitative easing of the Federal Reserve. I remain actively opposed to the current level of quantitative easing, not because I’m worried about hyperinflation but for other reasons I have discussed in past letters. As long as the velocity of money keeps falling, central banks will be able to print more money than we would have thought possible in the ’70s or ’80s. And seemingly they can get away with it – in the short term. Of course, payback is a b*tch. When the velocity of money begins to rise again for whatever unknown reason, central banks had better have their ducks in a row!

Deflationary conditions make debt worse. If you borrow money at a fixed rate, a little inflation – or even a lot of inflation – helps a great deal. To think that even conservative Republican leaders don’t get that is naïve. Certainly it is understood in Japan, which is why the success of Abenomics is dependent upon producing inflation. More on that below.

For governments, there is more than one way to deleverage. You can default on your payments, like Greece. We’re going to see a lot more of that in the next five years – count on it. Or you can get your central bank to monetize the debt, as Japan is doing. Or get the central bank to convert your debt into 40-year bonds, as Ireland did. (Brilliant move, by the way, for tiny Ireland – you have to stand back and applaud the audacity. I wonder how much good Irish whiskey it took to get the ECB to agree to that deal?)

Inflation is falling almost everywhere today, even as central banks are as accommodative as they have ever been. Deflation is the default condition in a deleveraging world. It can even create an economic singularity.

Singularity was originally just a mathematical term for a point at which an equation has no solution. Then, in astrophysics, it was proven that a large-enough collapsing star would become a black hole so dense that its own gravity would cause a singularity in the fabric of space-time, a point where many standard physics equations suddenly have no solution.

Beyond the “event horizon” of the black hole, the physics models no longer work. In terms of general relativity, an event horizon is a boundary in space-time beyond which events cannot affect an outside observer. In a black hole it is “the point of no return,” i.e., the point at which the gravitational force becomes so large that nothing can escape.

Deflation and collapsing debt can create their own sort of black hole, an economic singularity. At that point, the economic models that we have grown comfortable with no longer work. As we approach a potential event horizon in a deflationary/deleveraging world, it can be a meaningless (and extremely frustrating) exercise to try to picture a future that is a simple extension of past economic reality. Any short-term forecast (less than one or two years) has to bear that fact in mind.

We Are in a Code Red World

We need to understand that there has been a complete bureaucratic and academic capture of central banks. They are all run by neo-Keynesians. (Yes, I know there are some central bankers who disavow the prevailing paradigm, but they don’t have the votes.) The default response of any present-day central banker faced with a crisis will be massive liquidity injections. We can argue with the tide, but we need to recognize that it is coming in.

When there is a recession and interest rates are at or close to the zero bound, there will be massive quantitative easing and other, even more creative injections of liquidity into the system. That is a reality we have learned to count on and to factor into our projections of future economic possibilities. But as to what set of econometric equations we should employ in coming up with accurate, dependable projections, no one, least of all central bankers, has a clue. We are in unknown territory, on an economic Star Trek, with Captain Bernanke about to turn the helm over to Captain Yellen, going where no reserve-currency-printing central bank has gone before. This is not Argentina or Zimbabwe we are talking about. The Federal Reserve is setting its course based on economic theories created by people whose models are demonstrably terrible.

Will we have an outright recession in the US this year? I currently think that is unlikely unless there is some kind of external shock. But short-term interest rates will stay artificially low due to financial repression by the Fed, and there will be an increased risk of further monetary creativity from a Yellen-led Fed going forward. Stay tuned.

To continue reading this article from Thoughts from the Frontline – a free weekly publication by John Mauldin, renowned financial expert, best-selling author, and Chairman of Mauldin Economics – please click here.

© 2013 Mauldin Economics. All Rights Reserved.
Thoughts from the Frontline is a free weekly economic e-letter by best-selling author and renowned financial expert, John Mauldin. You can learn more and get your free subscription by visiting www.MauldinEconomics.com.

Please write to [email protected] to inform us of any reproductions, including when and where copy will be reproduced. You must keep the letter intact, from introduction to disclaimers. If you would like to quote brief portions only, please reference www.MauldinEconomics.com.

To subscribe to John Mauldin’s e-letter, please click here: www.mauldineconomics.com/subscribe
To change your email address, please click here: http://www.mauldineconomics.com/change-address

Thoughts From the Frontline and MauldinEconomics.com is not an offering for any investment. It represents only the opinions of John Mauldin and those that he interviews. Any views expressed are provided for information purposes only and should not be construed in any way as an offer, an endorsement, or inducement to invest and is not in any way a testimony of, or associated with, Mauldin’s other firms. John Mauldin is the Chairman of Mauldin Economics, LLC. He also is the President and registered representative of Millennium Wave Advisors, LLC (MWA) which is an investment advisory firm registered with multiple states, President and registered representative of Millennium Wave Securities, LLC, (MWS) member FINRA and SIPC, through which securities may be offered. MWS is also a Commodity Pool Operator (CPO) and a Commodity Trading Advisor (CTA) registered with the CFTC, as well as an Introducing Broker (IB) and NFA Member. Millennium Wave Investments is a dba of MWA LLC and MWS LLC. This message may contain information that is confidential or privileged and is intended only for the individual or entity named above and does not constitute an offer for or advice about any alternative investment product. Such advice can only be made when accompanied by a prospectus or similar offering document. Past performance is not indicative of future performance. Please make sure to review important disclosures at the end of each article. Mauldin companies may have a marketing relationship with products and services mentioned in this letter for a fee.

Note: Joining The Mauldin Circle is not an offering for any investment. It represents only the opinions of John Mauldin and Millennium Wave Investments. It is intended solely for investors who have registered with Millennium Wave Investments and its partners at http://www.MauldinCircle.com (formerly AccreditedInvestor.ws) or directly related websites. The Mauldin Circle may send out material that is provided on a confidential basis, and subscribers to the Mauldin Circle are not to send this letter to anyone other than their professional investment counselors. Investors should discuss any investment with their personal investment counsel. John Mauldin is the President of Millennium Wave Advisors, LLC (MWA), which is an investment advisory firm registered with multiple states. John Mauldin is a registered representative of Millennium Wave Securities, LLC, (MWS), an FINRA registered broker-dealer. MWS is also a Commodity Pool Operator (CPO) and a Commodity Trading Advisor (CTA) registered with the CFTC, as well as an Introducing Broker (IB). Millennium Wave Investments is a dba of MWA LLC and MWS LLC. Millennium Wave Investments cooperates in the consulting on and marketing of private and non-private investment offerings with other independent firms such as Altegris Investments; Capital Management Group; Absolute Return Partners, LLP; Fynn Capital; Nicola Wealth Management; and Plexus Asset Management. Investment offerings recommended by Mauldin may pay a portion of their fees to these independent firms, who will share 1/3 of those fees with MWS and thus with Mauldin. Any views expressed herein are provided for information purposes only and should not be construed in any way as an offer, an endorsement, or inducement to invest with any CTA, fund, or program mentioned here or elsewhere. Before seeking any advisor’s services or making an investment in a fund, investors must read and examine thoroughly the respective disclosure document or offering memorandum. Since these firms and Mauldin receive fees from the funds they recommend/market, they only recommend/market products with which they have been able to negotiate fee arrangements.

PAST RESULTS ARE NOT INDICATIVE OF FUTURE RESULTS. THERE IS RISK OF LOSS AS WELL AS THE OPPORTUNITY FOR GAIN WHEN INVESTING IN MANAGED FUNDS. WHEN CONSIDERING ALTERNATIVE INVESTMENTS, INCLUDING HEDGE FUNDS, YOU SHOULD CONSIDER VARIOUS RISKS INCLUDING THE FACT THAT SOME PRODUCTS: OFTEN ENGAGE IN LEVERAGING AND OTHER SPECULATIVE INVESTMENT PRACTICES THAT MAY INCREASE THE RISK OF INVESTMENT LOSS, CAN BE ILLIQUID, ARE NOT REQUIRED TO PROVIDE PERIODIC PRICING OR VALUATION INFORMATION TO INVESTORS, MAY INVOLVE COMPLEX TAX STRUCTURES AND DELAYS IN DISTRIBUTING IMPORTANT TAX INFORMATION, ARE NOT SUBJECT TO THE SAME REGULATORY REQUIREMENTS AS MUTUAL FUNDS, OFTEN CHARGE HIGH FEES, AND IN MANY CASES THE UNDERLYING INVESTMENTS ARE NOT TRANSPARENT AND ARE KNOWN ONLY TO THE INVESTMENT MANAGER. Alternative investment performance can be volatile. An investor could lose all or a substantial amount of his or her investment. Often, alternative investment fund and account managers have total trading authority over their funds or accounts; the use of a single advisor applying generally similar trading programs could mean lack of diversification and, consequently, higher risk. There is often no secondary market for an investor’s interest in alternative investments, and none is expected to develop. You are advised to discuss with your financial advisers your investment options and whether any investment is suitable for your specific needs prior to making any investments.

All material presented herein is believed to be reliable but we cannot attest to its accuracy. Opinions expressed in these reports may change without prior notice. John Mauldin and/or the staffs may or may not have investments in any funds cited above as well as economic interest. John Mauldin can be reached at 800-829-7273.


Pathetic December Job Numbers Proof 2014 to Be Challenging Year

By Michael Lombardi, MBA

What happened?

The Bureau of Labor Statistics (BLS) reported this morning that only 74,000 jobs were added to the U.S. economy in December. Most economists were expecting 200,000 jobs to be created in December—way off reality. The December increase in U.S. payrolls was the slowest pace in almost three years.

But it gets worse…

The underemployment rate, which I consider the “real” measure of the jobs market in the U.S. economy, was unchanged in December at 13.1%. The underemployment rate includes those people who have given up looking for work and those people who have part-time jobs but want full-time jobs.

The table below shows the official unemployment rate versus the underemployment rate for 2013.

U.S. Official Unemployment Rate vs. Underemployment Rate, January-December 2013

Month

Revised Official Unemployment Rate (U3)

Underemployment Rate (U6)

January

7.90%

14.40%

February

7.70%

14.30%

March

7.50%

13.80%

April

7.50%

13.90%

May

7.50%

13.80%

June

7.50%

14.30%

July

7.30%

14.00%

August

7.20%

13.60%

September

7.20%

13.60%

October

7.20%

13.70%

November

7.00%

13.10%

December

6.70%

13.10%

% Change
Jan.-Dec.

-15.19%

-9.03%

Data source: Federal Reserve Bank of St. Louis web site,
last accessed January 10, 2014.

What the above chart shows is that despite what we heard about the U.S. economy improving in 2013 and despite the Federal Reserve creating over $1.0 trillion in new money in 2013 to help the economy, the “real” unemployment rate declined by less than 10% in 2013, from 14.4% at the beginning of the year to 13.1% by the end of the year. The number of unemployed people in the U.S. stands at a still-staggering 10.4 million.

Of the 74,000 new jobs created in December in the U.S. economy, 55,000 jobs were in the low-paying retail trade. Despite what they tell us about the housing market rebound, construction jobs in the U.S. economy declined by 16,000 in December.

I have been warning my readers with the same message for months: I’m very suspicious of this economic recovery. If we take out the rising stock market, there would be no recovery for the U.S. economy. The Federal Reserve has kept interest rates artificially low for five years and printed trillions of dollars in new money, and the U.S. economy is still on life support. 2014 will be a very difficult year for the economy and the stock market.

This article Pathetic December Job Numbers Proof 2014 to Be Challenging Year was originally posted at Profit Confidential