Why Fed’s Change of Plans Doesn’t Mean a Change in the Stock Market

By for Daily Gains Letter | Dec 20, 2013

Change in the Stock MarketIs it an early Christmas present or a really early April Fools’ Day trick?

In a somewhat surprise move, the Federal Reserve decided the U.S. economy was doing well enough that it could start to cut back on its generous $85.0-billion-per-month quantitative easing (QE) strategy.

I say “surprise” because the Federal Reserve initially said it wouldn’t consider tapering until the U.S. economy was on solid, sustainable economic ground, which meant an unemployment rate of 6.5% and inflation of 2.5%. Today, unemployment sits at seven percent and inflation is near historic lows at below one percent.

Against a weak economic backdrop, the Federal Reserve made a brave and daring decision to slash its monthly QE policy by a paltry $10.0 billion. That means that instead of pumping more than $1.0 trillion into the U.S. economy next year, it is only going to inject $900 billion. In other words, the U.S. national debt is going to increase by $900 billion. (Source: Press release, Board of Governors of the Federal Reserve System web site, December 18, 2013.)

If the U.S. economy really was on solid footing, Fed Chairman Ben Bernanke would have made a bigger dent in his monthly bond-buying program. Instead, he made a token gesture as he gets ready to hand the baton to Janet Yellen early next year.

Yup, after injecting $4.0 trillion into the U.S. economy, the country is little (or no) better off than it was before the Fed initiated quantitative easing. U.S. unemployment is down from its Great Recession high of 10% in October 2009, but it has yet to break the seven-percent level. Meanwhile, the underemployment rate has hovered around 14% since 2009.

Interestingly, the Federal Reserve cited stronger jobs growth as a reason for its decision to start to reverse its bond-buying program. Going forward, the Federal Reserve said that U.S. jobs numbers will improve faster than expected—though only marginally. The Fed forecasts unemployment of 6.3% in 2014, up from its previous forecast of 6.4%. (Source: “Economic Projections of Federal Reserve Board Members and Federal Reserve Bank Presidents, December 2013,” Board of Governors of the Federal Reserve System web site, December 18, 2013.)

That said, the Fed’s mostly symbolic tapering is the beginning of the end for quantitative easing. But it’s not like there won’t be an abundance of cheap money to be had. The Federal Reserve tempered anxious investors by suggesting its key federal funds rate would stay lower than previously expected.

But for how long? It depends on whether or not the Federal Reserve’s unemployment rate target is hit. For now, Ben Bernanke said the Fed will keep the federal funds rate at 0.25% until unemployment gets down to 6.5% or “beyond”—which could mean even lower.

What does that mean for investors? It means that investors should continue investing the way they have been.

Why?

The Federal Reserve has kept interest rates near zero since late 2008 and has signaled it won’t raise its federal funds rate until unemployment hits, at the very least, 6.5%—a mark that, according to the Fed’s own projections, won’t be reached until late 2014 at the earliest, probably even into mid-2015.

That means plenty of cheap money will be fuelling the stock market for at least another year or so. And that points to another year of record-highs for the S&P 500 and Dow Jones Industrial Average.


Source: http://www.dailygainsletter.com/economy/why-feds-change-of-plans-doesnt-mean-a-change-in-the-stock-market/2264/


In Review: 2013 and the Game Plan for Investors in 2014

By for Daily Gains Letter

Investors in 2014

We are reaching the end of the year, and it has really been one stellar year for the key stock indices. The S&P 500 is up roughly 25%. Other key stock indices, like the Dow Jones Industrial Average and the NASDAQ Composite index, have shown very similar returns.


Just look at the chart of the S&P 500 below:

S&P 500 Large Cap Index Chart

Chart courtesy of www.StockCharts.com

The chart shows nothing but a solid uptrend—the S&P 500 continues to make higher lows and higher highs. It seems the momentum is towards buying.

But looking at how 2013 progressed, as the key stock indices continued to march higher, a few disturbing phenomena took place.

First, sales of companies on key stock indices aren’t really meeting expectations. For example, in the third quarter, only 52% of the S&P 500 companies were able to beat their revenue expectation, while 73% of them were able to beat their corporate earnings estimates. (Source: “Earnings Insight,” FactSet, December 6, 2013.)

Second, companies on key stock indices have logged a record high for share buyback activity. In fact, in 2013 so far, share buybacks have amounted to $460 billion—this is the highest amount since 2007. (Source: Jaisinghani, S. and Raghavan, M., “3M sets year’s biggest U.S. buyback plan, raises dividend,” Reuters, December 17, 2013.) At the very core, share buybacks are a kind of “financial engineering.” Through buybacks, companies on the key stock indices can make their corporate earnings per share look better without having to increase their overall earnings.

Last but not least, 2013 wasn’t all that great when it comes to economic growth in the U.S. economy. The unemployment rate remained high; it has declined a bit from what it was earlier in the year, but mainly with the help of low-wage-paying jobs. The number of people using food stamps in the U.S. economy has skyrocketed—if they were a nation, it would be similar to the size of Spain. The key stock indices rely on economic growth; if there’s no economic growth, then the stock market can’t really go much farther.

Dear reader, for the rest of 2013, I don’t expect anything major to happen. The last few trading days of the year are usually very calm on the key stock indices. The volume is low, and from my experience, there are usually no wild swings on the markets during this time.

This affords investors a perfect opportunity to take a look at their portfolios. If your portfolio has done well compared to the key stock indices, plan on what you want to do next in the midst of all the risks that are building up. On the other hand, if your portfolio hasn’t done much of anything compared to the key stock indices, consider getting rid of some positions. Remember; if you are keeping a losing position, you are missing out on future opportunities.


Source: http://www.dailygainsletter.com/wealth-creation-2/in-review-2013-and-the-game-plan-for-investors-in-2014/2274/


Why I Like This Global Brand Stock So Much

By Mitchell Clark, B.Comm.

You have to be careful with corporate earnings reporting, as well as financial headlines. So much of it can be misleading and incorrect in terms of conveying what business conditions are really like for a company.

And comparable numbers, especially, can give the illusion of financial growth, even though they may actually still be a decline from previous periods. We saw a lot of this in 2010 and 2011, when earnings results looked like they were growing, but for many corporations, the numbers were worse than in 2007/2008.

However, one company that consistently does an excellent job at generating real growth is NIKE, Inc. (NKE). It’s actually quite amazing that such a mature brand can keep growing like NIKE does. Clearly, the business of selling sneakers is a good one.

The company’s fiscal second quarter of 2014 saw total sales grow eight percent to $6.4 billion, with sales of NIKE-branded products improving nine percent (currency neutral) to $6.1 billion and “Converse” sales growing 11% to $360 million.

Notable in the company’s latest financial results was a solid improvement in its gross margin due to higher average prices and greater sales of higher-margin products due to upcoming global sporting events, like the FIFA World Cup and the Winter Olympics.

Earnings were $537 million, growing three percent over the comparable quarter and four percent on an earnings-per-share basis.

The company bought back 5.5 million of its own common shares in its most recent quarter for $402 million. Since September of 2012, share repurchases totaled 29.2 million shares for $1.7 billion at an average price of $58.82 per share.

Global future orders of NIKE-branded footwear and apparel for delivery between December 2013 and April 2014 is running 12% higher than last year (13% currency neutral).

On the stock market, NIKE hasn’t really been down in price for very long. It’s mostly consolidated during periods of market weakness. The company’s 10-year stock chart is featured below:

Chart courtesy of www.StockCharts.com

NIKE is a global brand, and it’s the kind of position that I think is welcome in any diversified, long-term portfolio. Even though it’s a mature enterprise, the company consistently delivers the financial goods.

NIKE is the third featured stock I’m highlighting in a series of bedrock companies that investors can consider as core holdings in a long-term portfolio. (See “My First Pick in a Series of Core Investment Portfolio Holdings.”)

In November, NIKE increased its quarterly dividends by 14% to $0.24 a share, representing the company’s 12th consecutive year of increased income for stockholders.

Management’s stated goal is to deliver high single-digit annual revenue growth with earnings-per-share growth in the mid-teens. Total sales for fiscal 2015 are estimated at $30.0 billion, growing to $36.0 billion by fiscal 2017.

NIKE boasts an excellent track record of success, both operationally and on the stock market. While past results can’t foretell the future, this track record is meaningful for investors looking for positions that they can hold without having to worry about them. This company could be a worthwhile addition to any long-term investor’s wish list.

This article Why I Like This Global Brand Stock So Much is originally published at Profitconfidential


Australian Dollar Retreats From Lows amid Fed-Tapering

By HY Markets Forex Blog

The Australian dollar  bounced back from its three-year low against the green back on Monday just before the Christmas-holiday trade.

The aussie traded 0.28% higher against the US dollar at %0.8942 at the time of writing, and traded flat against the 17-bloc euro currency at a$1.5302 at the same time on Monday.

The Australian currency dropped to its lowest level since 2010 last week, following the Fed’s decision to decrease its $85 billion monthly asset purchases by $10 billion starting from January.

“The FOMC tapered the pace of asset purchases by $10 billion per month, but strengthened its forward guidance about the conditions for future rate hikes. We now expect the FOMC to taper by $10 billion per month through September 2014, with a final $15 billion reduction at the October 2014 meeting,” analysts from Barclays Capital predicted.


Australian Dollar – US Data

Analysts were surprised by the final revision of the US GDP, showing an advance of 4.1% at an annual pace, surpassing analysts’ prediction of a 3.6% rise. The second-quarter data remained unrevised at 2.5%, reports from the Department of Commerce confirmed on December 20.

Australian Dollar – Fed-Tapering

As the health of the world’s largest economy is getting stronger, members of the Federal Reserve decided to begin to reduce the central bank’s asset-purchases at their final meeting on December 18.

The US Central bank announced it would reduce its $85 billion monthly asset purchases to $75 billion starting January next year.

Boston’s Federal Reserve’s President Eric Rosengren voted against the Fed’s decision to reduce its bond purchases. Rosengren suggested the decision to taper should have been delayed until March 2014.

“The U.S. economy remains far from the 5.25 percent unemployment rate that I believe is consistent with full employment, and total PCE inflation, at only 0.7 percent, is well below the Federal Reserve’s inflation target of 2 percent,” Rosengren said.


Win a luxurious trip to the Maldives & up to $30,000 cash for trading with us!

Visit for details http://alturl.com/2kysk 

The post Australian Dollar Retreats From Lows amid Fed-Tapering appeared first on | HY Markets Official blog.

Article provided by HY Markets Forex Blog

WTI Crude Rises to Two-Month High

By HY Markets Forex Blog

WTI crude prices rose close to its highest price in two month as the economy world’s largest oil consumer is showing signs of stability and growth.

West Texas Intermediate for February delivery came in $99.01 per barrel on the New York Mercantile Exchange, 31 cents lower at the time of writing. The contract rose to the highest close on December 20 since Oct 18, rising 28 cents to $99.32.

While the European benchmark Brent crude dropped 7 cents lower to $111.70 a barrel on the ICE Futures Europe exchange. Brent crude was at $12.69 premium to WTI.

WTI Crude – US Economy

The International Money Fund (IMF) is increasing its outlook for the world’s largest economy, following the Federal Reserve’s (Fed) decision to start tapering its monthly asset purchases and the recent budget agreement that was finalized in Washington, Managing Director Christine Lagarde said in an interview with NBC.

Analysts were surprised by the reported third-quarter GDP, showing an advance of 4.1% at an annual pace, surpassing analysts’ prediction of a 3.6% rise. The second-quarter data remained unrevised at 2.5%, reports from the Department of Commerce confirmed on December 20. According to predictions from the International Energy Agency, the US is expected to account for approximately 21% of global oil demand this year.

The Organization of Petroleum Exporting Countries (OPEC), which supplies approximately 40% of the world’s crude, for the  rejected a proposal of the possibility of a glut in global crude supply next year, according to ministers from Saudi Arabia, Kuwait and Iraq.

WTI Crude – Libya

Meanwhile in Libya, the country holds the largest crude reserves in Africa and may to force to reopen exports terminals which have been closed by protesters if necessary, according to oil & gas  Minister Abdulbari al-Arusi.  Libya is producing 250,000 barrels a day, down from 1.43 million barrels a day in Dec 2012, according to estimates.


Get $100 FREE Funded into your MT4 Account as well as many more amazing benefits! Register with HY Markets today.

http://www.hymarkets.com/english/reg/reg.hyml …

The post WTI Crude Rises to Two-Month High appeared first on | HY Markets Official blog.

Article provided by HY Markets Forex Blog

Corporate Earnings Up 46% YOY for This Global Auto Stock

By for Daily Gains Letter

Corporate Earnings UpWhat does it take to develop a successful, long-term investment strategy?

This is the correct question to ask, rather than asking simply which stock(s) to buy. To be successful over the long term, you need to have a comprehensive investment strategy that takes into account your goals and risk parameters.

Having said all of that, at the end of the day, I’m looking for a company that has both an attractive valuation and the ability to increase corporate earnings at a rate above market expectations.

One way to develop an investment strategy is to look at the factors driving corporate earnings for a specific industry and individual company.

A great example is the automotive sector and Honda Motor Co., Ltd. (NYSE/HMC). Based in Japan, Honda actually has several different segments that they sell into, with automotives being their most commonly known products sold worldwide.

HMC Honda Motor Co Ltd

Chart courtesy of www.StockCharts.com

Why do I think corporate earnings will continue rising at Honda, and what factors am I considering when looking at this stock as part of an investment strategy?

Looking at the automotive industry here in America, sales are obviously soaring now compared to what we’ve seen over the past few years. Is there any real sign that this will change anytime soon? I don’t believe so, and I think cheap financing will continue for some time.

Globally, car sales will continue to increase as many nations around the world are keeping interest rates low, creating cheap financing.

Another reason I believe Honda will continue to rise is the policies stemming from the Bank of Japan and the government of Japan. For those unaware, the Bank of Japan is undergoing a massive monetary policy program (money printing) with the blessing of the Prime Minister of Japan.

Leaders in Japan are explicitly stating they want a significantly lower Japanese yen to drive exports. The lower the yen goes, the higher the corporate earnings are for a company like Honda, which benefits from this currency conversion.

This type of fundamental driver is important for any long-term investment strategy. Having the Bank of Japan forcefully trying to drive the yen lower is just another factor supporting strong corporate earnings for an exporter like Honda.

Just take a look at the second-quarter 2013 results and you’ll see the strength in Honda’s corporate earnings, and how this investment strategy is playing out. During the second quarter, consolidated corporate earnings were up 46.4% compared to the second quarter in 2012. (Source: “Honda Motor Co. Ltd. reports consolidated financial results for the fiscal second quarter ended September 30, 2013,” Honda Motor Co., Ltd. web site, October 30, 2013.)

Honda’s automobile revenues increased 26.2% year-over-year and motorcycle revenues were up 35.0% year-over-year. While the firm did incur some added costs, overall corporate earnings increased due to higher sales volume and positive currency effects (i.e. a weak yen).

When considering this as a long-term investment strategy, are any of these fundamental drivers going to change over the short term?

I don’t believe so; in fact, as the Federal Reserve begins reducing monetary stimulus, this will help the money printing in Japan to further weaken the yen, which will, in turn, help the corporate earnings of exporters like Honda.

I’m not suggesting you should simply buy the stock right now; rather, I’m giving you an idea of how to structure an investment strategy that looks for corporate earnings growth by including various factors. When you’re examining your stocks, try to look beyond the current environment to see if the landscape is improving or worsening for the companies in your portfolio.


Source: http://www.dailygainsletter.com/investment-strategy/corporate-earnings-up-46-yoy-for-this-global-auto-stock/2263/


Gold Market to See Supply Shock in 2014?

By for Daily Gains Letter

201213_DL_zulfiqarAs the negativity towards gold bullion increases, and the influx of easy money is in jeopardy, one key question is being asked: how low can the prices of the yellow shiny metal really go? Remember the decline in gold bullion prices in late June? When the prices fell below $1,200 an ounce then, we heard calls for a bottom. Now we are closing in on that level again.

As I have said before, predicting tops and bottoms is really difficult; sometimes, tops and bottoms may already be in place, and we just don’t know it until later. At this point, we don’t know if the level reached in late June was really the bottom.

For now, the chart of gold bullion shows nothing but negativity. You can see it for yourself below:

Gold-Spot Price Chart

Chart courtesy of www.StockCharts.com

With all this in mind, I remain bullish on gold bullion prices ahead. I don’t know where the bottom will be placed, but one basic principle of economics keeps me bullish: supply and demand.

As I have said before, the most basic factor that drives prices is supply and demand. If the supply remains the same and demand declines, you can expect the price of gold bullion, or any other commodity or stock for that matter, to go down. On the other hand, if the demand remains the same or increases but the supply declines, the prices head higher.

The lower the gold bullion prices go, the bigger the supply shock is going to be. Consider this: if the price of gold bullion is $1,200 an ounce and the cost to extract one ounce from the ground is $1,250, then that gold producer will lose $50.00 on every ounce it takes from the ground. The more it produces, the bigger the loss.

Imagine this: in the third quarter, Goldcorp Inc. (NYSE/GG, TSX/G) reported that its all-in sustainable cost to produce one ounce of gold bullion was $992.00. Now, if prices go below this level, Goldcorp’s losses are going to start adding up. (Source: “Goldcorp reports 2013 third quarter results,” Goldcorp Inc. web site, October 24, 2013.) Keep in mind that Goldcorp is one of the cheapest gold producers, too.

If gold prices continue to slide lower, gold producers will eventually have to halt their production—or face massive losses. Once this happens, the supply side of gold bullion will face troubles. I’m sure you know how robust the demand is for the yellow shiny metal among consumers and central banks.

Finding an exact bottom or top is impossible. Currently, the trade seems to be to sell gold and follow the trend, but when I look at the basic fundamentals, it seems there’s not much downside left. Certainly, time will draw a better picture, but if this scenario does come into play, investors may profit from the SPDR Gold Shares (NYSEArca/GLD) exchange-traded fund (ETF), since it holds gold bullion and is unaffected by production costs.

Source: http://www.dailygainsletter.com/precious-metals/gold-market-to-see-supply-shock-in-2014/2268/


Fibonacci Retracements Analysis 23.12.2013 (EUR/USD, USD/CHF)

Article By RoboForex.com

Analysis for December 23rd, 2013

EUR/USD

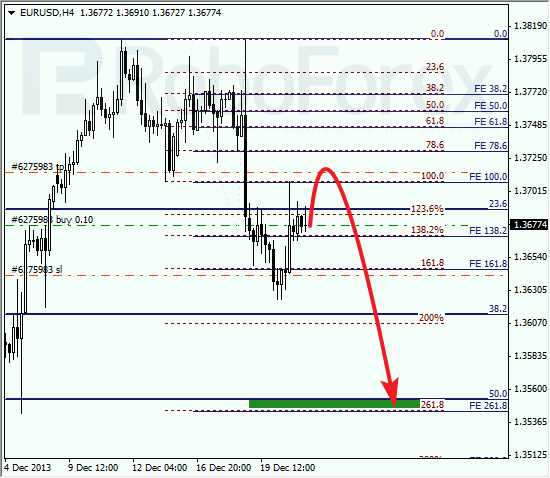
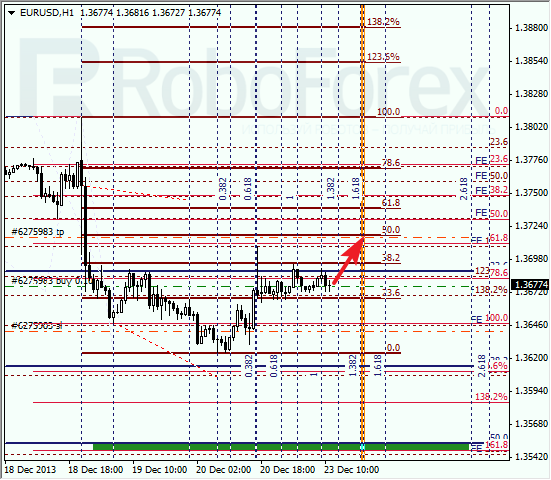
Eurodollar started new correction. Possibly, in the nearest future correctional movement may continue and price may reach new local maximum. I’ve got one short-term buy order so far; later pair is expected to start falling down towards lower fibo-levels.

As we can see at H1 chart, target for current local correction is at level of 50%. If later market rebounds from this level, bears may start new descending movement. According to analysis of temporary fibo-zones, local targets may be reached on Monday.

USD/CHF

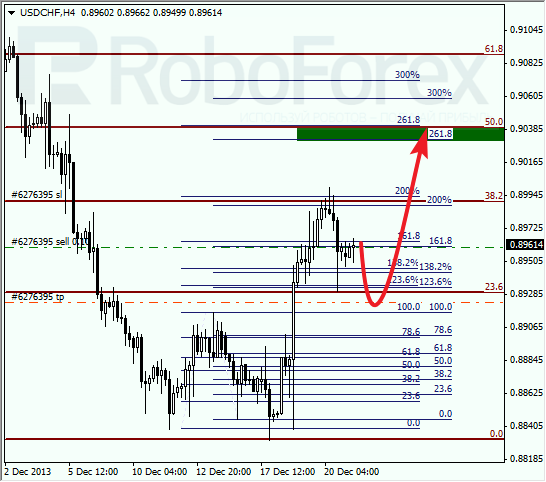
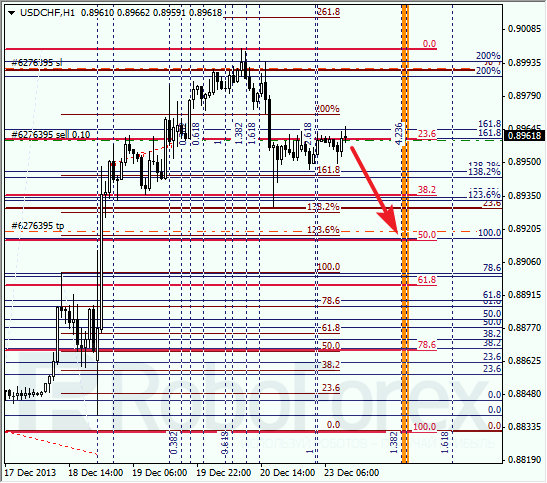
After making fast ascending movement, Franc started new correction. It looks like price is going to reach another local maximum before starting moving upwards again. Possibly, this correction may complete during the next 24 hours and market may start growing up towards upper fibo-levels.

During local correction, I opened sell order with target at local level of 50%. Later, pair may rebound from this level. According to analysis of temporary fibo-zones, this correction ay finish during the day.

RoboForex Analytical Department

Article By RoboForex.com

Attention!
Forecasts presented in this section only reflect the author’s private opinion and should not be considered as guidance for trading. RoboForex LP bears no responsibility for trading results based on trading recommendations described in these analytical reviews.


10 Shocking Charts That Will Define 2013 (Part 2)

By WallStreetDaily.com

It’s been a whopping 558 days since we’ve endured a perfectly healthy and normal 10% selloff in the stock market. The streak is all but guaranteed to extend into 2014, given that there are only a handful of trading days left in the year.

But a year without a correction isn’t the only thing that we’ll remember about 2013…

As you’ll recall, on Friday, we started looking back at the most memorable developments in the market in 2013.

It’s time to finish the job. So let’s get to it…

Con #1: Real Estate is Forever Doomed

Ridiculed. Rejected. Ignored. That pretty much sums up the response to my February 2012 insistence that “the real estate market just hit rock bottom.”

Lo and behold, the market did bottom out at that time. The good news is, the recovery gained steam in 2013.

The most telling sign? Home prices. They’re up almost 15% in the last year, based on the S&P/Case-Shiller Composite-20 Home Price Index.


The sharp rise naturally pushed down affordability. But don’t fret…

The latest National Association of Realtors Housing Affordability Index reading indicates that the typical American family has 165.4% of the income necessary to qualify to purchase a median-priced, single-family home (with a 20% down payment and a 30-year fixed-rate mortgage).

So any talk about another bubble forming is utter nonsense. The classic sign of a bubble is when prices get out of reach. And that’s obviously not the case here.

As Goldman Sachs’ (GS) analysts pointed out in a recent research note: “We see the dataflow as consistent with growing momentum in the housing sector, in line with our view that higher interest rates will not prevent a solid increase in housing activity in 2014.”

I expect the recovery to continue in 2014, too. Feel free to disagree with me (again) at your own risk…

Con #2: The Bull Market Doesn’t Have Legs

Forget real estate for a moment. Global equity markets also rebounded mightily in 2013, trading at new all-time highs, according to the World Federation of Exchanges data.


The combined market cap of the world’s 58 major stock markets rose to $63.4 trillion in November.

To put that in perspective, global equity values plummeted to $29.1 trillion in the depths of the financial crisis. So we’re talking about some serious wealth (re)creation here.

I’ll take it! How about you?

Con #3: Invest in the BRICs

Now, if we dissect stock performance on a country-by-country basis, it’s clear that not every market enjoyed boom times.


The over-hyped emerging markets of Brazil, Russia, India and China fared the worst. Only India registered a gain. But certainly not a big one – only 6.1%. And Brazilian stocks got absolutely clobbered, dropping nearly 20%.

Meanwhile, Japan, the United States and many European countries topped the leaderboard.

Japan? Who’d have thunk it? Oh, that’s right, we called for Japanese stocks to rally in December 2012. Hope you listened.

Con #4: The Next Crisis is Coming!

This is perhaps the most telling chart of all. It shows the correlation among all asset classes, which got cut in half in 2013.


What’s the big whoop? I’ll let Business Insider’s Joe Weisenthal explain: “One of the characteristics of a crisis is extreme correlation between multiple asset classes: Everything trades up or down together.”

The financial press famously referred to this as the risk on/risk off environment. But it’s over, as is the financial crisis, which means we’re in a stock picker’s market more than ever.

What type of stocks should we be focusing on, though? Glad you asked…

Con #5: Small Caps Are Maxed Out

Talk about staying power! For 13 years in a row, small-cap stocks have outperformed their larger-cap brethren.

In 2013, they rallied 34.2%, compared to a 26.9% rise for large caps, as represented by the S&P 500 Index.

Micro-cap stocks, which my MicroCap Tech Trader subscribers know all too well, performed best, rising an average of nearly 40%.

I recommend you stick to the same script in 2014 – bet big on small-cap (and micro-cap) stocks!

Ahead of the tape,

Louis Basenese

The post 10 Shocking Charts That Will Define 2013 (Part 2) appeared first on Wall Street Daily.

Article By WallStreetDaily.com

Original Article: 10 Shocking Charts That Will Define 2013 (Part 2)

Murray Math Lines 23.12.2013 (AUD/USD, EUR/JPY, SILVER)

Article By RoboForex.com

Analysis for December 23rd, 2013

AUD/USD

Australian Dollar is still being corrected between Super Trends. If later pair rebounds from daily Super Trend, market will start new descending movement, in this case, target will be at the -2/8 level.

Australian Dollar is moving in lower part of H1 chart. If price breaks Super Trends, pair will start new descending movement. In this case, next thing bears need to do is to enter “oversold zone”.

EUR/JPY

EUR/JPY is already moving above the 7/8 level; local correction is supported by H4 Super Trend. If price rebounds from it, pair will start growing up towards the 8/8 level.

Price is moving in the middle of H1 chart, above the 4/8 level. If bulls are able to keep price above the 5/8 level, pair will continue its ascending movement towards the 8/8 level.

SILVER

Silver is still being corrected; so far, bulls are slowed down a bit by H4 Super Trend. Possibly, price will break the 8/8 level in the middle of the week.

As we can see at H1 chart, last week bulls tried to break the 4/8 level, but failed. Closest target for bears is at the 0/8 one; they may break it quite soon..

RoboForex Analytical Department

Article By RoboForex.com

Attention!
Forecasts presented in this section only reflect the author’s private opinion and should not be considered as guidance for trading. RoboForex LP bears no responsibility for trading results based on trading recommendations described in these analytical reviews.