Undervalued Opportunity Ripe for Long-Term Investing

By for Investment Contrarians

Long-Term InvestingAs my long-time readers know, contrarian investing is all about buying when others are selling and selling when others are buying. Getting in ahead of the crowd is the key to successful long-term investing.

One market segment that has been severely hit over the past few months and could be ripe for long-term investing is the international potash market. Two firms operating out of Russia and Belarus essentially control approximately 40% of the potash market through a cartel that dictates supply and, ultimately, pricing.

In July of this year, this cartel collapsed, with one of the firms changing their strategy to maximize volume. This caused potash prices to drop by approximately 33%.

I believe there is a long-term investing opportunity in the international potash market. The current squabble between these two firms really is a soap opera, involving egos and politics centered between former Soviet Union nations.

For long-term investing purposes, one has to envision what’s likely to occur over the next few years. I don’t believe that management and the political leaders of both Russia and Belarus want to see potash prices at such low levels when they are able to reduce supply and raise prices.

This creates an investment opportunity for domestic potash producers.

While the overall stock market has soared, potash companies have seen their share prices drop significantly. For long-term investing purposes, I believe this is creating an attractive investment opportunity.

When it comes to long-term investing in a sector that’s beaten up, I would suggest looking at the market leaders, since they have the cash on hand to weather the storm.

Potash Corporation of Saskatchewan Inc. (NYSE/POT, TSX/POT) is one of the top potash firms in the world. With a market capitalization of $27.0 billion, a forward dividend yield of approximately 4.5%, and a return on equity of over 20%, even with the collapse in potash prices, this company is certainly one worth considering for long-term investing.

But remember, an unloved sector can remain out of favor for some time. The investment opportunity might certainly be valid, but this is the type of situation where investors need to slowly enter a market sector over a long period of time.

Potash Corp. Saskatch Chart

Chart courtesy of www.StockCharts.com

As you can see in the chart above, the collapse of the cartel in July 2013 caused a massive sell-off in the stock. With the stock now trading near lows not seen since 2010, the stock might soon be a candidate for long-term investing. Obviously, there are still several structural issues that need to be fixed.

While the investment opportunity is definitely present in the potash sector, one simply can’t put all their eggs in one basket. Long-term investing when there are so many unknowns can be risky; one needs to exercise caution by having a diversified portfolio, even within a given sector.

When will the Russian/Belarus potash cartel be formed once again? Who knows, as politics and business are extremely difficult to predict. In my opinion, it just makes business sense to have the price of potash increase, benefiting both nations and all companies in this sector.

Fundamentally, the demand for food, in my opinion, won’t decline anytime soon. Last time I checked, the population continues to grow, and this means more mouths to feed. The investment opportunity in food is pretty clear. More demand means a greater yield per acre is needed, which is why farmers use fertilizers in the first place.

Long-term investing in the potash sector is attractive from several different viewpoints. The cheaper valuations for potash companies, the investment opportunity from increased demand from food, and the cartel being renewed by two of the largest producers in the world are all positive catalysts.

This is not a short-term trade, which means it could take some time for this investment opportunity to work itself out. However, in my opinion, long-term investing in the potash sector is beginning to look more attractive. I would certainly have these stocks on my watch list for further consideration and due diligence.


Original Post: http://www.investmentcontrarians.com/stock-market/undervalued-opportunity-ripe-for-long-term-investing/3367/


The Practical Investor – Weekend Update

Weekend Update

November 29, 2013


— VIX appears to be challenging its cluster of resistance between 13.66 and 14.13.  The 5 week breakout point is at 14.45, which may give the VIX a “green light” for a higher rally.  The next breakout point would be at 21.00, the neckline of a complex inverted Head & Shoulders formation.

SPX exceeds a common wave relationship.

— SPX spent its third week in a throw-over above its massive Ending Diagonal.  While most throw-overs are measured in 60 to 90 day Ending Diagonals, this one is 2 ½ years old.    Thanksgiving week is often considered the “peak week” of the positive season for stocks, so this week’s performance is no surprise. What is a surprise is a “key reversal” in which the SPX nearly gave up all of its gain for the week.  The reversal from the top may be violent.


(ZeroHedge)  Despite a significant tumble into the close ($3.25bn notional sold in last 4 seconds of S&P futures); for the first time since January 2004, the S&P 500 has risen for eight straight weeks.


NDX is at double resistance.

— This week NDX is again pressing against two upper trendlines, that of the Massive Ending Diagonal and the upper trendline of the Broadening Wedge formation.   While Ending Diagonals often have throw-overs, Broadening Tops do not.  This suggests that NDX may be approaching the end of the line as it presses to meet the Broadening Top trendline for the last time.


(ZeroHedge)  With Thanksgiving comes Black Friday and Cyber Monday, two of the biggest days for retail stocks each year. Thanksgiving isn’t just an opportunity to gorge on turkey; it’s also one of the most important weekends of the year for the retail sector. As much as 40% of American shopping occurs on the now infamous Black Friday and Cyber Monday – the first two business days that fall after Thanksgiving. But to complicate the matter, meteorologists are tracking an epic super-storm that is slowly working its way east, threatening to bring even more chaos to the holiday season. So who will win?


The Euro may have completed its bounce.


.  


           — The Euro bounce may be over after a 61% retracement of its decline from the October 24 high.  The bounce appears to be complete, since the Cycles Model suggests the Euro may be due for a significant low by the end of the year.


(ZeroHedge)  Following the “good” news in the inflationary front, in which European November CPI rose and beat expectations if posting the first sub-Japan inflationary rate in Eurozone history, Eurostat followed with more holiday cheer when it reported a surprising decline in the overall Eurozone unemployment rate from 12.2% to 12.1%, the first such drop since late 2010.

It was not all good news however, and when one looks at Europe’s weakest link – youth unemployment – the number once again rose to a fresh all-time high, of 24.4%…


The Yen slides toward its Head & Shoulders neckline.

–The Yen continues its slide toward the Head & Shoulders neckline at 96.00. The Yen may break down beneath the neckline in a Primary Wave [5] in a very strong Primary Cycle decline through that may last into the New Year.


(ZeroHedge)  When Abenomics was unveiled in Japan upon the re-election of Shinzo Abe as prime minister in late 2012, it is safe to say that, having been mired in a 20-year deflationary spiral and with debt totaling 240% of GDP,Japan was nearing an endgame of sorts.

Realizing just how late in the game he found himself, Abe promised to change all this, but in order to do so he needed to pursue a high-risk strategy with a low probability of success.

The press (ever hungry for a new, catchy portmanteau word) dubbed it “Abenomics.”

The US Dollar completes a bullish Flag formation.


— USD appears to have completed a bullish Flag formation this week.  If so, this may imply a potential breakout above the Head & Shoulders neckline in the very near future.  Last week I suggested, “This may prove to be a head fake for dollar shorts since the next Cycle high may occur by mid-December.”  The probability of a correct call may be rising…

Gold dips beneath its Head & Shoulders neckline.

— Gold dipped beneath a small Head 7 Shoulders neckline at 1235.00, but snapped back above it.  Currently it is challenging its Cycle Bottom resistance at 1243.58, but may be losing its upward momentum.  The nearer term target is the completion of its smaller Head & Shoulders formation at or near 1070.00.  I hope that I am wrong on the lower target, which may arrive in 2014.


(ZeroHedge)  There was a time when the merest mention of gold manipulation in “reputable” media was enough to have one branded a perpetual conspiracy theorist with a tinfoil farm out back. That was roughly coincident with a time when Libor, FX, mortgage, and bond market manipulation was also considered unthinkable, when High Frequency Traders were believed to “provide liquidity”, or when the stock market was said to not be manipulated by the Fed, and when the ever-confused media, always eager to take “complicated” financial concepts at the face value set by a self-serving establishment, never dared to question anything.

Treasuries loses upward momentum.

— USB stayed beneath Intermediate-term resistance at 131.97and appears uncertain about the direction it may take.  It may retrace to its weekly Short-term resistance at 132.29, but will meet trendline resistance there, as well, so the upside potential is limited.  However, crossing Cycle Bottom Support and its Broadening Wedge trendline at 129.71 may have devastating consequences for the Long Bond.

(WSJ)  U.S. Treasury bonds fell Friday and wrapped up a monthly price loss as fears grew that the Federal Reserve might dial back its bond buying before the end of the year.

Next week’s nonfarm jobs report is seen by many bond traders and investors as the key factor determining the timing for the Fed to cut, or taper in Wall Street terms, its $85 billion monthly purchases in Treasurys and mortgage-backed securities.

Fed officials have said that when to adjust the pace of its bond buying, a key tool to stimulating the economy following the 2008 financial crisis, hinges on the health of the economy, especially U.S. employment.

Crude may be extending its decline.

— Crude may be extending its decline yet another week.  In doing so, it may be forming point 4 in a Broadening Wedge formation.  If it declines beneath 87.50, the probability of this becoming a successful formation  may be reduced.  However, if it makes a low in the next week or so at or above 87.50, the Broadening Wedge may be the dominant formation for up to 2 months.

(ABCNews)  The price of oil was little changed above $92 a barrel Friday as holidays in the U.S. thinned trading and plentiful crude stocks showed the market was well supplied.  By early afternoon in Europe, benchmark U.S. crude for January delivery was up 27 cents at $92.57 a barrel in electronic trading on the New York Mercantile. Crude’s last settlement was Wednesday as floor trading on the Nymex was closed Thursday for Thanksgiving.

Oil has declined from about $110 in September due to reduced tensions in the oil-rich Middle East, but above all due to muted demand and high supplies.

China stocks repelled at trading channel trendline.

–The Shanghai Index rally stopped at mid-Cycle resistance at 2231.69 its declining trading channel trendline, which has defined Cycle tops for the past 3 years.  This is the third time the SSEC has been stopped at those markers since September 12 and the fifth time this year, attesting to the potency of that resistance.  The next Pivot low may occur in late December, so this may be a strong decline.


The India Nifty gets whipsawed.

— The India Nifty index attempted to regain its losses from the prior week, but failed to make a new high.  This suggests the current Ccycle may continue to decline into the end of December.  The next bounce may be near Intermediate-term support at 5906.28.

The trigger to activate the Orthodox Broadening Top formation lies at the bottom trendline just above 4800.00  It appears that CNXN may be reaching the bottom of this chart by the end of December.

The Bank Index rally may have run its course.

— BKX  came close to last week’s target before “giving it up.”  On Friday it made a weekly key reversal, which suggests the rally is now done.  Next week may give us the parameters for the downside targets.

(ZeroHedge)  The Fed’s Catch 22 just got catchier. While most attention in the recently released FOMC minutes fell on the return of the taper as a possibility even as soon as December (making the November payrolls report the most important ever, ever, until the next one at least), a less discussed issue was the Fed’s comment that it would consider lowering the Interest on Excess Reserves to zero as a means to offset the implied tightening that would result from the reduction in the monthly flow once QE entered its terminal phase…After all, the Fed’s policy book goes, if IOER is raised to tighten conditions, easing it to zero, or negative, should offset “tightening financial conditions”, right? Wrong. As the FT reports leading US banks have warned the Fed that should it lower IOER, they would be forced to start charging depositors.

(ZeroHedge) In order to offset the lack of loan creation by commercial banks, the “Big 4” central banks – Fed, ECB, BOJ and BOE – have had no choice but the open the liquidity spigots to the max. This has resulted in a total developed world “Big 4” central bank balance of just under $10 trillion, of which the bulk of asset additions has taken place since the Lehman collapse.

How does this compare to what China has done? As can be seen on the chart below, in just the past 5 years alone, Chinese bank assets (and by implication liabilities) have grown by an astounding $15 trillion, bringing the total to over $24 trillion, as we showed yesterday. In other words, China has expanded its financial balance sheet by 50% more than the assets of all global central banks combined!


Bear Extinction.  What happens when there’s no one left to sell to?

Regards,

Tony

Anthony M. Cherniawski

The Practical Investor, LLC

P.O. Box 129, Holt, MI 48842

www.thepracticalinvestor.com

Office: (517) 699.1554

Fax: (517) 699.1558


Disclaimer: Nothing in this email should be construed as a personal recommendation to buy, hold or sell short any security.  The Practical Investor, LLC (TPI) may provide a status report of certain indexes or their proxies using a proprietary model.  At no time shall a reader be justified in inferring that personal investment advice is intended.  Investing carries certain risks of losses and leveraged products and futures may be especially volatile.  Information provided by TPI is expressed in good faith, but is not guaranteed.  A perfect market service does not exist.  Long-term success in the market demands recognition that error and uncertainty are a part of any effort to assess the probable outcome of any given investment.  Please consult your financial advisor to explain all risks before making any investment decision.  It is not possible to invest in any index.

The use of web-linked articles is meant to be informational in nature.  It is not intended as an endorsement of their content and does not necessarily reflect the opinion of Anthony M. Cherniawski or The Practical Investor, LLC.


Murray Math Lines 02.12.2013 (AUD/USD, EUR/JPY, SILVER)

Article By RoboForex.com

Analysis for December 2nd, 2013

AUD/USD

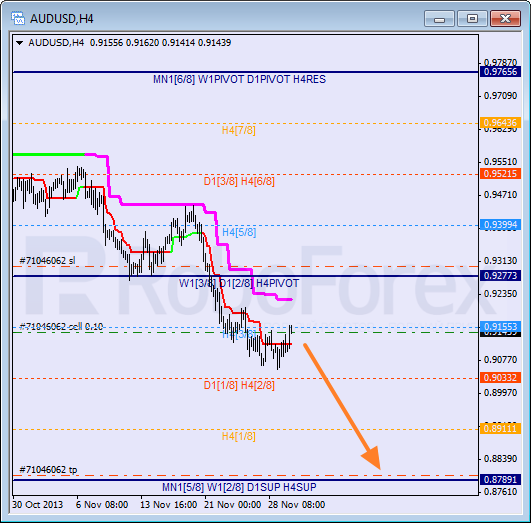
During correction, Australian Dollar “touched” my stop on sell order. Considering that current ascending movement is slowing down, I’ve decoded to open one more sell order. Target is still at the 0/8 level. If pair is able to stay below H4 Super Trend, bears will return to the market.

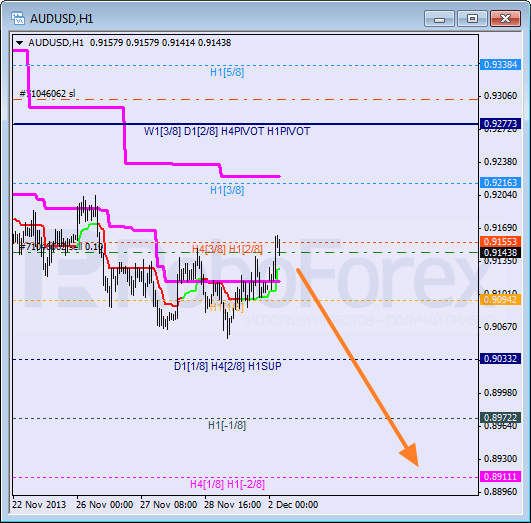
At H1 chart, pair is trying to find support from the 2/8 level. If pair breaks it, price will continue moving downwards. Later market is expected to break the 0/8 level and continue falling down towards the -2/8 one.

EUR/JPY

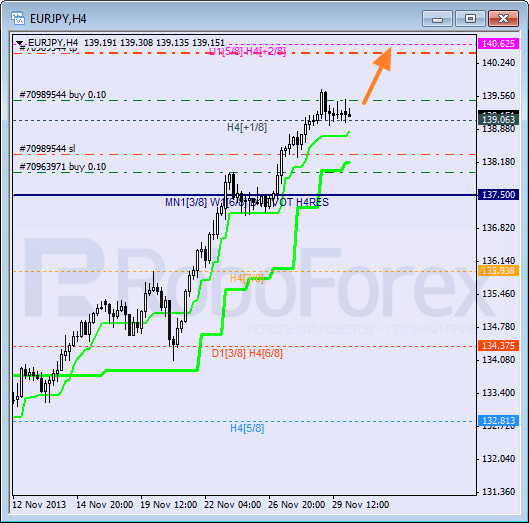
Pair continues moving upwards; right now price is consolidating inside “overbought zone” and supported by H4 Super Trend. Local target is at the +2/8 level.

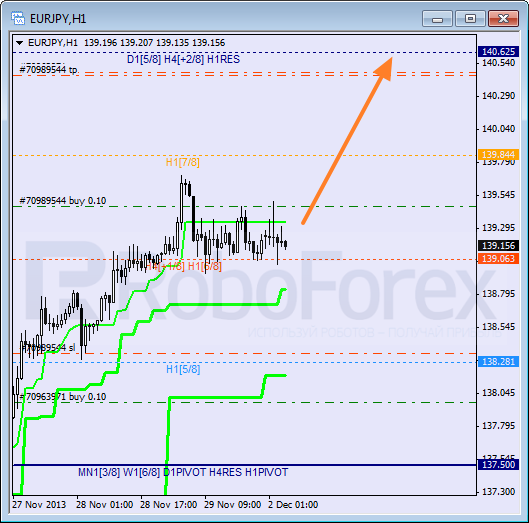
At H1 chart, pair is moving between Super Trends. Probably, bulls will break them during the day and continue pushing price upwards to reach the 8/8.

SILVER

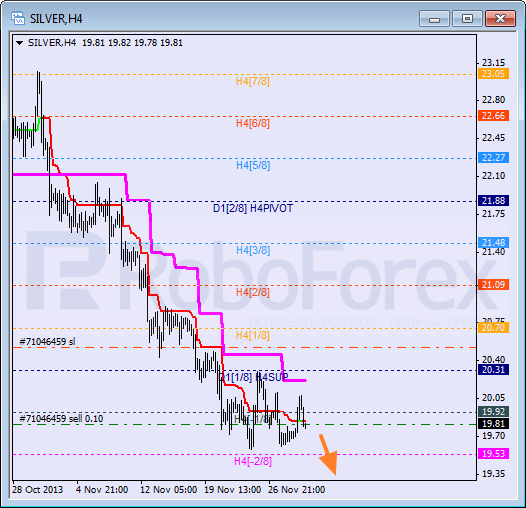
Silver is still moving inside “oversold zone”. Considering that current movement looks more like flat pattern, I’ve decided to close my buy order and opened new short position. Possibly, market may break the -2/8 level during the day. In this case, lines at the chart will be redrawn.

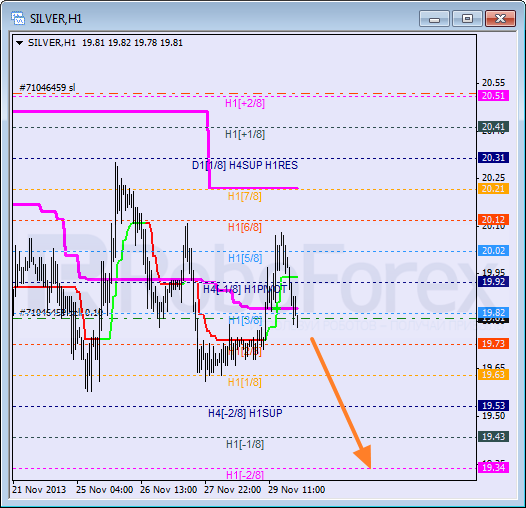
Price is moving in the middle of H1 chart. In the near term, Silver may break the 0/8 level and enter “oversold zone”. If later instrument breaks the -2/8 level, lines at the chart will be redrawn.

RoboForex Analytical Department

Article By RoboForex.com

Attention!
Forecasts presented in this section only reflect the author’s private opinion and should not be considered as guidance for trading. RoboForex LP bears no responsibility for trading results based on trading recommendations described in these analytical reviews.


Japanese Candlesticks Analysis 02.12.2013 (EUR/USD, USD/JPY)

Article By RoboForex.com

Analysis for December 2nd, 2013

EUR/USD

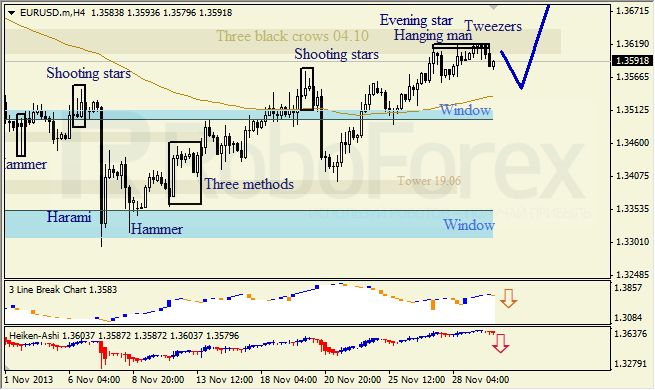
H4 chart of EUR/USD shows correction, which is indicated by Evening Star, Hanging Man, and Tweezers patterns. Closest Window is support level. Three Line Break chart and Heiken Ashi candlesticks confirm ascending movement.

H1 chart of EUR/USD shows correction, which is indicated by Tweezers pattern. Closest Window is support level. Three Line Break chart confirms descending movement; Heiken Ashi candlesticks indicates possible bullish pullback.

USD/JPY

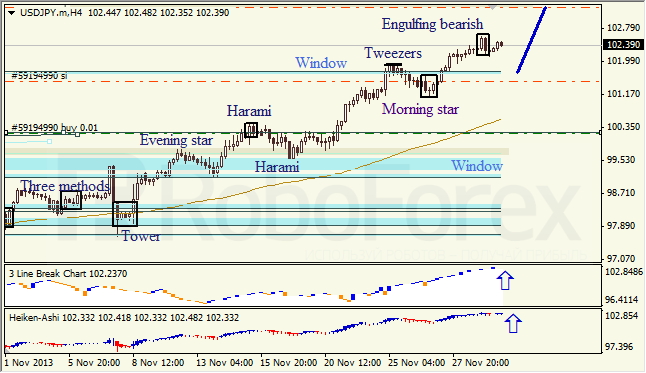
H4 chart of USD/JPY also shows bullish tendency within ascending trend. Three Line Break chart and Heiken Ashi candlesticks confirm ascending movement; Engulfing Bearish pattern indicates possible bearish pullback.

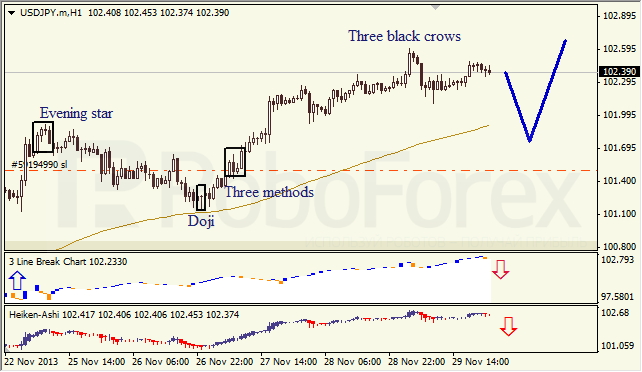
H1 chart of USD/JPY shows ascending trend, but Three Black Crows pattern indicates correction. Three Line Break chart and Heiken Ashi candlesticks confirm descending movement.

RoboForex Analytical Department

Article By RoboForex.com

Attention!
Forecasts presented in this section only reflect the author’s private opinion and should not be considered as guidance for trading. RoboForex LP bears no responsibility for trading results based on trading recommendations described in these analytical reviews.


GBPUSD stays above a upward trend line

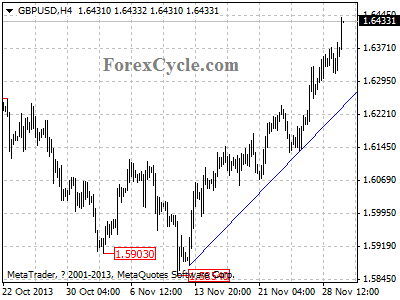
GBPUSD stays above a upward trend line on 4-hour chart, and remains in uptrend from 1.5854, and the rise extends to as high as 1.6442. As long as the trend line support holds, the uptrend could be expected to continue, and next target would be at 1.6500 area. On the downside, a clear break below the trend line support will suggest that the uptrend from 1.5854 has completed, then the following downward movement could bring price back to 1.6000 zone.

gbpusd

Provided by ForexCycle.com

Property Investors Can Only Dream of ‘Disappointing’ Returns Like This

By MoneyMorning.com.au

It’s the final stretch.

The market is down to the last 20 trading days of the year.

During that time, if the market is to get to our 6,000 point year-end target it will need to gain 12.8%.

It seems impossible. And maybe it is.

Yet, even if it does nothing from here, this market continues to prove there’s no better wealth-building investment than stocks

It’s easy to look at stocks at the moment and take a negative view.

After all, since hitting a five-year high in October stocks have pretty much moved in one direction.

We’ve heard the same old tired stories about stocks being a dud investment. That’s especially so when the front pages tell wonderful stories about the housing market rebound…how house prices are so high that first home buyers just can’t afford to get into the market.

Oh, what short memories. We’ll just remind those folks that as great as the housing market rebound may be, there wouldn’t be a single property investor who has made a net gain of 14.4% this year.

By contrast there are thousands, perhaps even millions of stock investors who have done just that. Some have done even better.

Don’t Confuse Price With Value

It’s funny. Property investors always rush to say that investing in property is a great way to make money. And yet it seems to us that almost every day we read a story that says housing is unaffordable…that it’s too expensive for folks to get into the market.

Maybe we need to go back to investing school, but surely a key definition of a good investment is that you can actually buy the investment.

If it’s so expensive that you can’t afford to buy it, well, that’s not much of an investment at all.

Compare that to the stock market. There isn’t a single stock on the Australian market that someone with as little as $500 couldn’t buy.

Of course, there’s a difference between price and value. A stock may have a price of $10 per share but that doesn’t necessarily make it good value compared to a $20 stock.

That’s where you have to put in the analysis to find out which stock is better value. You need to dig around a company’s balance sheets and get inside the business.

That’s the task we’ve set for Diggers and Drillers resource analyst Jason Stevenson. We’ve asked him to analyse – among others – BHP Billiton [ASX: BHP] and Rio Tinto [ASX: RIO] to find out which is better value.

These two stocks are a great example of the need to look at more than price. BHP is $37 per share, while Rio is $66 per share. But that doesn’t mean BHP is the better value stock.

Naturally, there’s a chance that neither are good value at their current price. If so we’ll suggest investors look elsewhere. We’ll showcase Jason’s analysis in the December issue of Diggers and Drillers.

Although we have to be honest and say that even if BHP and Rio are overvalued at the current price, odds are investors will still do pretty well out of each stock over the next 10 years. Even so, who wouldn’t rather buy a great stock at a great price rather than a high price?

Buying and Selling Costs are Chicken Feed

That’s what makes the stock market so great, despite what the detractors say.

Unlike property investing, most stock investors don’t need to borrow money to invest. They can pay with straight cash. That’s how stock investors can achieve such high net investing returns (not including the tax liability of course).

That’s not always true for property investors. In fact, Australian Taxation Office figures show that most property investors lose money each year. Interest costs, maintenance costs and property management fees chew up any gains they make from renting out a property.

And that’s not even taking into account the buying and selling costs associated with property investing, which run into the tens of thousands of dollars.

By contrast, even if you bought $100,000-worth of stock your transactions fees wouldn’t add up to more than $100. For most investors who buy anything from $500 to $25,000-worth of stock they’ll pay anything up to $25.

In short, the cost to buy and sell shares is chicken feed. And that’s important, because the more money you can plough into an actual investment rather than paying the government or agent, the more money for you in retirement.

We’ll Take This ‘Small’ Return Any Time

So sure, it has been a disappointing six weeks for stocks, and there’s a good chance the market won’t hit our short term target of 6,000 points.

But does that mean stocks are a bad investment and that you should get the heck out of them?

No.

Even with the rebounding housing market and low interest rates, if you factor in the fees and costs to buy and hold property, most housing investors are well underwater for the year.

But not stock investors. The S&P/ASX 200 may only have gained 14.4% so far compared to a 65% gain for Japan’s Nikkei225 index, but you know what, that’s good enough for us.

If we could squeeze that kind of gain out of stocks every year we’d be more than happy. In short, whatever anyone says, stocks remain the best wealth builder bar none…and this is definitely a buyer’s market rather than a seller’s market.

Cheers,
Kris+

Special Report: The ‘Wonder Weld’ That Could Triple Your Money

Join Money Morning on Google+


By MoneyMorning.com.au

It Won’t Be Long Until Mainstream Economists Change Their Tune

By MoneyMorning.com.au

The rationale for low interest rates and QE (money printing) is to achieve a lower unemployment rate and higher inflation. Well according to the recent Federal Open Market Committee (FOMC) they have so far failed to achieve their dual mandate. See the following extract from the FOMC 29-30 October 2013 meeting, with my emphasis added:

‘Although the incoming data suggested that growth in the second half might prove somewhat weaker than many of them had previously anticipated, participants broadly continued to project the pace of economic activity to pick up.

‘Participants generally expected that the data would prove consistent with the Committee’s outlook for ongoing improvement in labor market conditions and would thus warrant trimming the pace of purchases in coming months.’

The Federal Reserve acknowledges that growth is weaker, but is still sticking to the line that it will taper. Forever the optimists.

Two senior US Federal Reserve Bank economists, William English and David Wilcox, recently reinforced this message when they addressed the Annual IMF Research Conference. The papers they presented at the conference dealt with life after the Fed tapers – not if but when.

This was a clear signal (as opposed to Bernanke’s rather on/off signal) to the market that the Fed is set to reduce the level of monthly money creation from $85 Billion to a slightly lesser number. Prepping the market for a potential (and I stress potential) change in ‘medication’ is part of the new Janet Yellen communication strategy.

The other message from the Fed was ZIRP (zero interest rate policy) is here to stay until at least 2017. Remember ZIRP was a ‘short term’ measure introduced by the Fed in December 2008 to kick-start the US economy.

This is No Ordinary Recession

Money creation and low interest rates have worked a charm for all post Second World War recessions. But what the Fed and other central bankers (we’ll come to Europe shortly) are finding out is this is no ordinary recession  caused by a slump in the business cycle. This is an economic funk caused by a collapse in the credit cycle.

The Great Depression and Japan post-1990 are the only recent examples of a credit cycle slump…and neither of these make for pleasant bedtime reading.

Professor Paul Krugman (the Nobel Laureate economist and the Fed’s mainstream economic cheerleader) argues ZIRP and QE should be maintained because the US is mired in ‘depression’ conditions. The fact Krugman has acknowledged the depressive state of the US economy is a major departure on his previously stated position. Here are some excerpts from his column and my interpretations:

Krugman: ‘…if our (US) economy has a persistent tendency toward depression, we’re going to be living under the looking-glass rules of depression economics – in which virtue is vice and prudence is folly, in which attempts to save more (including attempts to reduce budget deficits) make everyone worse off – for a long time.’

GFW: To me this is The Great Credit Contraction at work. The more the economy and markets deflate, the greater the tendency to save and therefore the depression cycle continues to feed upon itself.

Krugman: ‘…evidence suggests that we have become an economy whose normal state is one of mild depression, whose brief episodes of prosperity occur only thanks to bubbles and unsustainable borrowing…’

GFW: No kidding Sherlock. The longer this goes on, the less mild the depression will be. The authorities creating bubbles based on unsustainable borrowings is not prosperity; it is lunacy.

Krugman: ‘Why might this be happening? One answer could be slowing population growth…’

GFW: Perhaps. But it could also be people have debt fatigue in addition to rising living costs and higher taxes from over-indebted governments.

Krugman: ‘Another important factor [for the mild depression] may be persistent trade deficits…’

GFW: This sounds like a call to arms for the currency war I mentioned last week.

In my opinion The Great Credit Contraction (GCC) has confounded many an economist. Deflating the credit bubble is deflating the economy.

The longer the GCC continues to tighten its grip on the global economy, the more I expect mainstream economic commentators to follow the lead of that other famous economist John Maynard Keynes, when he once said, ‘When the facts change, I change my mind. What do you do, sir?’

Vern Gowdie+
Chairman, Gowdie Family Wealth

Join Money Morning on Google+


By MoneyMorning.com.au

Monetary Policy Week in Review – Nov 25-29, 2013: 4 central banks cut while BOE rolls back housing support

By CentralBankNews.info
    Last week four central banks, among them Thailand, cut policy rates, maintaining the downward trend in global rates while Brazil raised its rate and the Bank of England (BOE) rolled back its support for the U.K. housing sector in the latest sign that the world’s sixth-largest economy is healing.
    Financial markets initially saw the BOE’s move as a sign of monetary tightening but its governor, Mark Carney, quickly poured cold water on that view, saying the shift to neutral in the bank’s support of home lending would in fact allow its policy rate to stay low for longer.
    The BOE’s decision “that additional stimulus for lending to households is no longer required” is significant in four ways:
    First, it comes two weeks after the BOE upgraded its view of the UK economy in its November inflation report with the implication that interest rates may be raised in 2015 rather than 2016.
    Second, it illustrates the new paradigm in central banking in which macro-prudential measures aimed at specific sectors, in this case housing, are used to maintain financial stability while the “really blunt tool” of policy rates (to quote Carney) is geared to the overall need of the economy.
    Third, it is the latest example of how authorities worldwide are taking action to avoid another housing bubble, whether policy measures are maximum loan-to-value ratios, changes to the risk weights for home loans or the outright prohibition of certain types of housing loans, for example loans for second or third houses.
    Fourth, it shows that central banks have to use forward guidance in conjunction with any change to policies, whether it’s macro-prudential measures or the size of quantitative easing, to ensure that financial markets don’t get ahead of themselves and price-in higher interest rates.

    Meanwhile, last week 12 central banks decided on their monetary stance with four banks (Thailand, Angola, Hungary and Albania) cutting rates, Brazil raising its rate and seven maintaining rates (Israel, Ghana, Fiji, Tunisia, Zambia, Colombia and Trinidad & Tobago).
     Thailand’s second rate cut of the year came as a surprise, partly because many emerging market central banks have been tightening policy to prevent capital outflows and currency instability in connection with the U.S. Federal Reserve’s likely tapering of asset purchases in the near future.
    But the Bank of Thailand, which has now cut rates by 50 basis points this year, is becoming more concerned about weak growth with domestic political unrest now starting to deter tourists and thus dent growth further.
    Hungary’s rate cut, its 16th in a row to 3.20 percent, was expected and the bank signaled further cuts, but there are signs that the easing cycle since August last year is coming to an end.
    Not only did the central bank governor in July point to 3.0 or 3.5 percent as a low point for rates, but Hungary’s forint currency is now being hit by worries that rates may end up being cut too much, exposing the currency to a sell-off when the Fed starts reducing asset purchases.
    In Brazil, the central bank raised its policy rate for the sixth time in a row to 10.0 percent, but omitted its usual reference to the policy decision helping ensure that the trend of lower inflation persists into next year.
    Though this was hardly a clear and transparent sign of the central bank’s thinking about the direction of rates, financial markets and economists saw it as signal that the pace of rate rises were coming to an end, probably after another hike in January.

    Through the first 48 weeks of this year, central banks have cut their policy rates 109 times, or 19.3 percent, of the 564 policy decisions taken by the 90 central banks followed by Central Bank News.
    This is marginally up from 19.0 percent the previous week, but down from 25.3 percent after the first half, reflecting the recent rate rises by some of the major emerging market central banks.
     Policy rates have been raised 26 times this year, or 4.6 percent of this year’s 564 policy decisions, slightly down from 4.7 percent after the first half of the year.
   
     LAST WEEK’S (WEEK 48) MONETARY POLICY DECISIONS:

COUNTRYMSCI     NEW RATE           OLD RATE         1 YEAR AGO
ISRAELDM1.00%1.00%2.00%
ANGOLA9.25%9.75%10.25%
HUNGARYEM3.20%3.40%6.00%
THAILANDEM2.25%2.50%2.75%
GHANA16.00%16.00%15.00%
BRAZILEM10.00%9.50%7.25%
ALBANIA3.25%3.50%4.00%
FIJI0.50%0.50%0.50%
TUNISIAFM4.00%4.00%3.75%
ZAMBIA9.75%9.75%9.25%
TRINIDAD & TOBAGO2.75%2.75%2.75%
COLOMBIAEM3.25%3.25%4.50%

    This week (week 49) nine central banks are scheduled to hold policy meetings, including Australia, Morocco, Canada, Poland, Norway, the United Kingdom, the European Central Bank, Egypt and Mexico.

COUNTRYMSCI             DATE CURRENT  RATE        1 YEAR AGO
AUSTRALIADM3-Dec2.50%3.00%
MOROCCOEM3-Dec3.00%3.00%
CANADADM4-Dec1.00%1.00%
POLANDEM4-Dec2.50%4.25%
NORWAYDM5-Dec1.50%1.50%
UNITED KINGDOMDM5-Dec0.50%0.50%
EUROSYSTEMDM5-Dec0.25%0.75%
EGYPTEM5-Dec8.75%9.25%
MEXICOEM6-Dec3.50%4.50%

    www.CentralBankNews.info

On your Mark, Get Set, GO! Volatility Start

Article by Investazor.com

on-your-mark-01.12.2013The race of economic publications will start from the first day of the week. As we know, the beginning of the month will be dedicated to the monetary policy meetings and also to a very important series of macroeconomic releases. These will most likely raise the forex market volatility and that it is why it important to be very attentive.

Calendar

Date

Currency

Forecast

Previous

SunDec 1

CNY

Manufacturing PMI

51.2

51.4

NZD

Overseas Trade Index q/q

3.00%

4.90%

MonDec 2

AUD

AIG Manufacturing Index

53.2

AUD

MI Inflation Gauge m/m

0.10%

JPY

Capital Spending q/y

3.10%

0.00%

AUD

Building Approvals m/m

-4.30%

14.40%

AUD

Company Operating Profits q/q

-0.80%

CNY

HSBC Final Manufacturing PMI

50.5

50.4

JPY

BOJ Gov Kuroda Speaks

AUD

Commodity Prices y/y

-1.00%

EUR

Spanish Manufacturing PMI

51.3

50.9

CHF

SVME PMI

55.1

54.2

EUR

Italian Manufacturing PMI

51.4

50.7

EUR

Final Manufacturing PMI

51.5

51.5

GBP

Manufacturing PMI

56.5

56

USD

Fed Chairman Bernanke Speaks

USD

Final Manufacturing PMI

54.3

54.3

USD

Construction Spending m/m

0.50%

0.60%

USD

ISM Manufacturing PMI

55.2

56.4

USD

Construction Spending m/m

0.40%

USD

ISM Manufacturing Prices

55

55.5

TueDec 3

JPY

Monetary Base y/y

47.20%

45.80%

NZD

ANZ Commodity Prices m/m

1.30%

GBP

BRC Retail Sales Monitor y/y

0.80%

AUD

Retail Sales m/m

0.40%

0.80%

AUD

Current Account

-11.1B

-9.4B

CNY

Non-Manufacturing PMI

56.3

JPY

Average Cash Earnings y/y

-0.20%

AUD

Cash Rate

2.50%

2.50%

AUD

RBA Rate Statement

EUR

Spanish Unemployment Change

44.3K

87.0K

GBP

Halifax HPI m/m

0.80%

0.70%

GBP

Construction PMI

59.3

59.4

EUR

PPI m/m

-0.10%

0.10%

USD

IBD/TIPP Economic Optimism

43.2

41.4

USD

Total Vehicle Sales

15.8M

15.2M

WedDec 4

AUD

AIG Services Index

47.9

GBP

BRC Shop Price Index y/y

-0.50%

AUD

GDP q/q

0.70%

0.60%

EUR

Spanish Services PMI

50.7

49.6

EUR

Italian Services PMI

51.2

50.5

EUR

Final Services PMI

50.9

50.9

ALL

OPEC Meetings

GBP

Services PMI

62.1

62.5

EUR

Retail Sales m/m

0.20%

-0.60%

EUR

Revised GDP q/q

0.10%

0.10%

USD

ADP Non-Farm Employment Change

174K

130K

CAD

Trade Balance

-0.7B

-0.4B

USD

Trade Balance

-40.3B

-41.8B

CAD

BOC Rate Statement

CAD

Overnight Rate

1.00%

1.00%

USD

ISM Non-Manufacturing PMI

55.4

55.4

USD

New Home Sales

432K

USD

New Home Sales

427K

421K

USD

Crude Oil Inventories

3.0M

USD

Beige Book

ThuDec 5

AUD

Trade Balance

-0.33B

-0.28B

JPY

10-y Bond Auction

0.61|3.7

GBP

Autumn Forecast Statement

GBP

Asset Purchase Facility

375B

375B

GBP

Official Bank Rate

0.50%

0.50%

GBP

MPC Rate Statement

USD

Challenger Job Cuts y/y

-4.20%

EUR

Minimum Bid Rate

0.25%

0.25%

CAD

Building Permits m/m

2.40%

1.70%

EUR

ECB Press Conference

USD

Prelim GDP q/q

3.10%

2.80%

USD

Unemployment Claims

322K

316K

USD

Prelim GDP Price Index q/q

1.90%

1.90%

CAD

Ivey PMI

60.2

62.8

USD

Factory Orders m/m

-0.70%

1.70%

USD

Natural Gas Storage

-13B

FriDec 6

AUD

AIG Construction Index

54.4

JPY

Leading Indicators

109.90%

109.20%

EUR

French Gov Budget Balance

-80.8B

EUR

French Trade Balance

-5.1B

-5.8B

CHF

Foreign Currency Reserves

434.7B

CHF

CPI m/m

-0.10%

-0.10%

GBP

Consumer Inflation Expectations

3.20%

EUR

German Factory Orders m/m

-0.40%

3.30%

CAD

Employment Change

7.6K

13.2K

CAD

Unemployment Rate

7.00%

6.90%

CAD

Labor Productivity q/q

0.50%

0.50%

USD

Non-Farm Employment Change

184K

204K

USD

Unemployment Rate

7.20%

7.30%

USD

Average Hourly Earnings m/m

0.20%

0.10%

USD

Core PCE Price Index m/m

0.10%

0.10%

USD

Personal Spending m/m

0.40%

0.20%

USD

Personal Income m/m

0.30%

0.50%

USD

Prelim UoM Consumer Sentiment

76.2

75.1

USD

Prelim UoM Inflation Expectations

2.90%

USD

FOMC Member Evans Speaks

USD

Consumer Credit m/m

14.6B

13.7B

SatDec 7

JPY

BOJ Gov Kuroda Speaks


On Monday Kuroda and Ben Bernanke are scheduled to speak, Australia will release the Building Approvals, UK the Manufacturing PMI and US the ISM Manufacturing. Tuesday Reserve Bank of Australia will announce the Cash Rate which will be followed by a statement.

Wednesday the eyes of the investors will be on the Australian GDP; Services PMI for UK; Trade Balance and Overnight rate for Canada; Trade Balance, ISM Non-Manufacturing, New Home Sales and maybe the most important the ADP Non-Farm Payrolls for the United States.

Thursday will be a very heavy day. Bank of England will announce their monetary policy with the Asset Purchases and the Official Bank Rate followed by a statement. The ECB will have the monetary policy followed by the press conference and the United States will release the Prelim GDP for the past quarter and the Unemployment Claims.

But the race is not over without Friday, when Canada will publish some labor market data and the United States will release the Unemployment Rate, Non-Farm Payrolls and not to forget about the Prelim UoM Consumer Sentiment.

The post On your Mark, Get Set, GO! Volatility Start appeared first on investazor.com.