Analysts Line Up to Declare “Decline & Fall” of Gold After 2.6% Tumble

London Gold Market Report

from Adrian Ash

BullionVault

Mon 2 Dec 08:25 EST

WHOLESALE gold trimmed Monday’s 2.6% loss in Asian and London trade Tuesday morning, with a brief rally to $1226 per ounce as world stock markets fell after Wall Street retreated from record highs.

 Gold priced in Euros dropped through €900 per ounce for the first time since July 2010.

 Silver failed to match the Dollar gold rally, hitting a new 5-month low of $19.09 per ounce.

 “The wheels seem to be coming off the gold market,” says one US broker’s note.

 “The yellow metal is at stake of loosing its grip in the run-up to year-end,” says a separate note from a London market-maker’s trading desk.

 “Our flow is dominated by sellers across the board. Producers, funds, [high-net worth individuals] and ETFs all are selling gold in anticipation of the Fed tapering as early as Dec. 18.”

 Maintaining their holdings even as the gold price fell 2.6% on Monday, the two largest US exchange-traded gold trust funds have so far shed one third of the bullion backing their shares in 2013, shrinking to the smallest level since Feb.2009.

 “We have no doubt that gold is in a bear market,” says the commodities team at Swiss investment bank Credit Suisse, repeating the view it first gave in February’s End of an Era report.

 “Financial bubbles tend to unwind faster than they inflate,” the bank’s analysts write in Gold: Decline & Fall.

 “If gold were to continue to retreat along its current trajectory, the metal would be trading close to $900 per ounce by the end of 2014.”

 “Regardless of the precise timing,” agrees French bank and London bullion market maker Societe Generale, forecasting an average gold price of $1050 in the final 3 months of 2014, “underpinning our negative view towards gold is that the ultraloose stance of monetary policy is gradually unwound.”

 Swiss investment bank and London market maker UBS yesterday cut its average 2014 forecast to $1200 per ounce from $1325, also pointing to a tightening of US monetary policy.

 A drop to $1050 could signal a “decent buying level”, says UBS analyst Joni Teves. But while “physical buyers are expected to provide some support at the lower levels, this is unlikely to be enough to fully offset the selling.”

 “Strong Chinese gold imports are being overpowered,” agrees Bart Melek at TD Securities in Toronto, “by sharply lower ETF demand.”

 The Canadian bank’s analyst also cites “worries expressed by highly leveraged speculative investors that the 14,700 tonnes of vaulted gold since 2002 may start hitting the market once real Treasury [bond interest] rates move materially higher.”

 Latest data from US regulator the CFTC yesterday showed speculative traders such as hedge funds raising their bearish betting on gold to a 4-month high in the week-ending last Tuesday.

 Net of those bearish bets, the so-called “Large Speculators” net bullish position in gold futures and options fell to 162 tonnes equivalent.

 That compares to the 3-year average of 497 tonnes.

 Smaller speculators trading gold on leverage through futures and options meantime cut their net bullishness last week to just 6 tonnes equivalent – the lowest level since early July’s negative reading.

 Dollar gold was then half-way through a 21% rally from 3-year lows.

 Private investors choosing to trade physical gold, in contrast, last month maintained their positive sentiment near a 6-month high says Bloomberg today, citing the latest Gold Investor Index from BullionVault.

 Amongst money managers, however, “Gold ETF holdings have failed to stabilise” after the spring collapse says Barclays.

 “Not really an attractive asset class at this stage,” said Mark Konyn, CEO of Cathay Conning Asset Management – part of the $83 billion Conning group – to CNBC overnight.

 Noting the drop in India’s formerly world-leading demand as anti-import rules hit in 2013, “The [investment] case for gold is an inflation hedge,” says Konyn. “But where’s the inflation globally?”

Adrian Ash

BullionVault

Gold price chart, no delay | Buy gold online


Adrian Ash is head of research at BullionVault, the secure, low-cost gold and silver market for private investors online, where you can fully allocated bullion already vaulted in your choice of London, New York, Singapore, Toronto or Zurich for just 0.5% commission.


(c) BullionVault 2013

Please Note: This article is to inform your thinking, not lead it. Only you can decide the best place for your money, and any decision you make will put your money at risk. Information or data included here may have already been overtaken by events – and must be verified elsewhere – should you choose to act on it.


GBPUSD: Bullish, Remains On The Offensive

GBPUSD: Bullish, Remains On The Offensive

GBPUSD: With GBP holding firmly above its broken resistance turned support at the 1.6259 level and seen reversing its Monday losses, further upside offensive is likely. Resistance resides at the 1.6450 level. A breach of here will aim at the 1.6500 level with a break of there triggering more strength. Further out, resistance stands at the 1.6550 level with a violation paving the way for a run at the 1.6550 level. Its daily RSI is bullish and pointing higher supporting this view. Conversely, support lies at the 1.6342 level followed by the 1.6259 level. A reversal of roles is expected to occur and turn the pair higher. However, if that is broken, expect further decline to push the pair lower towards the 1.6200 level and then the 1.6150 level. On the whole, GBP continues to retain its medium term upside offensive.

By fxtechstrategy.com


Gold Futures Near 34-month Low on Fed Speculations

By HY Markets Forex Blog

Gold futures were seen trading near its lowest level in 34 months on Tuesday as investors continue to speculate over the tapering of the Federal Reserve (Fed) stimulus program.

The yellow metal futures for February delivery declined 0.04% lower, standing at $1,221.40. Gold futures have been trading below $1,300 an ounce for over three weeks. While silver futures dropped 0.24% lower, standing at $19.255 an ounce at the time of writing.

Holdings in the world’s largest gold-backed exchange-traded fund, SPDR Gold Trust, came in at 843.21 tones on Friday.

The US dollar index, which measures the strength of the US dollar against a basket of six major currencies, remained unchanged at 80.926 points.

Gold Futures – US Data

The US manufacturing sector showed an improvement, advancing to a 33-month high of 57.3, up from 56.4 seen in October, according to reports from the Institute for Supply Management (ISM). The construction spending for October exceeded analysts’ expectations of 0.4%, rising to 0.8%. In September, construction spending dropped by 0.3% on a monthly basis.

US retail sales came in at $57.4 billion over the weekend, lower than last year’s figures of $59.1 billion with average shopper spending $407.02. Market participants are looking forward to the release of a string of key US data’s, including the third quarter gross domestic product (GDP), November non-farm payrolls and figures for the nation’s manufacturing sector.

The macroeconomic reports will reveal the current strength and condition of the world’s largest economy and could also predict how long the Federal Reserve will maintain its monthly purchases at its current pace.


Interested in trading Metals Online? 

Visit www.hymarkets.com and start trading today from only $50!

The post Gold Futures Near 34-month Low on Fed Speculations appeared first on | HY Markets Official blog.

Article provided by HY Markets Forex Blog

Crude Slightly Higher on Upbeat US & China Manufacturing

By HY Markets Forex Blog

Crude oil prices traded slightly higher in the early morning of the European session on Tuesday, after the release of an upbeat manufacturing data from both the US and China lifted prices.

West Texas Intermediate (WTI) crude futures rose 0.28% higher at $94.09 per barrel at the time of writing, while futures for the European benchmark Brent climbed 0.03% higher and trading at $111.50 per barrel.

Crude – Upbeat Data

The manufacturing sector in the US for November climbed to its highest since April 2011, according to the Purchasing Managers’ Index (PMI) survey posted by the Institute for Supply Management (ISM) on Monday.  Figures for the manufacturing PMI went up to 57.3, up from the reading of 56.4 seen in October.

The employment index rose by 3.3 percentage points to 56.5%, climbing from the previous month’s reading of 53.2% and marking the highest reading since April 2012. The new orders index edged up by 3 percentage points to 63.6% in November, while the production index advanced by 2 percentage points to 62.8%.

The Chinese HSBC Manufacturing PMI came in at 50.8 in the previous month, exceeding analysts’ forecast of 50.5. China’s non-manufacturing PMI surpassed analysts’ estimates of 55.4 and came in at 56.0.

The second forecast for the third quarter gross domestic product (GDP) for the US is expected to be released on Thursday, with estimates of a 3.1% increase from 2.8% in the previous quarter.

Employment data and a strong GDP are expected to be released from the US, which would possibly suppress oil prices.

Analysts are expecting the Federal Reserve to begin to scale-back on its bond-purchasing program sooner if an encouraging employment data is released.


Visit www.hymarkets.com  today and find out more on how you can how you can trade Energy products with only $50.

The post Crude Slightly Higher on Upbeat US & China Manufacturing appeared first on | HY Markets Official blog.

Article provided by HY Markets Forex Blog

Brent Oil Looks For Correction Before Turning Higher: Elliott Wave

Brent Oil: We don’t track this market much, but We know that most of the time it should move similar to Crude oil. However, this is not the case for the last few weeks (Brent was up, Crude down in November), so at this time each instrument should be tracked separately. Remember; lets focus on what is actually happening, and not on what we think it should be happening! On Brent We see a wedge pattern to the upside, counted as a leading diagonal in wave A so we expect a deeper three wave retracement in B, back to 107-108 region before uptrend resume for wave C up.

Brent Oil Elliott Wave Analysis 4h

Brent Oil

Written by www.ew-forecast.com

2 week trial


Forex Technical Analysis 03.12.2013 (EUR/USD, GBP/USD, USD/CHF, USD/JPY, AUD/USD, GOLD)

Article By RoboForex.com

Analysis for December 3rd, 2013

EUR/USD

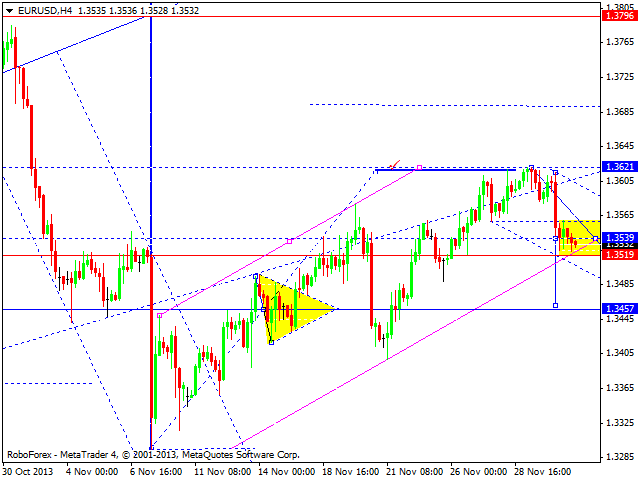
Euro is being corrected towards level of 1.3457; right now market is moving inside the third wave of this correction and forming consolidation channel to break ascending channel and continue falling down. We think, today price may reach target at 1.3462 and then return to level of 1.3540 to test it from below. Later, in our opinion, pair may form the fifth descending wave towards main target of this correction.

GBP/USD

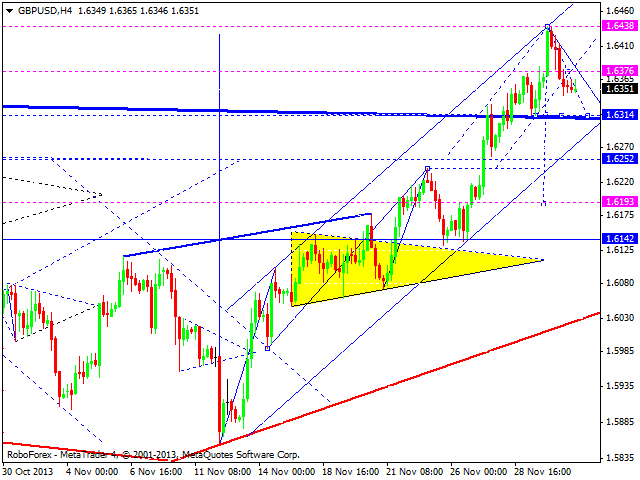
Pound formed the first descending impulse and right now is forming the second one; market is being corrected. Predicted target of the second impulse is at 1.6330. Later, in our opinion, pair may grow up to test 1.6376 from below and then form the third descending impulse with target at 1.6313 to test upper border of broken triangle pattern from weekly chart.

USD/CHF

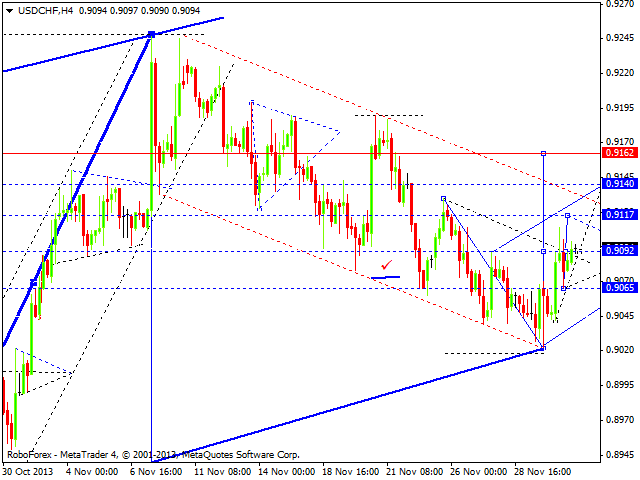
Franc continues moving upwards; market is being corrected towards level of 0.9162. Right now, pair is consolidating near 0.9092; this structure may be considered as continuation pattern of the third wave with target at 0.9140. Later, in our opinion, price may return to 0.9092 and start forming the fifth ascending wave to reach main target of this correction.

USD/JPY

Yen continues forming ascending structure. We think, today price may reach another resistance level at 103.60; it looks almost like double top pattern. Later, in our opinion, pair may start descending correction towards level of 99.70. After forming pivot point at the top, price may reverse and start falling down towards pattern’s bottom.

AUD/USD

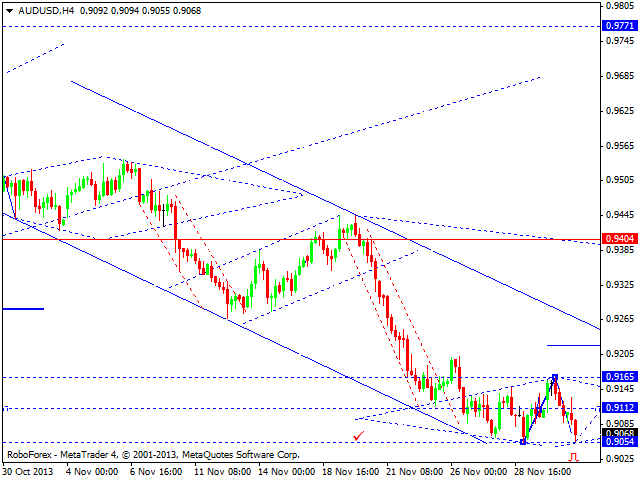
Australian Dollar is still consolidating near its minimum. We think, today price may grow up to reach level of 0.9112 and then continue moving upwards to break the top of this consolidation and start forming the fifth ascending wave. However, alternative scenario implies that price may break minimum. In this case, descending trend may continue without the fifth descending wave in the form of three-wave correctional structure.

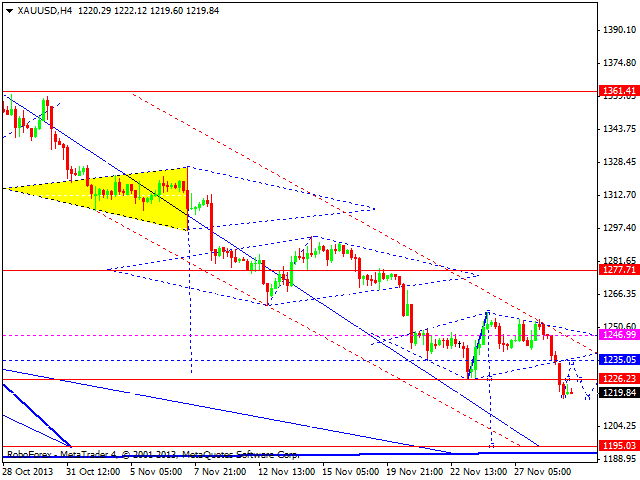
GOLD

Gold broke its consolidation channel downwards and continued falling down; target is at 1195. We think, today price may consolidate at current level for a while and then continue moving downwards to reach main target of this descending wave.

RoboForex Analytical Department

Article By RoboForex.com

Attention!
Forecasts presented in this section only reflect the author’s private opinion and should not be considered as guidance for trading. RoboForex LP bears no responsibility for trading results based on trading recommendations described in these analytical reviews.


Steel Stocks: Head Fake or Legitimate Breakout?

By WallStreetDaily.com

The world’s newest Nobel Prize-winning economist, Robert Shiller, didn’t mince words this weekend. He told Germany’s Der Spiegel magazine, “I am most worried about the boom in the U.S. stock market.”

Why? “Because our economy is still weak and vulnerable,” says Shiller.

While I don’t share his concerns about U.S. stocks (yet), I’ll concede that the economic recovery has been less than robust. Nowhere has this been more evident than in the steel industry.

Titans in the sector, like Nucor (NUE), are still struggling to recover. In the first nine months of 2013, sales and net income both decreased by roughly 14%. Compared to peak activity in 2008, Nucor’s sales and net income over the last 12 months remain 21% and 75% below their annual highs, respectively.

And yet share prices for Nucor and its peers – like U.S. Steel (X), AK Steel (AKS) and Steel Dynamics (STLD) – have been perking up lately. Take a look:

Is the Rally Too Good to be True?

Over the last three months, they’re all up by double-digit levels. Heck, the recent rallies by U.S. Steel and AK Steel make the S&P 500 Index’s gains for the entire year seem miniscule.

Is this the beginning of a legitimate recovery, or merely a head fake that should be ignored?

It’s time to find out and invest accordingly…

High Risk, High Reward?

Steel producers play a crucial role in the global economy, since the metal is used in everything from automobiles to bridge building. As such, steel companies can serve as an excellent harbinger of better economic times ahead, which brings us back to Shiller’s observation.

Even as the global economic recovery extends into its fifth year, steel demand remains lackluster at best.

Case in point: ArcelorMittal (MT), the world’s largest steel producer, recently reported a narrower loss for the third quarter. But the company said it was only “cautiously optimistic” about prospects for 2014.

Now, it’s hard to put much stock in that assessment. Earlier this year, the company assured investors that demand would be strong in 2013, and that has hardly come to fruition.

At the same time, the World Steel Association is only forecasting a modest 3.3% uptick in steel demand for 2014, compared to a 3.1% increase for this year.

Nevertheless, the analysts over at Goldman Sachs (GS) recently upgraded a trio of steel stocks from “Sell” to “Buy,” based on the outlook for stronger domestic demand. I wouldn’t follow their lead, though.

We’re heading into the traditionally weakest quarter for steel companies. Not to mention, the industry is still suffering from overcapacity.

What’s more, cheap foreign steel promises to keep a lid on any meaningful price increases – which, in turn, will dampen profitability.

Or as the analysts at Wells Fargo (WFC) put it, “We expect pricing to weaken meaningfully in H1 2014 due to increasing levels of import competition… [And we] believe there is now greater risk to 2014 estimates.”

Greater risk? That doesn’t sound like the makings of a legitimate recovery to me. And these aren’t the conditions necessary to support a prolonged rally in share prices.

Bottom line: I’m convinced that the latest price swings for steel stocks are merely a head fake. So a short-term correction promises to be close at hand.

If I’m wrong, so be it. Steel stocks have a long way to run before they get back to their 2008 peaks.

Unlike the S&P 500 that recouped all its losses and keeps hitting new all-time highs, the average steel stock is still off about 60% from its peak. So there will be plenty of time to “go long” steel stocks and still profit handsomely.

For now, let’s keep a close watch on the trend.

Ahead of the tape,

Louis Basenese


The post Steel Stocks: Head Fake or Legitimate Breakout? appeared first on Wall Street Daily.

Article By WallStreetDaily.com

Original Article: Steel Stocks: Head Fake or Legitimate Breakout?

Ichimoku Cloud Analysis 03.12.2013 (GBP/USD, GOLD)

Article By RoboForex.com

Analysis for December 3rd, 2013

GBP/USD

GBPUSD, Time Frame H4 – Indicator signals: Tenkan-Sen and Kijun-Sen are influenced by “Golden Cross” (1); all lines are horizontal. Ichimoku Cloud is going up (2), Chinkou Lagging Span is above the chart, and price is on Tenkan-Sen. Short‑term forecast: we can expect the price to grow up, enter Tenkan-Sen – Kijun-Sen channel, and then stay inside it.

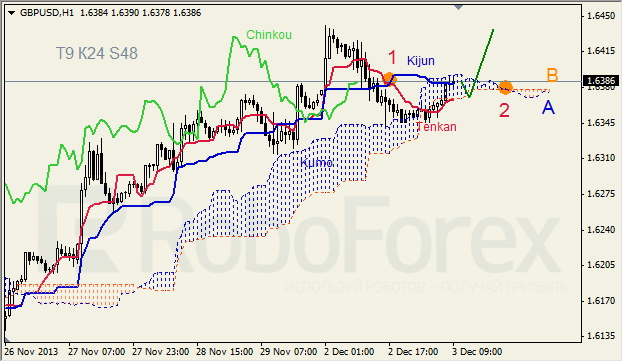
GBPUSD, Time Frame H1 – Indicator signals: Tenkan-Sen and Kijun-Sen intersected above Kumo Cloud and formed “Dead Cross” (1); all lines are horizontal. Ichimoku Cloud is closed; Chinkou Lagging Span is close to the chart, and price is inside Kumo Cloud, on Kijun-Sen. Short‑term forecast: we can expect support from Tenkan-Sen – Senkou Span B and growth of the price.

GOLD

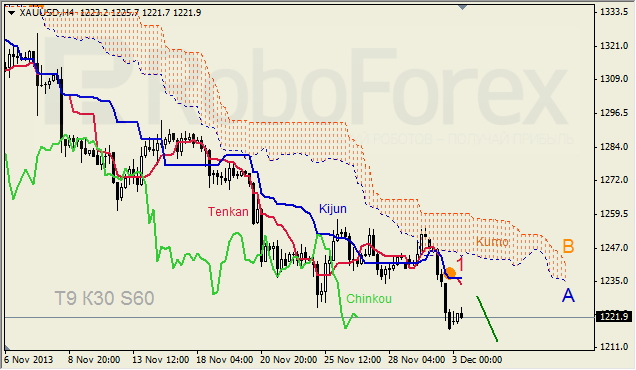
XAUUSD, Time Frame H4 – Indicator signals: Tenkan-Sen and Kijun-Sen intersected below Kumo Cloud and formed “Dead Cross” (1); Kijun-Sen is horizontal, other lines are directed downwards. Ichimoku Cloud is going down (2), Chinkou Lagging Span is above the chart, and the price is below the lines.  Short‑term forecast: we can expect resistance from Tenkan-Sen and decline of the price.

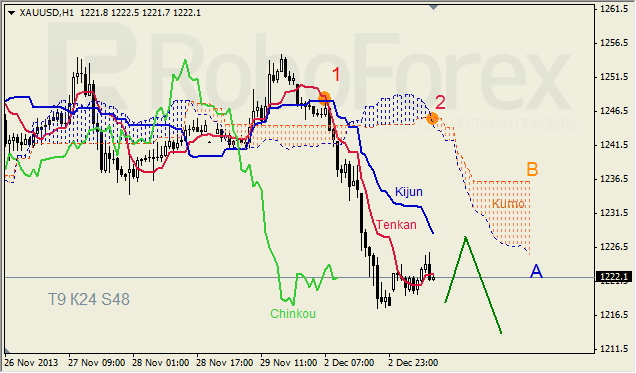
XAUUSD, Time Frame H1 – Indicator signals: Tenkan-Sen and Kijun-Sen are influenced by “Dead Cross” (1); Kijun-Sen and Senkou Span A are directed downwards, other lines are horizontal. Ichimoku Cloud is going down (2), Chinkou Lagging Span is below the chart, and price is on Tenkan-Sen. Short‑term forecast: we can expect resistance from Kijun-Sen and decline of the price.

RoboForex Analytical Department

Article By RoboForex.com

Attention!
Forecasts presented in this section only reflect the author’s private opinion and should not be considered as guidance for trading. RoboForex LP bears no responsibility for trading results based on trading recommendations described in these analytical reviews.


Australia holds rate, repeats A$ “uncomfortably high”

By CentralBankNews.info
    Australia’s central bank held its benchmark cash rate steady at 2.50 percent, as expected, and repeated that the Australian dollar remains “uncomfortable high” and a “lower level of the exchange rate is likely to be needed to achieve balanced growth in the economy.”
    The Reserve Bank of Australia (RBA), which has cut its cash rate 50 basis points this year and by 225 points since embarking on its easing cycle in November 2011, also repeated last month’s view that sentiment in households and businesses had improved “but it is still unclear how persistent this will be” and public spending was forecast to be quite weak.
    The impact of the RBA’s rate cuts since late 2011 have supported spending on interest-sensitive items and asset values, but “the full effects of these decisions are still coming through, and will be for a while yet,” the RBA said.
    Australia’s economy has been hit by lower investment in the huge mining industry from reduced demand from China and the central bank said economic growth and high unemployment is likely to persist in the near term as the economy adjusts to these lower levels of mining investment.

    Last month the RBA reduced its 2014 growth estimate to between 2 percent and 3 percent from its August forecast of 2.5 to 3.5 percent. The growth estimate for 2013 was trimmed in August to 2.25 percent from an earlier 2.50 percent. In 2012 the economy grew by 3.7 percent.
    In the second quarter, Australia’s Gross Domestic Product expanded by 0.6 percent from the first for annual growth of 2.6 percent, up from 2.5 percent in the first but down from 3.1 percent in the fourth.
    The central bank has been openly expressing its wish for a lower Australian dollar – known as the Aussie – for months and in November the RBA sharpened its language and described the currency’s level as “uncomfortably high” whereas it had previously just said the Aussie was “high.”
    After trading above parity to the U.S dollar most of the time since early 2011 and then through the first four months of the year, the Aussie weakened in early May in response to the RBA’s first rate cut.
    But it then rebounded in September and October in light of improving economic data. But it resumed its decline in early November and was trading around $0.90 today, down 13.5 percent from the beginning of the year.
    Two weeks ago Glenn Stevens, RBA governor, said he was “open-minded” on whether to intervene in foreign exchange markets and push down the Aussie. But a few days later, the RBA’s deputy governor dampened speculation that the reserve bank was ready to intervene, saying the threshold for intervening was “fairly high.” The last time the RBA intervened in currency markets was in late 2008 following the collapse of Lehman Brothers.
    Australia’s inflation rate eased to 2.2 percent in the third quarter from 2.4 percent and the RBA said this was consistent with its medium-term target and it expects this to remain the case over the next one to two years. The RBA targets 2-3 percent inflation.
   
    www.CentralBankNews.info

USDCHF is facing trend line resistance

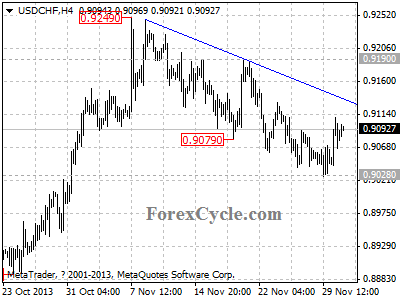
USDCHF is facing the resistance of the downward trend line on 4-hour chart. A clear break above the trend line resistance will indicate that the downtrend from 0.9249 had completed at 0.9028 already, then the following upward movement could bring price back to 0.9450 area. On the downside, as long as the trend line resistance holds, the rise from 0.9028 would possibly be consolidation of the downtrend from 0.9249, and one more fall to 0.8950 – 0.9000 area is still possible.

usdchf

Provided by ForexCycle.com