Complimentary Report: 15 Charts that Tell the Story of What’s Coming in 2014

Dear Reader,

I may not be Santa Claus, but I have an early present for you this year. It’s actually 15 presents in the form of 15 charts of financial markets with analysis by Bob Prechter, the president of Elliott Wave International.

He created these charts – which cover markets like the S&P 500, NASDAQ, gold, and mutual funds – to explain where financial markets have been and where they are headed. These are not your typical price charts. They combine history and patterns to tell the story clearly, all from his distinctly different point of view. With this information, his Elliott Wave Theorist subscribers are now prepared for 2014. And you can be, too, because you can get the full 10-page issue, FREE.

Elliott Wave International hasn’t offered a free issue from Bob in quite some time, but they feel that the message of this issue is extremely important and can provide you with an outlook for 2014 that you shouldn’t miss.

Prechter says that “charts tell the truth.” Here is your chance to see what truths these charts are telling. If a picture is worth a thousand words, then this publication is like reading more than 15,000 words of his market analysis.

Pointer: Be sure to check out one of the coolest charts, which shows how Main Street investors actually see the markets better than Wall Street.

Download your free 10-page issue of The Elliott Wave Theorist now.


P.S. It’s a once-in-a-blue-moon opportunity. And it’s free. See these 15 charts for yourself now.


About the Publisher, Elliott Wave International

Founded in 1979 by Robert R. Prechter Jr., Elliott Wave International (EWI) is the world’s largest market forecasting firm. Its staff of full-time analysts provides 24-hour-a-day market analysis to institutional and private investors around the world.


Outside the Box: Half & Half: Why Rowing Works

By John Mauldin – Outside the Box: Half & Half: Why Rowing Works

For today’s special Christmas Eve Outside the Box, my good friend Ed Easterling brings us pearls of wisdom on the subject of rowing vs. sailing. “Rowing?” you ask. “Sailing?” And, you’re thinking, “I would surely prefer to be a sailor.” Well, not so fast. Let Ed explain why putting your back into your investing process can pay off handsomely. A nice piece to think about as you are mashing the potatoes or icing the cake. You can see more of Ed’s marvelous work at www.crestmontresearch.com.

Sometimes with all the news of disasters, wars, and plagues, we forget that the human experiment is still fundamentally intact and advancing. My great friend Louis Gave shot me a note sharing this optimistic thought in his Christmas greeting:

The United Nations recently released a heartening update on its ‘millennium goals’ for the developing world, with many of its 2015 targets on the way to being met, or indeed already met. The target to halve the number of people living on less than US$1.25 per day was achieved in 2010; the proportion of undernourished people fell from 23% of the developing world in 1990-92 to under 15% in 2010-2012; more than 2 billion people gained access to improved sources of drinking water. The list goes on but suffice to say that never in history have so many people across the globe lived so comfortably. This reflects the fact that with global GDP set to exceed US$74 trillion this year, never has the world produced this much.

New energy production (and new forms of energy), robotics, nanotech, the second (or is it the third?) wave of the communications revolution, and the amazing discoveries in biotech are all unfolding before our eyes. Global trade is expanding, and slowly but surely governments are changing. An ebb and flow thing, to be sure, but the tide is clearly lifting more boats than ever.

Just this morning I read of a new type of muscle/motor that is amazingly small yet 50 times more powerful than human muscle, a potential new cancer drug/cure going into human trials next quarter, and another breakthrough in computer cycle speeds. Moore’s Law is safe for a few years!

But the old values are unchanging, of course. And they are still the ones that bring us true pleasure and joy. The love of family and friends, those deep conversations that bring insight and clarity, a well-told story, and a perfect tomato. A new TV may amaze, but the light in a child’s face brings a joy that is unmatchable.

Thanks for sharing this past year with me. I value your time and attention, in a world where our time is increasingly focused on more and more “stuff” and where we seem to be drinking information through a fire hose, constantly confronted with facts and “knowledge” rather than savoring the flavors of wisdom and insight.

This week I cook twice, with most of the family coming for Christmas Day and then the “official” family Christmas on Saturday when all the kids can come in and be together. And you enjoy your holidays as well!

Your feeling content analyst,

John Mauldin, Editor
Outside the Box
[email protected]

Stay Ahead of the Latest Tech News and Investing Trends…

Click here to sign up for Patrick Cox’s free daily tech news digest.

Each day, you get the three tech news stories with the biggest potential impact.


Half & Half: Why Rowing Works

By Ed Easterling

December 23, 2013

Copyright 2013, Crestmont Research (www.CrestmontResearch.com)

So you’re in line at Starbucks. The guy in front of you orders a drink that takes longer to explain that it does to consume. You want a drip…with room in the cup for milk. Then YOU take longer to decide whether it’ll be cream, half and half, or some watered-down version of the natural product from cows. Decisions, decisions…

This article addresses two key questions for investors today: why do secular stock market cycles matter and how can you adjust your investment approach to enhance returns? The primary answer to the first question is that the expected secular environment should drive your investment approach. The investment approach that was successful in the 1980s and 1990s was not successful in the 1970s nor over the past fourteen years. Therefore, an insightful perspective about the current secular bear will determine whether you have the right portfolio for investment success over the next decade and longer.

Now, assume for a moment that you must pick one of two investment portfolios. The first is designed to return all of the upside—and all of the downside—of the stock market. The second is structured to provide one-half of the upside and one-half of the downside. Which would you pick? Which of the two would you have preferred to have over the past fourteen years, since January 2000? (Note: the S&P 500 Index is up 23% over that period.) In a secular bull market, the first portfolio—with all of the ups and downs—will be most successful. In a secular bear market, however, the second portfolio of half and half is essential. More about this shortly—and the insights may surprise you!

SECULAR STOCK MARKET CYCLES

Why should anyone take the time to assess the secular environment when investors are so focused on next quarter’s (or month’s!) account statement?

Steven Covey writes in Seven Habits of Highly Successful People:

Once a woodcutter strained to saw down a tree. A young man who was watching asked “What are you doing?”

“Are you blind?” the woodcutter replied. “I’m cutting down this tree.”

The young man was unabashed. “You look exhausted! Take a break. Sharpen your saw.”

The woodcutter explained to the young man that he had been sawing for hours and did not have time to take a break.

The young man pushed back… “If you sharpen the saw, you would cut down the tree much faster.”

The woodcutter said “I don’t have time to sharpen the saw. Don’t you see I’m too busy?”

Too often, we are so focused on the task at hand that we lose sight of taking the actions that are necessary to best achieve our goal. With investments, the goal is to achieve successful returns over time. We should not be distracted by a focus on this week or month; we need successful returns over our investment horizons—which often extend for a decade or two…or more.

And this is where Starbucks, Covey, and secular cycle strategies converge. Investors are too often tempted to focus on immediate returns. In periods of secular bull markets, that’s fine. But today, in a secular bear market, reach for the half and half. Take the time to assess the goal, as Covey emphasizes, and sharpen your investment strategy.

DON’T ACCEPT BREAKEVEN

Over the past 14 years since 2000, investors have repeatedly learned the lesson of falling back to, or recovering up to, breakeven in the market. While there’s no better feeling than coming from behind to breakeven, it’s a very bad feeling to watch a gain wither to a loss. But investors did not need to experience the same rollercoaster performance in their investment portfolios that the overall market traversed.

Some portfolios—generally it’s the ones that are indexed to the market using exchange-traded funds (ETFs) or mutual funds—have “participated” in the market’s ups and downs. That’s fine; such simple participation is what those funds are designed for. And that works great in secular bull markets like those of the 1980s and 1990s. But it does not work well in secular bear markets like today’s.

To illustrate, assume that the market drops by 40% and then recovers by surging 67%. An investor with $1,000 will decline to $600 and then recover to $1,000. So if you take the full cream option—all that the market gives—the illustrated cycle provides a breakeven outcome.

Chapter 10 of Unexpected Returns: Understanding Secular Stock Market Cycles (which has just been published in most eBook formats like Kindle, iPad, and Nook) contrasts the concept of a more actively managed and diversified approach to the more passive, buy-and-hold approach to investing. The chapter explores the concepts with the boatman’s analogy of “rowing” versus “sailing.”

Sailing is analogous to the passive investment approach of buy-and-hold—the use of ETFs and certain mutual funds to get what the market provides. Rowing, on the other hand, seeks to capitalize on skill and active management. Rowing uses diversification, investment selection, and investment skill to limit the downside while accepting limits on the upside. When the stock market plunges, portfolios built by rowing generally experience only a fraction of the losses suffered by those dependent on sailing. The expectation, however, should be that the “rowing” portfolios will also experience (only) a fraction of the gains.

The investment industry analyzes such fractional performance by assessing the so-called down-capture and up-capture of securities or portfolios. In other words, when the stock market declines, down-capture is the percentage of the decline that is reflected in your portfolio. If your portfolio declines ten percent when the market drops twenty percent, then your portfolio has a down-capture of fifty percent. Likewise, for market gains, up-capture is the relative percentage of your gains to the market’s gains.

During choppy, volatile, secular bear markets, most investors want little or none of the declines, but they want much or all of the gains. Beat the market! Other than for the luckiest of the market timers (which usually enjoy such success for fairly short periods of time), such a strategy is not realistic over most investment horizons. There is a more realistic expectation, however, that does fit with many risk-managed and actively managed portfolios.

USE THE HALF & HALF

Returning to the previous illustration, a portfolio structured to limit downside risk while participating in the upside would have fared better than breakeven. Although most investors seek somewhat less than half of the downside while achieving somewhat more than half of the upside, let’s assume that you have a half and half portfolio—50% down-capture and 50% up-capture. As the market falls 40%, your portfolio declines 20%—from $100 to $80. Then as the market recovers 67%, your portfolio rises by just over 33%. Your $80 increases to almost $107. So while the market portfolio gyrated from $100 to $60 and back to $100, your portfolio progression was $100, $80, and then $107.

Even better, consider the impact across multiple short-term cycles. The typical secular bear market has multiple cyclical phases—and there will be more of these cycles before the current secular bear is over. The effect of multiple cycles on the “rowing” portfolio is cumulatively compounding gains while the result for the “sailing” portfolio is recurring breakeven. The second cycle (using the same assumptions) drives the “rowing” portfolio from $107 to $85 and then to $114. The score after the third cycle: Mr. Market = $100 and your portfolio = $121. Three cycles of breakeven for the market still results in breakeven—you can’t make up for it with volume.

Of course, skeptics will respond that there’s often a difference between theoretical illustrations and empirical experience. Further, the S&P 500 Index has, at least at this point, increased 23% from the start of this secular bear in 2000. Yet the disproportionate impact of losses over gains is a formidable power.

As reflected in Figure 1, the S&P 500 Index started this secular bear market at 1469 and then took an early dive, ending 47% lower at 777 in October 2002. Five years later, the S&P 500 Index peaked at 1,565—up 101% from its low. By March 2009 the S&P 500 had sunk by 57% to 667. Now, four and a half years later, we are up 167% to 1,805. Cumulatively, the buy-and-hold portfolio (excluding dividends and transaction costs) is up 23% over the 14-year investment period.

For the alternative approach, let’s divide the percentage moves in half and apply them to your portfolio: -23.6%, +50.7%, -28.4%, and +83.5%. Your initial investment of $1,000 declined to $764 in less than two years. With half of the market’s gains, your portfolio climbed to $1,152 five years later. Then, applying just half of the subsequent market decline, your gain sank to a loss of $825. Ouch!… a gain yields to a loss. Note, however, that while the market found its bottom below its 2002 trough, your portfolio is nicely above its previous dip. For now, accept that consolation prize.

Figure 1. Half & Half vs. The Market

Then, with just half of the market’s gains over the past five years, your portfolio again advances to new highs. Over the secular bear cycle-to-date, the market is up 23%, compounding at a modest 1.5% annually. Yet your portfolio is up 51%, providing twice the compounded gain. With dividends and other income from your “rowing” portfolio, you have solid real (inflation-adjusted) returns.

Some people will focus on a shorter-term view, given the current economic, financial, and political uncertainties. They will reject a horizon of fourteen years and say that one cycle is not enough to benefit from a more hedged and diversified approach.

Interestingly, it doesn’t take numerous cycles to realize the benefit of the more hedged “rowing” approach. In the first cycle in Figure 1 (the early 2000s), market followers ended up 6.5%, while the rowing crew lapped them at 15.2%. In the most recent cycle, which includes 167% market gains since the bottom in 2009, buy-and-hold boosted portfolios by 15.4% while the harder working “rowing” investors currently lead with 31.4%.

The hedged “rowing” portfolio not only worked over the past fourteen years, it was successful over the course of the previous secular bear market from 1966 to 1981. After that sixteen years of secular bear, the S&P 500 Index portfolio showed gains of 33%, while the “rowing” portfolio had delivered 44%.

Keep in mind that there are many ways to structure a “rowing” portfolio. It is beyond the scope of Unexpected Returnsand Crestmont Research to develop or present specific alternatives. Nonetheless, rowing-based portfolios often consider—and include when attractively valued—a variety of components, including but not limited to: specialized stock market investments (e.g., actively-managed, high-dividend, covered calls, long/short equity, actively-rebalanced, preferred stocks, etc.), specialized bond investments (e.g., actively-managed, convertible bonds, inflation-protected securities, principal-protected notes, etc.), alternative investments (e.g., master limited partnerships, royalty trusts, REITS, commodity funds/advisors, private equity, hedge funds, timber, etc.), annuities, variable life, and others.

Clearly, some people will be skeptical about structuring portfolios to achieve (or improve upon) fifty percent up and down capture. Others will be looking for this article to present proof of a system that will lock in those results; it does not. But many others will relate today’s discussion to their own or their advisor’s experience. For the last group, this discussion intends to reinforce that good performance is not coincidence; rather it is the product of applying skill to portfolios that historically relied solely upon risk for return.

HOW IT WORKS

Market portfolios are outperformed by hedged portfolios in secular bear markets because of the disproportionate impact of losses in relation to the gains required to recover losses. Most significantly, as the magnitude of the loss increases, the required recovery gain exponentially increases.

In secular bull markets, on the other hand, gains significantly overpower losses. So although cyclical swings deliver the occasional “correction,” the recoveries far exceed the losses. The result is that above-average returns from sailing cumulatively exceed those from hedged rowing. In secular bear markets, however, gains across the secular period are cumulatively fairly modest or nonexistent. The result is that losses during secular bears well overpower the gains. Hedge portfolios mitigate some of the negative effects and enable investors to cumulatively succeed.

Figure 2 presents graphically the dynamic of offsetting gains and losses. As the losses increase, the required gain to reach breakeven exponentially increases. To illustrate the half and half effect within hedged portfolios, note that the required gain for a 20% loss is 25% and the required gain for a 40% loss is 67%. Those two points are chosen because 20% is half of 40%, consistent with the earlier “half and half” illustrations. Note that you will see the same effect with 10% and 20% or with 30% and 60%, etc.

Figure 2. The Impact of Losses

While the market investor needs 67% to recover from his 40% loss, the hedged investor only needs 25% to recover from one-half of the 40% loss (i.e., 20%). Yet when the hedged investor receives half of the market’s recovery, 33% from the near 67% surge, the hedged investor has exceeded the required 25% recovery return. As a result, the hedged investor achieves a net gain across the cycle.

So the gains from a hedged portfolio are not coincidental to the recent five years, fourteen years, or the secular bear market of the 1960s and ’70s. The gains occur whenever overall market gains are muted—in every secular bear market.

The current secular bear market has quite a way to go. The normalized price/earnings ratio (P/E) for the overall market is relatively high. The past fourteen years worked off the bubble levels from the late 1990s, but P/E has not declined to levels that are required to drive a secular bull market. A more detailed discussion and dramatic graphics can be found in an article titled “Nightmare on Wall Street” at www.CrestmontResearch.com.

YIELDING TO TEMPTATION

For some people, looking back fourteen years seems like an eternity. Needless to say, those same people are the most skeptical about analyzing a century of secular stock market cycles. They are also the most susceptible after the past five years to Siren’s call to overweight equities today. Yet a market that has run up substantially is more susceptible to correction or decline than it was before its surge. The trend is not always your friend. One of the documented weaknesses of human nature in investors is the tendency to ride winners despite their waning fundamentals (and sell some losers despite their newly attractive fundamentals).

Isn’t it ironic—in a Gary Larson Far Side kind of way—that the investor sticking his neck out may not be the tortoise-like rowing investor after all?!

So although the temptation to follow the momentum of 2013 might drive an overweighting of equities, this may be just the time to consider leaning away from passive buy-and-hold strategies in the market. We may soon be approaching the start of the next cycle—from the top.

Ed Easterling is the author of Probable Outcomes: Secular Stock Market Insights and the award-winning Unexpected Returns: Understanding Secular Stock Market Cycles. He is President of an investment management and research firm, and a Senior Fellow with the Alternative Investment Center at SMU’s Cox School of Business, where he previously served on the adjunct faculty and taught the course on alternative investments and hedge funds for MBA students. Mr. Easterling publishes provocative research and graphical analyses on the financial markets at http://www.CrestmontResearch.com.

Like Outside the Box?
Sign up today and get each new issue delivered free to your inbox.
It’s your opportunity to get the news John Mauldin thinks matters most to your finances.

© 2013 Mauldin Economics. All Rights Reserved.
Outside the Box is a free weekly economic e-letter by best-selling author and renowned financial expert, John Mauldin. You can learn more and get your free subscription by visiting www.MauldinEconomics.com.
Please write to [email protected] to inform us of any reproductions, including when and where copy will be reproduced. You must keep the letter intact, from introduction to disclaimers. If you would like to quote brief portions only, please reference www.MauldinEconomics.com.
To subscribe to John Mauldin’s e-letter, please click here: http://www.mauldineconomics.com/subscribe
To change your email address, please click here: http://www.mauldineconomics.com/change-address

Outside the Box and MauldinEconomics.com is not an offering for any investment. It represents only the opinions of John Mauldin and those that he interviews. Any views expressed are provided for information purposes only and should not be construed in any way as an offer, an endorsement, or inducement to invest and is not in any way a testimony of, or associated with, Mauldin’s other firms. John Mauldin is the Chairman of Mauldin Economics, LLC. He also is the President of Millennium Wave Advisors, LLC (MWA) which is an investment advisory firm registered with multiple states, President and registered representative of Millennium Wave Securities, LLC, (MWS) member FINRA, SIPC, through which securities may be offered . MWS is also a Commodity Pool Operator (CPO) and a Commodity Trading Advisor (CTA) registered with the CFTC, as well as an Introducing Broker (IB) and NFA Member. Millennium Wave Investments is a dba of MWA LLC and MWS LLC. This message may contain information that is confidential or privileged and is intended only for the individual or entity named above and does not constitute an offer for or advice about any alternative investment product. Such advice can only be made when accompanied by a prospectus or similar offering document. Past performance is not indicative of future performance. Please make sure to review important disclosures at the end of each article. Mauldin companies may have a marketing relationship with products and services mentioned in this letter for a fee.

Note: Joining The Mauldin Circle is not an offering for any investment. It represents only the opinions of John Mauldin and Millennium Wave Investments. It is intended solely for investors who have registered with Millennium Wave Investments and its partners at http://www.MauldinCircle.com (formerly AccreditedInvestor.ws) or directly related websites. The Mauldin Circle may send out material that is provided on a confidential basis, and subscribers to the Mauldin Circle are not to send this letter to anyone other than their professional investment counselors. Investors should discuss any investment with their personal investment counsel. You are advised to discuss with your financial advisers your investment options and whether any investment is suitable for your specific needs prior to making any investments. John Mauldin is the President of Millennium Wave Advisors, LLC (MWA), which is an investment advisory firm registered with multiple states. John Mauldin is a registered representative of Millennium Wave Securities, LLC, (MWS), an FINRA registered broker-dealer. MWS is also a Commodity Pool Operator (CPO) and a Commodity Trading Advisor (CTA) registered with the CFTC, as well as an Introducing Broker (IB). Millennium Wave Investments is a dba of MWA LLC and MWS LLC. Millennium Wave Investments cooperates in the consulting on and marketing of private and non-private investment offerings with other independent firms such as Altegris Investments; Capital Management Group; Absolute Return Partners, LLP; Fynn Capital; Nicola Wealth Management; and Plexus Asset Management. Investment offerings recommended by Mauldin may pay a portion of their fees to these independent firms, who will share 1/3 of those fees with MWS and thus with Mauldin. Any views expressed herein are provided for information purposes only and should not be construed in any way as an offer, an endorsement, or inducement to invest with any CTA, fund, or program mentioned here or elsewhere. Before seeking any advisor’s services or making an investment in a fund, investors must read and examine thoroughly the respective disclosure document or offering memorandum. Since these firms and Mauldin receive fees from the funds they recommend/market, they only recommend/market products with which they have been able to negotiate fee arrangements.

PAST RESULTS ARE NOT INDICATIVE OF FUTURE RESULTS. THERE IS RISK OF LOSS AS WELL AS THE OPPORTUNITY FOR GAIN WHEN INVESTING IN MANAGED FUNDS. WHEN CONSIDERING ALTERNATIVE INVESTMENTS, INCLUDING HEDGE FUNDS, YOU SHOULD CONSIDER VARIOUS RISKS INCLUDING THE FACT THAT SOME PRODUCTS: OFTEN ENGAGE IN LEVERAGING AND OTHER SPECULATIVE INVESTMENT PRACTICES THAT MAY INCREASE THE RISK OF INVESTMENT LOSS, CAN BE ILLIQUID, ARE NOT REQUIRED TO PROVIDE PERIODIC PRICING OR VALUATION INFORMATION TO INVESTORS, MAY INVOLVE COMPLEX TAX STRUCTURES AND DELAYS IN DISTRIBUTING IMPORTANT TAX INFORMATION, ARE NOT SUBJECT TO THE SAME REGULATORY REQUIREMENTS AS MUTUAL FUNDS, OFTEN CHARGE HIGH FEES, AND IN MANY CASES THE UNDERLYING INVESTMENTS ARE NOT TRANSPARENT AND ARE KNOWN ONLY TO THE INVESTMENT MANAGER. Alternative investment performance can be volatile. An investor could lose all or a substantial amount of his or her investment. Often, alternative investment fund and account managers have total trading authority over their funds or accounts; the use of a single advisor applying generally similar trading programs could mean lack of diversification and, consequently, higher risk. There is often no secondary market for an investor’s interest in alternative investments, and none is expected to develop.


Elliott Wave Analysis For OIL And E-mini S&P500

OIL- Corrective Rally

Crude oil is still trading to the upside towards $100 per barel. It seems that move from 96.20 is in five waves so we adjusted the wave count as market could already be making wave C, final leg of wave 4) that could turn down from 100-101 resistancea area.

OIL 4h Elliott Wave Analysis

E-mini S&P500 – Wave (v) In Progress

S&P500 is trading nicely higher from 1753 where we called end of a flat in wave (iv). Price is already at new all time highs so wave (v) is underway that should be made by five smaller waves. At the moment we see price at 261.8% extension level of wave i) so we think that sooner or later price will make a pullback in wave iv) before uptrend resumes up into five of five.

E-mini S&P500 4h Elliott Wave Analysis

Written by www.ew-forecast.com


2013’s Best of Friday Charts

By WallStreetDaily.com

Wall Street Daily readers often rejoice when Friday rolls around.

As most of you know by now, it’s when we let some carefully selected charts do (most of) the talking for us. And based on the amount of praise it gets, I’m getting more and more concerned that the Wall Street Daily Nation doesn’t know how to read.

Now, since it’s such a popular weekly edition, it wasn’t easy narrowing them down to the top five of the year.

So you can rest assured that the following posts represent the hands-down most provocative chart editions we could find.

Enjoy!

Killer Chart #5:
Using “Redneck Intelligence” to Gauge the Economy’s Health

If you live anywhere in the South, you might be accused of being a redneck if you own a pickup truck. (I know, because it’s happened to me.) Chances are, though, that you’re a small business owner, too. As I had noted before, small business owners account for a large portion of pickup sales, particularly Ford (F) F-Series trucks. That means, by gauging sales of F-Series trucks, we can track the health of the economy. And based on this chart, there was no mistaking the underlying trend back in May.

Killer Chart #4:
Ballmer’s Resignation Letter Summarized in a Single Image

When Microsoft (MSFT) CEO Steve Ballmer retired, we shared a chart that could have doubled as his resignation letter. In short, he completely missed out on the biggest technological shift in our generation – away from personal computers and toward smartphones. Ouch!

Killer Chart #3:
The Most Outrageous Economic Stimulus Plan Ever

In February, I showed you the most alternative economic stimulus plan out there: Americans with jobs should stop working so hard, so Americans without jobs can finally get one. Why? Because research out of Deutsche Bank had demonstrated that declines in productivity do, indeed, lead to hiring booms. In other words, go ahead and take an extra-long lunch break today in the name of economic stimulus!

Killer Chart #2:
3,907 Stocks Suddenly Vanish Overnight

Last month, we investigated the sudden disappearance of nearly 4,000 stocks since 1997. And they weren’t being replaced via initial public offerings. Despite the disappearing acts, though, the total market value of all publicly traded stocks since 1997 had increased 2.4%, to $21.4 trillion. In other words, we were seeing more money chasing after fewer opportunities, which naturally leads to higher prices and price-to-earnings ratios.

Killer Chart #1:
R.I.P Bitcoin… It’s Been Real

It’s no surprise that Bitcoin has dominated our top five categories this year. Investors just can’t seem to get enough of the dreaded cryptocurrency. Hopefully this chart acted as a wake-up call for some of you!

Did your favorite chart make the cut? Let us know by leaving a comment on our website.

Plus, be sure to tune in Monday for the next five articles to make Wall Street Daily’s 2013 hall of fame.

Ahead of the tape,

Louis Basenese

The post 2013’s Best of Friday Charts appeared first on Wall Street Daily.

Article By WallStreetDaily.com

Original Article: 2013’s Best of Friday Charts

Murray Math Lines 27.12.2013 (AUD/USD, NZD/JPY, SILVER)

Article By RoboForex.com

Analysis for December 27th, 2013

AUD/USD

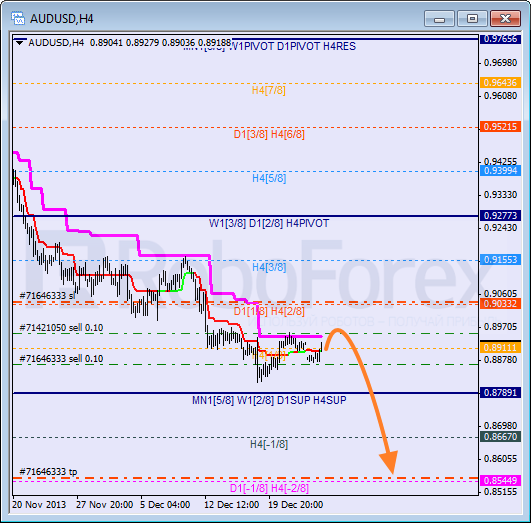
Australian Dollar is still being corrected; it looks like price is going to test daily Super Trend. If pair rebounds from it, market will start new descending movement towards the -2/8 level.

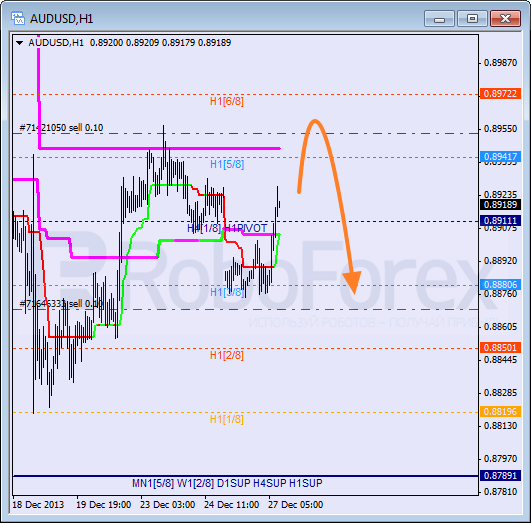
At H1 chart, price broke the 4/8 level. Possibly, Super Trends may form “bullish cross” in the nearest future. If price isn’t able to stay above the 5/8 level for a long time, bears will have a chance to start new descending movement.

NZD/JPY

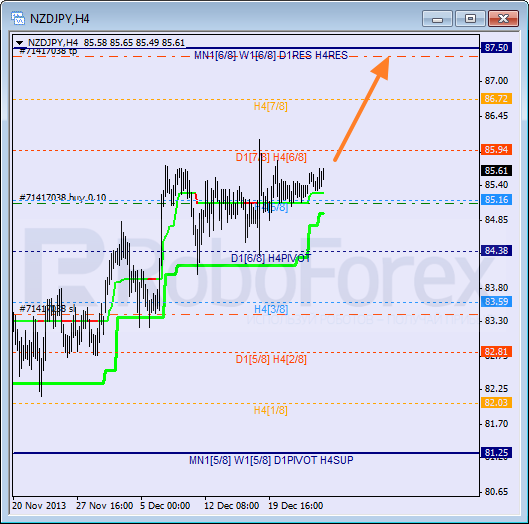
NZD/JPY is still moving above the Super Trends. Considering that market is already moving above the 5/8 level, price may continue growing up. Closest target is at the 8/8 level.

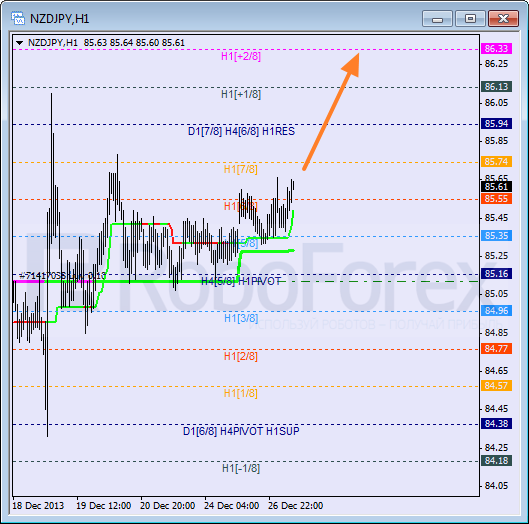
At H1 chart, price rebounded from Super Trend once again. Possibly, bulls may enter “overbought zone” during Friday. After price breaks the +2/8 level, lines at the chart will be redrawn.

SILVER

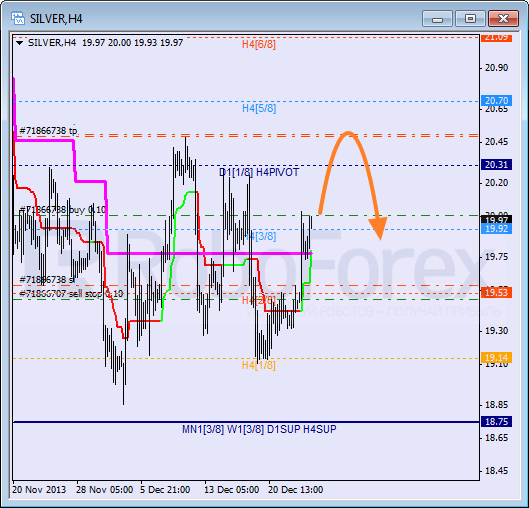
Silver was able to start new ascending movement, that’s why I closed my sell order and opened a buy one. Super Trends formed “bullish cross”. In the near term, market may break maximum, but if instrument isn’t able to stay above it, bears may continue descending movement.

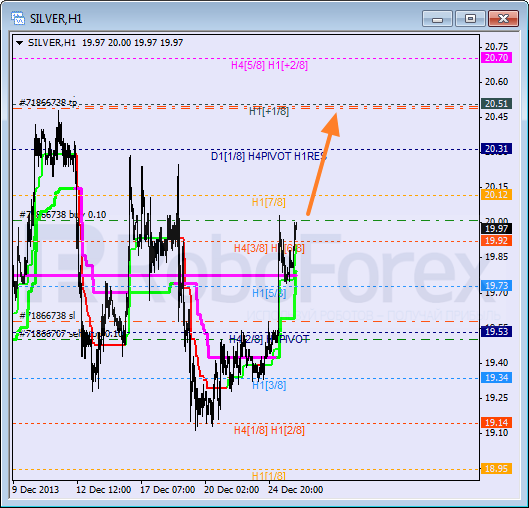
At H1 chart, Silver is moving above the 5/8 level, which means that it may continue growing up towards the 8/8 one. Most likely, bulls will break this level and ascending movement will continue up to the +1/8 level, at least.

RoboForex Analytical Department

Article By RoboForex.com

Attention!
Forecasts presented in this section only reflect the author’s private opinion and should not be considered as guidance for trading. RoboForex LP bears no responsibility for trading results based on trading recommendations described in these analytical reviews.


Tunisia raises rate 50 bps on inflation, FX, C/A concern

By CentralBankNews.info
    Tunisia’s central bank raised its key interest rate by 50 basis points to 4.5 percent while it reduced the rate on banks’ required reserves to 1.0 percent from 2.0 percent given the need to ensure adequate funding for economic growth.
    The Central Bank of Tunisia, which has now raised its rates twice this year for a total increase of 75 basis points, said it was concerned over the balance of payments, the level of inflation and the exchange rate and its policy measures should help accelerate structural reforms.
    Tunisia’s inflation rate was stable at 5.80 percent in November, the same rate as in October and September, but the central bank said in a statement from Dec. 26, following a board meeting on Dec. 25, that “some indicators point to the risk of continued pressure on inflation in coming months.”
    In the first 11 months, Tunisia’s average inflation rate was 6.1 percent, up from 5.5 percent in the same period last year.
    Tunisia’s current account deficit amounted to 7.1 percent of Gross Domestic Product in the first 11 months of the year, down from 7.6 percent a year earlier, but the central bank “expressed its concern about the continuing pressures on the balance of payments.”

    But the impact of the deficit on Tunisia’s international reserves was mitigated along with improved foreign direct investments, leading to an increase in reserves to 11.736 billion dinars, or the equivalent of 108 days of imports as of Dec. 24, compared with 11.324 at the end of September.
    Last month the Qatar National Bank, part-owned by the Gulf state’s sovereign wealth fund, gave Tunisia a $500 million deposit to support its foreign currency reserves.
    The central bank noted the increased liquidity needs of banks and carried out refinancing operations worth 4.793 billion dinars during December to ease tensions in money markets, up from 4.537 billion in November. The average interest rate on the money market eased to 4.74 percent since the start of December compared with 4.75 percent in November.
   Tunisia’s dinar has depreciated most of this year, hitting a low of 2.30 to the euro on Dec. 16 for a decline of almost 11 percent. But since then, it has rebounded, trading today at 2.28 to the euro.
    “This relative improvement cannot, however, obscure continued pressure on the domestic foreign exchange market,” the central bank said.
     Tunisia’s Gross Domestic Product rose by 0.6 percent in the third quarter from the second quarter for annual growth of 2.4 percent, down from 3.2 percent, and the central bank stressed the positive trend in exports.

    www.CentralBankNews.info

Japanese Candlesticks Analysis 27.12.2013 (EUR/USD, USD/JPY)

Article By RoboForex.com

Analysis for December 27th, 2013

EUR/USD

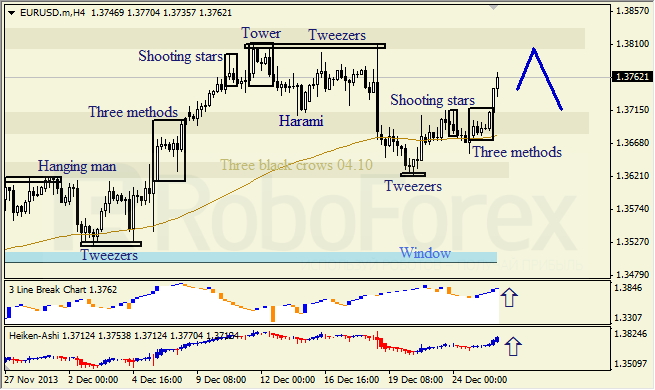
H4 chart of EUR/USD shows ascending movement, which is indicated by Three Methods pattern. Three Line Break chart and Heiken Ashi candlesticks confirm bullish tendency.

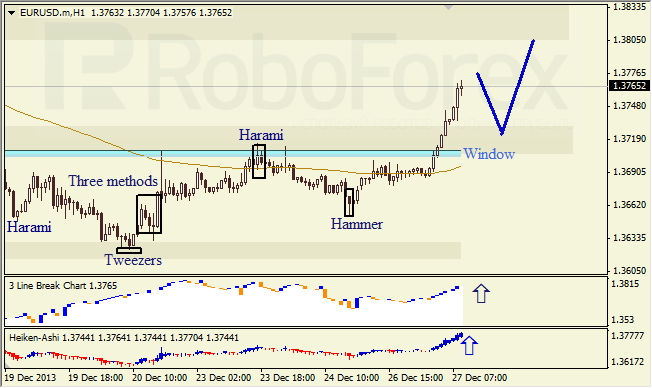
H1 chart of EUR/USD shows support from closest Window. Three Line Break chart and Heiken Ashi candlesticks confirm ascending movement.

USD/JPY

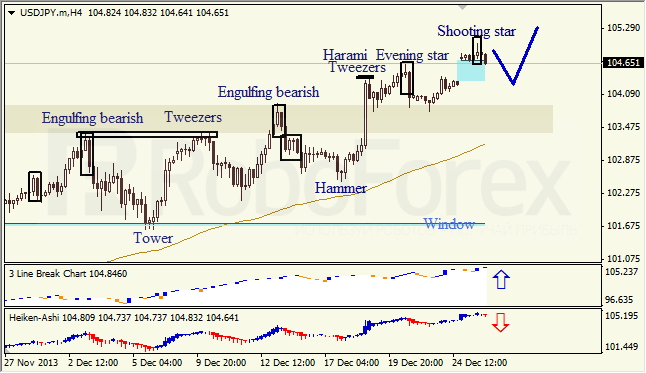
H4 chart of USD/JPY shows correction within ascending trend, which started after Shooting Star pattern. New Window is support level. Three Line Break chart indicates ascending trend; Heiken Ashi candlesticks confirm that correction continues.

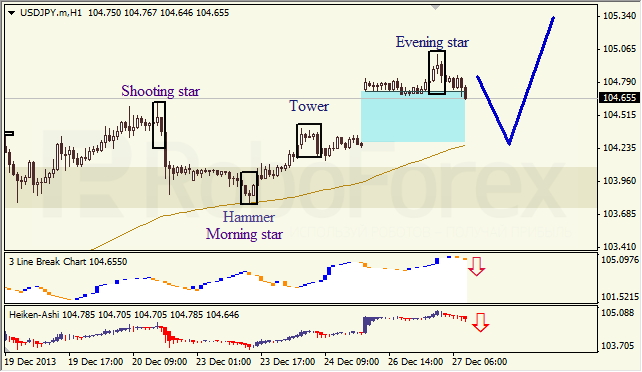
H1 chart of USD/JPY shows support from new upper Window. Shooting Star pattern indicates correction; Three Line Break chart and Heiken Ashi candlesticks confirm descending movement.

RoboForex Analytical Department

Article By RoboForex.com

Attention!
Forecasts presented in this section only reflect the author’s private opinion and should not be considered as guidance for trading. RoboForex LP bears no responsibility for trading results based on trading recommendations described in these analytical reviews.


3D Printing Technology Could Bring Down Bunnings in 2014

By MoneyMorning.com.au

It was just over a year ago that I came up with the idea to launch an investment advisory service focused on technology.

That service became Revolutionary Tech Investor.

A lot has happened so far this year.

And in the world of technology, you can be sure that even more will happen in the years and decades to come. But what if you don’t know anything about technology?

Should that prevent you from exploiting the opportunities available in this sector? Not a chance…

There’s a saying in the investing world that you should only invest in businesses you understand. Most people bring up Warren Buffett’s name when mentioning that saying.

Here’s my take on that: it’s garbage advice.

It’s not true that you have to understand a business or industry before investing in it.

What’s most important is to understand consumer demands and broader trends. Once you get that, it allows you to think about which industries could benefit and grow most from those trends.

No Time to Waste in Fast-Moving Technology Sector

Now, I’m not saying that Warren Buffett’s approach doesn’t work. Of course it works. That’s why he has been one of the world’s richest men for the past 20 years.

My point is that in the tech world, the market is always changing. You can’t waste valuable time by trying to understand each aspect of every business. If you try to do that I guarantee you’ll miss out on every tech investing opportunity there is.

Take how my tech analyst Sam Volkering and I approached the 3D printing industry this year. I can’t claim we got in at the ground floor, because we didn’t. The 3D printing industry started to move in 2012, before the launch of Revolutionary Tech Investor.

But if we had tried to get inside every aspect of 3D printing and become technical experts on the subject I know for sure we would have missed out on recommending this fast-growth sector to investors.

You only have to look at the footage Sam shot at the London 3D Print Show earlier this year to see the mind-boggling extent of the industry. Every time I look at the latest 3D printing developments I end up asking more questions about how it’s all possible.

That’s what makes the sector so exciting. That’s what makes it so revolutionary and innovative.

The truth is that no one on Earth fully understands the potential for 3D printing. No one knows the theoretical or actual limitations for this game-changing technology either.

And yet, that didn’t stop me putting together a vision of what things could be like if the 3D printing industry goes in the direction I expect.

Not for Warren Buffett

This is why, as good an investor as Buffett may be, his investing style doesn’t suit innovative tech investing.

Buffett’s investing style relies on finding companies that are already brand leaders. He then buys them when the market has priced them at a discount to their true value.

The idea then is to hold on to those stocks for decades in order to get the full benefit of that company’s growing market dominance.

Revolutionary investing is different. We’re looking for investing opportunities before the company becomes a brand leader.

That may mean the company doesn’t have the strong revenue and profit growth that Buffett looks for. And it most likely means the company doesn’t have the established brand name on which it can build.

This is where it’s important to understand the big picture implications for a particular company and industry.

That’s exactly what Sam and I did with the 3D printing industry. We don’t just see this as an opportunity for people to make plastic toys. We see this as the beginning of a once-in-a-lifetime shift in the manufacturing, distribution and retailing industries.

The End of Walmart

Simply put, if 3D printing takes off as we expect, it could challenge the way many firms do business.

As we noted in a special report for Revolutionary Tech Investor subscribers, 3D printing has the potential to destroy China’s position as a global manufacturing powerhouse.

How? By giving local firms the ability to compete with China by printing-to-order parts and components. No longer would you have to wait days or weeks for a part to be delivered; a local 3D printing store could print the item for you straight away.

But not only that, 3D printing poses a threat to the ‘big box’ retailers too, such as Walmart and Bunnings. Rather than Bunnings out-muscling smaller competitors by offering millions of items at a discounted price, a local hardware retailer could offer many more millions of items, which the store could 3D print at a moment’s notice.

Who needs acres of floor space and rows upon rows of nuts, bolts, and widgets, when a local 3D print centre could print the exact item you need. Think of the benefits. No need to wander aimlessly up and down aisles, wasting your Saturday or Sunday afternoon.

This is where it’s important to have a vision for the future. Only if you have that vision could you have picked or invested in a company and industry still in its infancy.

Without that vision, analysts and investors would have missed out on the 75% gain this particular 3D printing stock has clocked up since we tipped it earlier this year. That’s no mean feat.

A Great New Era for Technology Investing

But the 3D printing industry is just one of the game-changing industries we looked at in 2013.

We also looked at biotechnology, 3D bioprinting (that means 3D printing human tissue!), cyber security and cyber terrorism, and regenerative and personalised medicine.

These are all revolutionary technologies. None of them would fit the bill as an investment for any Buffett-style value investor.

Stocks like these are for speculators who want to get in on the ground floor of the next big investing trend. You can only do that if you’re prepared to speculate on what the future could look like.

2013 was a great year for investing in new technology trends. But based on the work and research Sam Volkering is doing right now to identify the next wave of trends, 2014 and the years beyond look set to be even greater.

Bottom line: this is the time to be a tech investor.

Cheers,

Kris Sayce signature

Kris Sayce

P.S. For the next four days you have the opportunity to take a look the exciting investment opportunities we’re uncovering in Revolutionary Tech Investor for a fraction of the upfront cost. Already we’ve seen gains of 75%, 47% and 65% in just a few months. I believe there’s more to come in 2014. You can access all our research now for just 25% of the full price. But I repeat: this invitation only stands for the next 96 hours. After midnight on Tuesday, 31st December, this offer closes. To take advantage now, click here.

Join Money Morning on Google+


By MoneyMorning.com.au

The Stock Market Holiday Bulge – Prepare for Selling

By Chris Vermeulen – www.thegoldandoilguy.com

I would like to start by wishing you a Happy Holidays & New Year!

So far this year (2013) has been a great year for trading and my 2014 forecast looks to be as good if not even better. I do have something exciting to share with you that is going to make 2014 really amazing, but first let me talk about the stock market and what is likely to unfold in the next week or two so you can protect your investments.

As many of you know, I follow and post frequently on StockTwits.com. I like to see what traders and investors are thinking/feeling about the broad market using extreme sentiment readings as a contrarian signal for trade ideas or to protect open positions more by tightening my protective stops and locking partial profits.

Below I have posted a two charts on sentiment courtesy of StockTwits to show these extreme readings of where the US stock market is trading at. The first chart is of the symbol $STUDY and this sentiment shows us that 98% of trading material is bullish on the stock market right now. My theory is, if everyone is moving in one direction, you better be ready for them to change direction any time. The masses move like a school of fish and one they get spooked they change direction and start selling everything they just bought.

The second sentiment chart is of the SPY exchange traded fund. This mimics the SP500 index and is also a gauge for broad market sentiment. If we think back to the 80/20 rule, we know that 20% of the crowd/clients are correct while 80% tend to be incorrect. With sentiment reaching the highest level in a couple months and with the index making new highs, coupled with the holiday price bulge (holiday rally) logic says a pullback in the near term is very likely an that it could be sharp and it almost like  automated trading.

Market Sentiment – Broad Market Contrarians Indicator

sentiment

The stock market has wave like patterns that form on a monthly basis that provide us with a steady stream of trading opportunities. One of the best swing trading tools for timing these waves is through the use of this chart below provided by Barchart.com.

The chart below is self explanatory, but let me quickly explain how it works. This chart rises as more and more stocks trade above the 20 day simple moving average. And when the majority of stocks are in a strong uptrend, it’s a lot like humans all trading in the same direction (a school of fish) and the odds favour a change in direction temporarily. These waves are great intermediate trends for swing trading and typically last multiple weeks at a time. This is one of my strategies which I trade with my members at TheGoldAndOilGuy.com alert newsletter. Keep in mind, its not as easy as it looks, because there are more moving parts to this equation but you can see these extreme waves clearly in this chart.

20dma


The Holiday Bulge & Amazing Information Conclusion

With the stock market still firmly in an uptrend and firing on all cylinders short term analysis is pointing to a pause or pullback in the next week or two.  I did forecast this exact price action several weeks ago and how it could lead to the start of a major market top. If a major top does form early in 2014 then we could make some big money once the down trend starts.

Remember, stocks fall 3-7 times faster than they rise, so once we get short massive gains can be made quickly and while the masses (school of fish) are losing money, we should be on the other side watching our trading account sky rocket!


NOW FOR THE GOOD NEWS!

A few days ago my new book “Technical Trading Mastery – 7 Steps To Win With Logic” became available to my followers and readers with an offer you would cannot refuse. If you buy my book before Jan 1st you get a Lifetime Membership to my new Monthly INNER-Investor Newsletter so you can keep your long term investment capital on the right side of the market forever.

Get the Full Details at: http://www.thegoldandoilguy.com/

Chris Vermeulen


Advancing to Level II: A Bulletproof Retirement

Guest Post By Dennis Miller, Advancing to Level II: A Bulletproof Retirement

That’s right, retirement has a Level II. I bet your competitive streak wants to get there, and that means building an overall strategy for producing stable monthly income. Depending on your personal goals, that might mean income to supplement your paycheck, or income that’ll have you sipping Mai Tais on the beach in Tahiti next to your spouse of 30- or 40-plus years.

But before we get to Level II, let’s review Level I.

Retirement Level I

Retirement changed radically when the government bailed out reckless banks at the expense of seniors and savers. A lot of people, myself included, entered the 2008 crash thinking their portfolios were as safe as a bomb shelter.

Personally, I allocated my portfolio by the “100 minus your age” rule. Cash holdings aside, nearly 70% of my capital was in income investments (leaning heavily on CDs, given the excellent rates at the time), and the remaining 30% was very conservatively invested in the market. In other words, I followed the rules.

Unlike many who took a large hit when the market crashed, my losses were minimal. I don’t say this to brag, nor am I encouraging you to follow my old allocation. I simply want to share that, even with my allocation down pat, I too was struck hard by the crash… just not in the way one might imagine. Why? Because it wasn’t the number at the end of my brokerage statement that let me sleep well at night, it was the income those investments produced.

I was living on that income, enjoying the retirement dream. Then—almost overnight—my “paycheck” was cut by 66%.

Like so many others, I was caught by a risk in my portfolio that had been unheard of a few years prior. With decades of livable interest rates behind us, not one financial advisor ever suggested I was at risk. Almost no products existed to deal with it.

The new, zero-interest-rate world was, as the kids in Silicon Valley like to say, a game-changer.

When our team sat down to develop Money Forever, we knew that retirement investing demanded both a defensive and an offensive strategy, played at the same time.

The defensive goal is to avoid catastrophic losses. Too many Americans were caught with their pants on the floor at the end of the dot-com and real estate bubbles. Others from around the world have been robbed of their savings as governments overspent and spurred inflation.

Bonds have performed very well recently. But the largest gains are not from yield, but from the Federal Reserve driving interest rates lower and holding them there.

While long-term bond funds appreciated handsomely, a new risk crept into portfolios around the world: the so-called bond bubble. If rates rise (we’ve seen a light preview of this since May), the net asset value of the billions of dollars in many bond funds will drop dramatically.

When we put our retirement money in fixed-income investments, we are investing for safety and yield. We cannot risk another bubble bursting at our expense.

Moving Forward

Yes, we want yield. But there is another reason for fixed-income investing: safety. What if there is a huge market drop? We may be domestically and internationally diversified and have adequate stop losses in place, but a wave can act like a tsunami at times, and right now is one of those times. So we are moving on to Level II.

Level II: Bulletproofing Your Retirement

There are two important facets of a strong portfolio: income, and opportunities. Miller’s Money Forever helps guide you through the better points of finance, and helps replace that income lost in our zero-interest-rate world.

Pre-crash, if an investor bought a CD at the prevailing rate, and then interest rates rose during that period, he would not lament his loss in net asset value. He would be satisfied with the interest, and when his CD matured, he would buy another one at the current rate. So why do we look at bond funds, see our net asset value go down, and worry? Because most bond funds are always busy selling, baking in those losses along the way.

Some funds, however, hold them to maturity. In that regard, it is like a CD. Of course, it is not FDIC insured. That does not make it unsafe, however. In fact, in the fall of 2008, I would have been better off holding non-callable bonds at a nice, juicy 6% rate instead of FDIC-insured CDs. My income certainly wouldn’t have taken the hit it did. (I must forgive myself for that sin against my portfolio, but now I know better.)

This is where the value of one of the best analyst teams in the world comes into focus. We focus on our subscribers’ income-investing needs, and I challenge our analysts to find safe, decent-yielding, fixed-income products that will not trade in tandem with the steroid-induced stock market—or alternatively, ones that will come back to life quickly if they do get knocked down with the market. They recently showed me seven different types of investments that met my criteria and still withstood our Five-Point Balancing Test.

Somewhere in the discussion, I mentioned how tired my peers are of having holes blown in their retirement plans. While nuclear-bomb-shelter safe may be impossible, we still want a bulletproof plan.

This is what we’ve done at Money Forever: built a bulletproof, income-generating portfolio that will stand up to almost anything the market can throw at it.

It is time to advance to Level II and learn about the vast market of income investments safe enough for even the most risk-wary retirees. Some investors may want to shoot for the moon, but we spent the bulk of our adult lives building our nest eggs; it’s time to let them work for us and enjoy retirement stress-free. Learn how to get in, now.