The Senior Strategist: A week of politics

U.S. stocks rised after strong Jobs Report. Early Friday the Labor Department reported that the U.S. economy added 203.000 jobs in November, and the unemployment rate fell to 7% from 7.3%.

This week is more a week of politics – and some important economic data to look forward to, according to The Senior Strategist Ib Fredlund Madsen.

Legal information

Video courtesy of http://en.jyskebank.tv/


USDJPY Looks For 104 – Elliott Wave Forecast

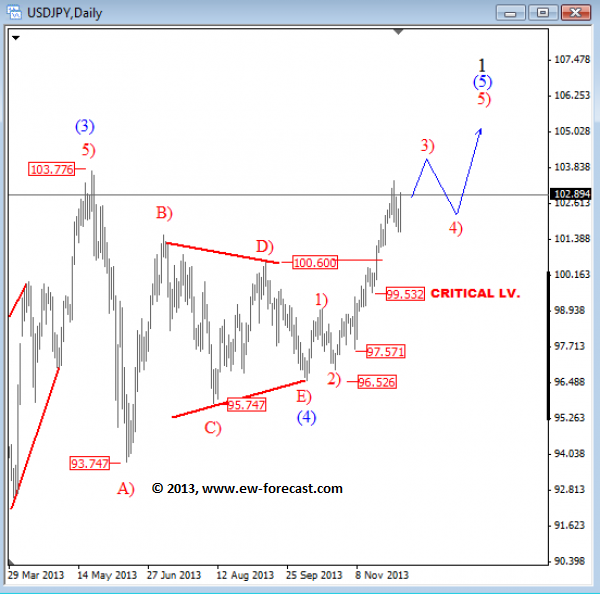
USDJPY Daily

USDJPY accelerated nicely to the upside in the last few weeks after breaking above 100.60 swing high that represents a wave D) high in a triangle. Usually when this high is broken it means that triangle is complete and that market is moving impulsively. With that said, we think that prices are in a red wave 3) of (5) moving up towards new highs. USDJPY is now in bullish move as long as pair trades above 99.50.

USDJPY Daily Elliott Wave

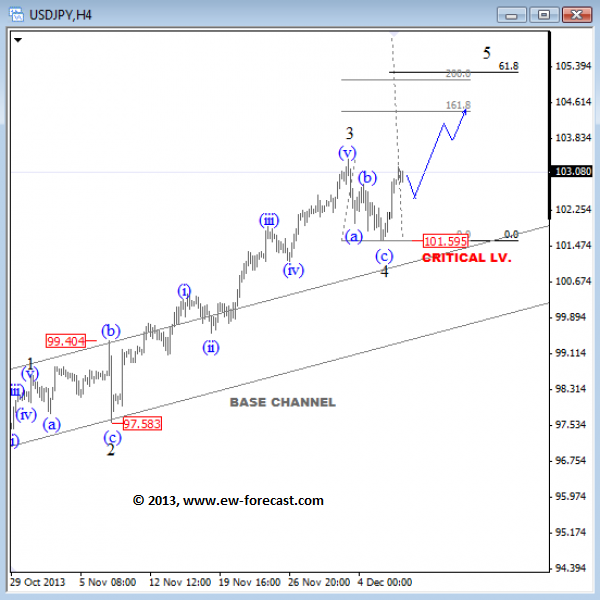
USDJPY 4h

USDJPY has retraced back to 101.60 last week where three wave decline appears complete after recent rally above above 103.00 level. We are talking about wave 4 pullback that is now pointing higher for wave 5 move towards 104.40-105.40 projected target as long as 101.60 holds.

USDJPY 4h Elliott Wave

Written by www.ew-forecast.com

2 week trial


Oil Prices Climbs Six-week High on China’s Upbeat Trade Surplus

By HY Markets Forex Blog

Crude oil prices were seen trading higher on the first day of the trading week, as China reported a fresh trade balance data for the last month.

West Texas Intermediate (WTI) crude oil rose 0.13% higher, trading at $97.78 per barrel as of the time of writing, while the European benchmark Brent added $111.74 per barrel at the same time.

China, the second largest oil consumer in the world, imported approximately 23.56 million tons of crude in November, accounting for 5.73 million barrels per day and marking a rise of 19.1% from the previous month on a daily basis.

Meanwhile in Japan, the country reported its gross domestic product (GDP), up by 0.3% in three months to September, marking the slowest quarterly pace this year, following the 0.9% climb in the previous quarter and 1% recorded in the first quarter.

Oil Prices – China

Trade surplus in China climbed to $33.8 billion in November, marking the highest trade surplus since January 2009, while exports growth pace slightly picked up above expectations. Exports rose 12.7% higher, almost doubling analysts forecast of a 7% rise, while imports advanced 5.3%, on a yearly basis.

The Consumer Price Index (CPI), climbed 3% year-on-year in the previous month, a report from the National Bureau of Statistics confirmed on Monday.

Oil Prices – US Data

On Friday, the Bureau of Labour Statistics posted its jobs release for November, showing an addition of 203,000 new employees in the US economy during the month.

The Non-farm payrolls data revealed 203,000 new jobs were added in November, up from the 200,000 recorded in the previous month and exceeding analysts’ forecast of 185,000, according to the Bureau of Labour Statistics.

The unemployment rate in November dropped to 7.0%, compared to 7.3% in the previous month and beating analysts forecast of 7.2%


Win a luxurious trip to the Maldives & up to $30,000 cash for trading with us!

Visit for details http://alturl.com/2kysk 

The post Oil Prices Climbs Six-week High on China’s Upbeat Trade Surplus appeared first on | HY Markets Official blog.

Article provided by HY Markets Forex Blog

Euro Pulls-back From October Highs

By HY Markets Forex Blog

The euro currency withdrew from its October high on Monday and traded flat against the US dollar during the European morning trading hours. While Germany posted a drop in its trade surplus for October, falling below analysts’ estimates.

The euro-bloc currency stood at $1.3700 against the US dollar as of 7:52am GMT, after it rose to its highest level in over a month earlier in the session, the pair was at $1.3721. The euro rose 0.15% higher at ¥141.14 against the yen and edged 0.07% lower to £0.8374 against the pound sterling at the same time.

Euro – ECB

“The EUR has been supported of late, mainly on the back of a less dovish than expected ECB press conference. Although central bank President Draghi continued to stress downside risk to growth, he did not make a case for additional policy action to be imminent. We remain of the view that EUR/USD upside should be limited from the current levels,” Credit Agricole wrote in a note on Monday.

On Friday, the European Central Banks (ECB) decided to maintain its interest rates at 0.25%.

German Trade Surplus

Germany’s trade balance came in at €17.9 billion in October, from €20.3 billion recorded in the previous month. Exports rose 0.2% to €99.1 billion in October, while imports edged up 2.9% to €81.2 billion.

Germany’s industrial production is forecasted to rebound and rise 0.7% month-on-month, compared to the 0.9% recorded in September.

US Labour data

On Friday, the Bureau of Labour Statistics posted its jobs release for November, showing an addition of 203,000 new employees in the US economy during the month.

The Non-farm payrolls data revealed 203,000 new jobs were added in November, up from the 200,000 recorded in the previous month and exceeding analysts’ forecast of 185,000, according to the Bureau of Labour Statistics.

Market participants remain focused on the Federal Reserve’s (Fed) next meeting; which would likely hint when the central bank could  to begin taper its asset-purchases scheme.


Get $100 FREE Funded into your MT4 Account as well as many more amazing benefits! Register with HY Markets today…

http://www.hymarkets.com/english/reg/reg.hyml …

The post Euro Pulls-back From October Highs appeared first on | HY Markets Official blog.

Article provided by HY Markets Forex Blog

Monday Charts: The Positive Side to All the Negative Thinking

By WallStreetDaily.com

The bull market deniers have been out in full force lately.

From Pimco’s Bill Gross, who swears that “all asset prices are bubbly,” to billionaire Jim Rogers, who keeps urging caution because “the big, big rally in the U.S. stock market” isn’t based on reality.

Those are just two notable examples. Rest assured, countless others exist. Don’t just take my word for it, either…

In a recent note to investors, Bespoke Investment Group said, “There’s been so much ‘bubble’ talk lately that our heads are spinning.”

So true! But I’ll take it by the truckload.

Why? Because the more negativity that’s swirling around – and the more pundits that are warning about a top – the more likely it is that we’re nowhere even close.

In other words, their sentiment is a contrarian indicator.

That’s a fact of investing Sir John Templeton validated long ago, when he said (emphasis mine), “Bull-markets are born on pessimism, grow on skepticism, mature on optimism and die on euphoria.”

Newsflash: We’re clearly in the “growing” phase, not the “dying” phase.

If you want concrete proof, look no further than the American Association of Individual Investors (AAII) sentiment survey:

No, this isn’t a printout from my latest electrocardiogram test. It’s the week-to-week swings in bullish sentiment since the current rally began in March 2009.

Forget euphoric, everyday investors appear downright schizophrenic. Their sentiments shift violently and without warning.

But perhaps you don’t put much stock – if any – in sentiment data. Fair enough.

Please realize that rock-solid fundamental data supports the bull market believers, too.

Nothing Bubbly Here

Much has been made about the expanding price-to-earnings (P/E) ratio for the S&P 500 Index. It’s up from 14.5 at the beginning of the year to 16.9 right now.

However, such expansion is perfectly natural for a bull market – especially when more money is chasing after fewer opportunities, as I indicated here.

Keep in mind, while multiples might be expanding, they’re nowhere near extreme levels.

Truth be told, nine out of ten sectors are actually trading at a discount to their average P/E ratios since 1990, according to Bespoke.

As for the entire market, it’s trading at a 14.2% discount to the average since 1990.

All in Cash, Still

Not only are stock market valuations still reasonable, but many investors remain on the sidelines.

In fact, the latest BlackRock Investor Pulse survey reveals that cash is the dominant investment for 48% of Americans. That’s a lot of people “stuck” in cash. Still.

I don’t know what the heck they’re waiting for. When these latecomers finally decide to pull the trigger – and go “all in” on stocks – that’s when we need to worry. But that time definitely isn’t here yet.

Good Tidings For Stocks

How about a short-term correction, a momentary sell-off before resuming the upward march? That’s not very likely, either.

You see, seasonal trading patterns are also working in stocks’ favor.

Despite the month getting off to a rocky start with four down days, December is historically one of the strongest months for stocks.

Take a look:

The average gains are among the strongest in December, and so is the consistency of positive returns.

Over the last 20, 50 and 100 years, the Dow has delivered positive returns 70%, 66% and 73% of the time, respectively.

Bottom line: Ignore the fear mongers and stay long and strong stocks. With the Fed still printing money non-stop, this party’s far from over.

Ahead of the tape,

Louis Basenese

The post Monday Charts: The Positive Side to All the Negative Thinking appeared first on Wall Street Daily.

Article By WallStreetDaily.com

Original Article: Monday Charts: The Positive Side to All the Negative Thinking
Monetary Policy Week in Review – Dec 2-6, 2013: Egypt, Uganda cut as low inflation worries ECB, Canada, Norway

By CentralBankNews.info
    Last week the central banks of Egypt and Uganda cut key interest rates while the ECB, the Bank of Canada and Norges Bank voiced concern over low inflation as the debate over the U.S. Federal Reserve’s tapering of asset purchases rumbled on.
    The use of exchange rates as a internationally competitive tool – one of this year’s recurring themes – also surfaced last week as the Reserve Bank of Australia (RBA) again voiced its concern over the “uncomfortably high” Australian dollar and the Canadian dollar fell to three-year lows on the view that the Bank of Canada (BOC) has turned more dovish just at the same time that the Fed may decide that the U.S. economy is strong enough to handle a reduction in its $85 billion monthly bond purchases.
   Mario Draghi, president of the European Central Bank (ECB), again stressed that he was ‘‘ready and able’’ to take new steps to aid the euro area economy and forecast a “prolonged period of low inflation,” a phenomenon that raises the specter of Japan’s 20 year battle to rid the country of deflation.
    Although the BOC already dropped its policy tightening bias in November, last week’s reference to the growing downside inflation risks, the lack of stronger exports and the expected soft landing for the housing sector reinforced the impression that Canadian rates will be on hold until 2015.
    Echoing Canada’s easier policy stance, Norway’s central bank pushed back any rate increase by 12 months to the summer of 2015.
   As the BOC, Norges Bank referred to lower-than-expected inflation, a decline in house prices and the possibility of low wage growth. The only positive factor for Norway’s economy was a depreciation of the krone currency.
    Uganda’s central bank surprised markets by cutting its rate by 50 basis points to 11.5 percent, only two months after warning that it could raise rates if core inflation were to accelerate and a rate rise in September.
    Egypt’s central bank also surprised markets by cutting its rate by 50 basis points to 8.25 percent as inflation rose in October and may rise further in November and December. Economists had also expected the bank to maintain rates to avoid any further outflow of capital.
    But the Central Bank of Egypt said the downside risks to the economy outweighed the upside risks to inflation given the “persistently negative output gap since 2011” and challenges facing the euro area and softer growth in emerging markets.
    In addition to the ECB, the BOC, the RBA and Norges Bank, the central banks of Poland, the United Kingdom and Mexico maintained their rates last week.
 
    Through the first 49 weeks of this year, central banks have cut their policy rates 111 times, or 23.6 percent of the 473 policy decisions taken by the 90 central banks followed by Central Bank News.
    This is unchanged from the previous week, but down from 25.3 percent after the first half, reflecting the recent rate rises by some of the major emerging market central banks.
     Policy rates have been raised 26 times this year, or 5.5 percent of this year’s policy decisions, up from 4.7 percent after the first half of the year.

     LAST WEEK’S (WEEK 49) MONETARY POLICY DECISIONS:

COUNTRYMSCI     NEW RATE           OLD RATE         1 YEAR AGO
AUSTRALIADM2.50%2.50%3.00%
UGANDA11.50%12.00%12.00%
CANADADM1.00%1.00%1.00%
POLANDEM2.50%2.50%4.25%
NORWAYDM1.50%1.50%1.50%
UNITED KINGDOMDM0.50%0.50%0.50%
EUROSYSTEMDM0.25%0.25%0.75%
EGYPTEM8.25%8.75%9.25%
MEXICOEM3.50%3.50%4.50%

    This week (week 50) 11 central banks are scheduled to hold policy meetings, including Sri Lanka, Iceland, South Korea, New Zealand, Namibia, the Philippines, Serbia, Indonesia, Switzerland, Peru and Fiji.

COUNTRYMSCI             DATE CURRENT  RATE        1 YEAR AGO
SRI LANKAFM9-Dec6.50%7.50%
ICELAND11-Dec6.00%6.00%
SOUTH KOREAEM12-Dec2.50%2.75%
NEW ZEALANDDM12-Dec2.50%2.50%
NAMIBIA12-Dec5.50%5.50%
PHILIPPINESEM12-Dec3.50%3.50%
SERBIAFM12-Dec10.00%11.25%
INDONESIAEM12-Dec7.50%5.75%
SWITZERLANDDM12-Dec0.25%0.25%
PERUEM12-Dec4.00%4.25%
FIJI12-Dec0.50%0.50%

    www.CentralBankNews.info

Murray Math Lines 09.12.2013 (AUD/USD, EUR/JPY, SILVER)

Article By RoboForex.com

Analysis for December 9th, 2013

AUD/USD

Australian Dollar started deeper and more serious correction and right now is moving between Super Trends. If later price rebounds from daily Super Trend, pair will start new descending movement. In this case, target will be at the 0/8 level again.

At H1 chart, Super Trends formed “bullish cross”. Most likely, in the nearest future price will continue growing up towards the 4/8 level. If later bears are able to rebound from this level, instrument may start new descending movement.

EUR/JPY

EUR/JPY is still growing up; last Friday price reached new maximum. Considering that pair is already moving above the 5/8 level, market may continue growing up towards the 8/8 one.

At H1 chart, pair is moving inside “overbought zone”. Most likely, in the nearest future price may form local correction.  After pair breaks the +2/8 level, lines at the chart will be redrawn.

SILVER

At H4 chart, Silver is moving between Super Trends. Last week, market was just several pips away from the 0/8 level. During the next several days, correction towards the 2/8 level may continue.

Price is moving in the middle of H1 chart. Last Friday, instrument rebounded from Super Trends again. If later market is able to keep price above the 5/8 level, instrument will continue growing up towards the 8/8 one.

RoboForex Analytical Department

Article By RoboForex.com

Attention!

Forecasts presented in this section only reflect the author’s private opinion and should not be considered as guidance for trading. RoboForex LP bears no responsibility for trading results based on trading recommendations described in these analytical reviews.


Japanese Candlesticks Analysis 09.12.2013 (EUR/USD, USD/JPY)

Article By RoboForex.com

Analysis for December 9th, 2013

EUR/USD

H4 chart of EUR/USD shows bullish tendency within ascending trend. Three Methods pattern, Three Line Break chart, and Heiken Ashi candlesticks confirm ascending movement.

H1 chart of EUR/USD shows bullish tendency. Three Line Break chart and Heiken Ashi candlesticks confirm ascending movement; price may form several bearish patterns inside resistance area.

USD/JPY

H4 chart of USD/JPY shows completion of descending correction, which is indicated by Tower pattern near closest Window. Three Line Break chart and Heiken Ashi candlesticks confirm ascending movement.

H1 chart of USD/JPY shows bullish tendency. Three Line Break chart and Heiken Ashi candlesticks confirm ascending movement.

RoboForex Analytical Department

Article By RoboForex.com

Attention!
Forecasts presented in this section only reflect the author’s private opinion and should not be considered as guidance for trading. RoboForex LP bears no responsibility for trading results based on trading recommendations described in these analytical reviews.


Sri Lanka holds rate steady, sees over 7% growth in 2013

By CentralBankNews.info
    Sri Lanka’s central bank held its benchmark repurchase rate steady at 6.50 percent, citing several positive developments in the past month, including faster economic growth, a decline in inflation to a level that was lower than expected and progress in the external sector.
    The Central Bank of Sri Lanka has cut its rate by 100 basis points this year and said the positive developments indicated that “the monetary policy decisions implemented throughout 2013 were timely and appropriate.”
    A turnaround in the financial position of key public corporations led to substantial repayments to the banking sector and enabled an increased flow of financing to the private sector and a strong 27.2 billion rupee rise in credit to the private sector by banks.
    “These factors augur well for future economic growth, while continued downward adjustments to longer term market rates would bolster market confidence and nurture positive investor sentiments,” the central bank said, adding that continued improvement in public corporations and fiscal consolidation should make it easier to maintain the desired monetary expansion in the period ahead.
    Sri Lanka’s Gross Domestic Product rose by an annual rate of 7.80 in the third quarter, up from 6.8 percent in the second quarter, with all key sectors of the economy contributing positively.

    “The sound, broad based growth performance in the third quarter strengthens expectations of over 7 percent economic growth for the year,” the bank said, up from 6.4 percent in 2012.
    Sri Lanka’s inflation rate eased to 5.6 percent in November from 6.7 percent, mainly due to lower food and non-food prices, while core inflation fell to 2.4 percent. The average headline inflation rate fell to 7.3 percent in November from 7.6 percent in October.
    The outlook for inflation is expected to remain benign and in “mid-single digit levels throughout 2014 as well,” the bank said, citing subdued international commodity prices, improved domestic supply conditions and well contained demand-driven inflationary pressures.
    The central bank aims for an average inflation rate this year of 7.0 percent and last month the bank’s governor predicted that inflation should slow to between 4 percent and 6 percent in 2014, barring a major supple shock.
    Earning from exports recorded its highest ever monthly value in October, rising an annual 35.1 percent to US$1.041 billion, resulting in a narrower trade deficit.
    “The growth in exports heightens expectations of a durable recovery of the advanced economies leading to enhanced growth in export proceeds for the rest of the year, as well as for 2014,” the bank said.

    www.CentralBankNews.info

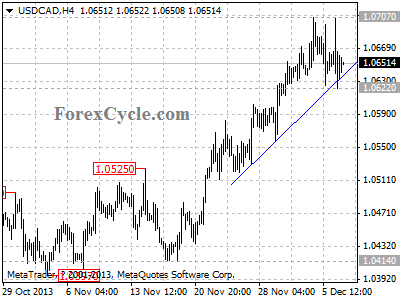
USDCAD remains in uptrend from 1.0414

USDCAD remains in uptrend from 1.0414, the fall from 1.0707 is likely consolidation of the uptrend. Key support is at 1.0622, as long as this level holds, the uptrend could be expected to resume, and one more rise towards 1.1000 is still possible. On the downside, a breakdown below 1.0622 will indicate that the upward movement from 1.0414 had completed at 1.0707 already, then the following downward movement could bring price back to 1.0500 zone.

usdcad

Provided by ForexCycle.com