Why the Small Home Supplies Stocks Offer Good Potential

By George Leong, B.Comm.

The housing market looks like it may be ready to fall. While the homebuilders may face some hurdles, the area of housing that I feel is a buying opportunity is the home supplies and services stocks. The Home Depot, Inc. (NYSE/HD) is the “Best of Breed” in the housing market, with Lowes Companies, Inc. (NYSE/LOW) trailing in second.

While I like the Home Depot in the housing market, the reality is that the company is too big for my liking, with its market cap at a whopping $112 billion. Even Lowe’s, with a market-cap of $53.0 billion, is too large for my liking and the current valuations are fair.

A small-cap stock that I would look at as an alternative in the housing market supplies sector is Dallas-based Builders FirstSource, Inc. (NASDAQ/BLDR), with a much smaller market cap of $728 million. But unlike the Home Depot and Lowe’s, Builders FirstSource primarily deals with the residential new homes construction housing market as a manufacturer and seller of structural and related building products. The company’s products include roof and floor trusses, wall panels, stairs, aluminum and vinyl windows, custom millwork, and pre-hung doors.

The company runs 53 distribution centers along with 47 manufacturing facilities in nine states that are situated mainly in the southern and eastern United States housing market.

Builders FirstSource has outperformed the S&P 500 over the past year with a 29.91% advance, versus 23.52% by the S&P 500.

The company recorded sequential annual revenue growth from 2004 to 2006, but then struggled on the charts with three straight down years. Builders FirstSource appears to be on the right path again with revenues rising in each of the three straight years to 2012. And things are looking brighter for the company in the housing market with revenues estimated to rally an impressive 40.3% to $1.5 billion this year, followed by a 23.7% jump to $1.88 billion in 2014, according to Thomson Financial.

On the earnings side, Builders FirstSource has been inconsistent, but again, a turnaround appears to be here. Analysts following Builders FirstSource estimate the company will earn $0.06 per diluted share this year and $0.46 per diluted share in 2014, according to Thomson Financial. These would reverse six straight years of losses and represent the highest earnings for the company since 2006.

The chart for Builders FirstSource shows the breakout from the previous sideways trading channel (as reflected by the shaded circle in the upper right corner).

Chart courtesy of www.StockCharts.com

Note the bullish crossover of the 50-day moving average (MA) above the 200-day MA in August 2012, when the stock was trading at around $3.68. The bullish golden cross has held since, and the stock has doubled. If Builders FirstSource can hold on the breakout, we could see a move to over $17.00, which hasn’t been seen since 2008, prior to the subprime fiasco.

If you are looking to play the housing market, consider taking a closer look at stocks like Builders FirstSource.

Interested in more small-caps? Read about a low-priced restaurant stock in “The McDonald’s Alternative for Small-Cap Investors.”

This article Why the Small Home Supplies Stocks Offer Good Potential is originally published at Profitconfidential



Happy Guy Fawkes Day

By The Sizemore Letter

guy-fawkes-maskRemember, remember the Fifth of November,
The Gunpowder Treason and Plot,
I know of no reason
Why the Gunpowder Treason
Should ever be forgot.
Guy Fawkes, Guy Fawkes, ’twas his intent
To blow up the King and Parli’ment.
Three-score barrels of powder below
To prove old England’s overthrow;
By God’s mercy he was catch’d
With a dark lantern and burning match.
Hulloa boys, Hulloa boys, let the bells ring.
Hulloa boys, hulloa boys, God save the King!

–Traditional English nursery rhyme

It doesn’t get much press on this side of the Atlantic, but it should.  Today, November 5, is Guy Fawkes Day, the day that the English remember one of their most notorious villains or one of their most celebrated heroes, depending on their mood or ideological leaning.

On this day in 1605 Fawkes, a disgruntled religious minority tired of official abuse, attempted to take down the entire English government—king, ministers, parliament and all—by blowing up the House of Lords with a large cache of gunpowder during the State Opening of Parliament.

Fawkes was discovered and promptly executed, but he is remembered—in typically dry English humor—as the last man to enter parliament with honest intentions.

2013 has been a frustrating year in American politics.  We came a lot closer than we should have to defaulting on our sovereign debts. We have a Democratic administration that didn’t bother to beta test the website that was the lynchpin for the biggest change to the health system since Medicare and Medicaid were introduced, and a radicalized Republican minority that wants to eliminate the Federal Reserve.

A less-violent “Guy Fawkes option” of running the entire government out of town and starting over sounds a lot better than it should.  But as investors, we have to keep perspective.  With few exceptions, America’s political system has always been a chaotic mess.  In our short history, we’ve had a civil war and four presidential assassinations.  We’ve had our capital burned to the ground.  And we’ve had more political scandals than I can count.

And guess what: Americans have a way of getting on with their business.  My advice is stop worrying about politics and focus your energies on finding quality investment opportunities.  Here in the United States, we are still in the early stages of the biggest energy revolution in a century.  The rise of Generation Y will create a new baby boom in the late 2010s and early 2020s. And the aging of the original Baby Boomers will create challenges that will make savvy entrepreneurs wealthy.

These are just the opportunities here in the United States.  Looking overseas, the rise of the new emerging-market middle class is the biggest investable macro trend of the past 50 years.

So tonight, pour yourself a drink and offer a toast across the Atlantic. Wear a Guy Fawkes mask if you feel like it, or burn a Guy effigy (or the effigy of whatever prominent politician irritates you the most) if you’re not breaking neighborhood ordinances in doing so.  But come tomorrow morning, toss the politics out the window and focus instead on finding solid investments.


Charles Lewis Sizemore, CFA, is the chief investment officer of the investment firm Sizemore Capital Management. Click here to receive his FREE 8-part investing series that will not only show you which sectors will soar but also which stocks will deliver the highest returns. The series starts November 5 and includes a FREE copy of his 2014 Macro Trend Profit Report.

This article first appeared on Sizemore Insights as Happy Guy Fawkes Day

Join the Sizemore Investment Letter – Premium Edition

Familar Names on the Magic Formula List

By The Sizemore Letter

I’m always a little skeptical of any stock market screen called a “magic formula,” but I do like to consult Joel Greenblatt’s screener by that name from time to time.

Greenblatt, who made the screen famous in his book The Little Book that Beats the Market ranks stocks using two criteria:

  1. Valuation, as measured by the earnings yield (defined by Greenblatt as EBIT / Enterprise Value)
  2. Profitability, as measured by Greenblatt’s preferred metric, Return on Capital

There is really nothing “magical” about it.  It’s simply a screen that looks for highly-profitable companies trading at cheap prices.  And good analyst can use the list as a starting point for further research.

With that said, I want to highlight a handful of well-known stocks that made the cut on the screen this week:

Company

TickerPrice dateMost Recent Financials
Apple

$AAPL

10/30/2013

9/30/2013

Cisco Systems

$CSCO

10/30/2013

7/31/2013

Coach Inc

$COH

10/30/2013

9/30/2013

Microsoft

$MSFT

10/30/2013

9/30/2013

Smith & Wesson

$SWHC

10/30/2013

7/31/2013

As you might expect from any list of stocks on a value screens, all of these companies have “issues.”  We all know that Apple’s growth is slowing and that its product lineup isn’t as innovative as it was under Steve Jobs.  Cisco and Microsoft have had a hard time adjusting to the mobile era.  Coach is struggling from weakness in its core market, “aspirational” middle-class American women.  And Smith & Wesson is facing slower sales in the years ahead, as a lot of would-be buying was forward by fears of new government gun control.

Yet all of these companies are wildly profitably, all have very low debt and very little risk of financial distress, and all but Smith & Wesson pay a respectable and growing dividend.

As you rebalance your portfolio in the final months of 2013, give the Magic Formula stocks a look.  Over any reasonable investment time horizon, “cheap and profitable” is a winning combination.

Sizemore Capital is long CSCO and MSFT. This post first appeared on TraderPlanet.

Charles Lewis Sizemore, CFA, is the chief investment officer of the investment firm Sizemore Capital Management. Click here to receive his FREE 8-part investing series that will not only show you which sectors will soar but also which stocks will deliver the highest returns. The series starts November 5 and includes a FREE copy of his 2014 Macro Trend Profit Report.

This article first appeared on Sizemore Insights as Familar Names on the Magic Formula List

Join the Sizemore Investment Letter – Premium Edition

The U.S Dollar Manages to Be in Consolidation

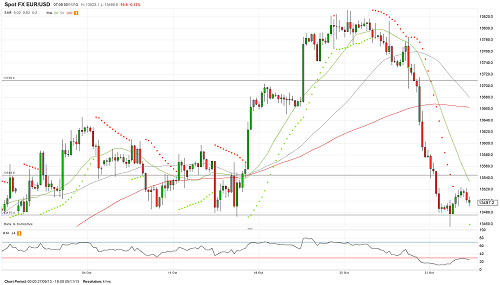
The EURUSD Tests Resistance 1.3523

After the week of active declining the EURUSD has managed to be in consolidation. Yesterday, the pair was sluggish and corrected above 35th figure, it faced with compulsive resistance at the 1.3523 level. Consolidation above support 1.3475 gives the bears a hope for better pair’s resumption towards 36th figure, but the loss of this support will break their hope. The pair may trade in a range before the ECB announce the decision. The lack of demand above 1.3523 appears to be negative for the euro.

eurusd05.11.2013

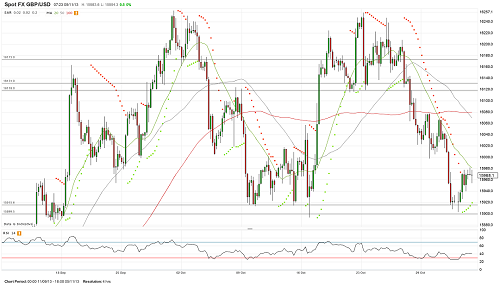
The GBPUSD Recovers to 1.5981

Yesterday, the GBPUSD found support around 59th figure again, and it consolidated above 1.5915.
Within the confines of resumption the pair’s rate increased to the 1.5981 level. The pressure on the pair is preserved, the RSI has managed to be out of the oversold area. Its rate may return to support.
The growth to 1.6000-1.6080 should be used for opening of shorts, but if the growth is above the latter level, the bearish impulse will be offset. The pound may trade in a range before the BoE committee will announce the results.

gbpusd05.11.2013

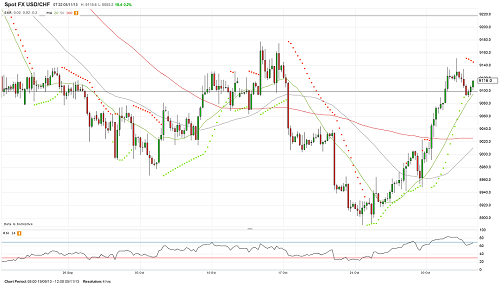
The USDCHF Trades Near 91th Figure

The USDCHF has managed to be in consolidation after the week of sustainable growth. The Swiss franc growth in cross with the single currency contributed to the declining of the pair USDCHF below 91th figure. In general, the pair was traded near 0.91 the whole day, it was unable to develop the movement in one or another direction. However, the dollar is in demand, this situation allows the dollar to hold above the 20-day MA. It may grow to 92nd figure, but the dropping of the EURCHF may restrain this growth.

usdchf05.11.2013

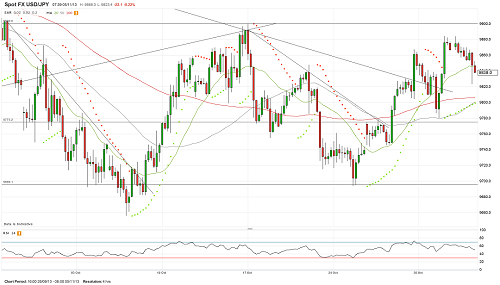
The USDJPY Dropping

The USDJPY was traded in a narrow range during the whole day, it was limited by the levels 98.84 and 98.53. During the Asian trading session the dollar dropped below the latter level and tested the 98.23 mark, and it retreated to 98.52. The pressure on the dollar remains, and it may drop to support 97.75 again. The situation in the pair is the same: the outcome from a range is required for movement development towards one or another direction. Inability to increase above 98.85 appears to be negative for the bulls.

usdjpy05.11.2013

provided by IAFT


Gold “Lacks Direction” as Private Investors Buy, Indian Consumers Switch to Silver

London Gold Market Report
from Adrian Ash
BullionVault
Tues 5 Nov 08:30 EST

LONDON wholesale gold was unchanged Tuesday lunchtime from yesterday or from last week’s finish at $1317 per ounce, as European shares again defied a drop in Asian stock markets to tick higher.

 Major government bond prices edged back, and commodities rallied from multi-month lows.

 Silver today bounced from a near 3-week low at $21.58 per ounce, more than 6.5% below last Wednesday’s 6-week high.

 The British Pound meantime rose to 1-week highs after the European Commission sharply revised its 2014 and 2015 growth forecasts for the UK higher.

 That pushed Sterling gold below £820 for the first time since October 22nd.

 “Yesterday was one of the quietest days I can remember for a while,” said Marex Spectron’s David Govett in a note Tuesday morning, “with tiny volumes and very narrow ranges.”

 “Trading volume was very light,” agrees brokerage INTL FCStone, adding that turnover in Comex gold futures was barely half its 1-month average, “among the weakest daily turnover” of 2013 to date.

 Open interest in US gold futures held flat on Monday, with the total number of contacts now live ending the day virtually unchanged from Friday below 389,000.

 The quantity of gold needed to back shares in the giant SPDR Gold Trust, the world’s biggest exchange-traded gold fund, was also unchanged Monday at a 57-month low of 866 tonnes.

 Gold bullishness amongst private investors, in contrast, rose last month to the highest level since April reports the UK’s Daily Telegraph, citing the latest Gold Investor Index from Bullionvault, “the world’s largest online market for buying physical bullion.”

 But amongst Indian consumers, the world’s heaviest gold buyers, “Sales picked uponly a couple of days before Diwali,” says the Bombay Bullion Association’s Harmesh Arora, commenting on last weekend’s festival of lights – typically the biggest season for Indian household gold demand.

 “It was nowhere enough to match up with last year’s level.”

 Thanks to the Indian government’s anti-gold import rules, “This time there were no stocks available,” says All India Gem & Jewellery Trade Federation chairman Haresh Soni, also speaking to the Wall Street Journal.

 “There was also spending tightness due to overall liquidity crunch.”

 “This Diwali was a disaster,” the paper quotes one senior jewelry chainstore manager, claiming that pre-festive sales were 50% down on 2012.

 “I have never seen such bad festival sales in 20 years,” says the director, Rajiv Popley.

 But while “there is less gold available…rural people will gradually move to silver,” says Rajesh Khosla, managing director at the part-state owned refiner MMTC-Pamp – recently approved for production of Good Delivery wholesale silver by the London Bullion Market Association.

 Demand to buy silver in India has already doubled in 2013 from full-year 2012, Reuters notes today.

 The world’s No.1 end-consumer of silver, as well as of gold, India could be set for a new annual record says a report from Japanese trading house Mitsui, overtaking the previous record of 2008 when India accounted for more than 15% of the world market.

 Over in neighboring Dubai, “Jewellery demand has been especially strong,” reports French investment bank and London bullion market-maker Societe Generale, “as it has benefitted from the tourist trade, with the increasing restrictions in the Indian market encouraging Indians to make more purchases [overseas].”

 Back in the spot market, “There was no significant economic data…to provide any direction for gold,” says Commerzbank’s precious metals team, adding that silver continues to move “more or less in line” with it.

 New data overnight showed Japan’s monetary base – the total amount of currency in circulation, plus commercial bank holdings at the central bank – rose to a new record in October for the 8th month running.

Reaching more than ¥186 trillion ($1.9trn), the monetary base stood 46% above October last year thanks to the Bank of Japan’s newly aggressive quantitative easing program of bond and other investment purchases.

 Ahead of Wednesday’s Bank of Japan policy decision, governor Haruhiko Kuroda said today the central bank “[is] ready to take appropriate policy adjustments without hesitation” to achieve its 2.0% per year target rate for consumer price inflation.

 Japanese consumer prices were flat year-on-year in September, after 15 years’ deflation.

 Meantime in the United States, any “tapering” of the US central bank’s $85 billion per month in quantitative easing “is a data-dependent program,” said St.Louis Federal Reserve president James Bullard to CNBC.

Adrian Ash

BullionVault

Gold price chart, no delay | Buy gold online


Adrian Ash is head of research at BullionVault, the secure, low-cost gold and silver market for private investors online, where you can fully allocated bullion already vaulted in your choice of London, New York, Singapore, Toronto or Zurich for just 0.5% commission.


(c) BullionVault 2013

Please Note: This article is to inform your thinking, not lead it. Only you can decide the best place for your money, and any decision you make will put your money at risk. Information or data included here may have already been overtaken by events – and must be verified elsewhere – should you choose to act on it.


Why Silver Prices Could Easily Double from Here

By Michael Lombardi, MBA

In the first 10 months of this year, the U.S. Mint sold 39.2 million ounces of silver in coins. In the same period last year, the Mint only sold 28.94 million ounces of silver in coins. A general negativity by investors surrounding silver this year has not stopped people from buying silver coins. In fact, demand is up 35% so far in 2013. (Source: U.S. Mint web site, last accessed November 1, 2013.)

Meanwhile, if I look at the chart of the gold-to-silver ratio—which shows how much silver is needed to buy one ounce of gold bullion—silver prices look undervalued. (I’ve posted the chart for my readers below.)

Chart courtesy of www.StockCharts.com

At present, it would take 60 ounces of silver to buy one ounce of gold bullion. The 200-year historical average is 37 ounces of silver to buy one ounce of gold bullion. (Source: Market Watch, July 19, 2013.) If we go back to the historical average, and we eventually will, silver prices would have to rise to $35.00 an ounce given the current price of gold bullion.

And if we look at the “natural gold-to-silver ratio,” that’s the amount of silver in the earth’s crust compared to gold, then the ratio is 17 to one. Yes, in that case silver would have to increase in price to $77.00 an ounce!

The more realistic picture, dear reader, is for silver to go back to its record high reached in April 2011 of $48.70 an once—that’s more than twice the current price of silver.

Since silver prices fell this spring, silver producers don’t have much incentive to explore for more silver—they have started to cut back on their production. So supply is soft for silver, demand is rising, and investor sentiment is very negative—the perfect scenario for silver prices to start rising again.

It’s also very interesting to note that for gold bullion prices to get back to their peak of $1,900 an ounce, they would have to increase 44% from today’s gold bullion price. But for silver prices to get back to their peak of $48.70 an ounce, they would have to rise 132% from today’s prices. Silver prices have been much harder hit than gold prices—and that tells me silver has more upside potential.

Michael’s Personal Notes:

There have been many instances when the adage “buy when there’s blood on the street” has turned out to be the best investment strategy. March of 2009 was one great example of this—there were not a lot of stock advisors saying buy stock back then as panic had set in. In the midst of this panic, the greatest buying opportunity was born.

These days, I hear stock advisors saying companies operating in the eurozone are a good buy. The words I hear thrown around are “good value” and “cheap.” My opinion on the eurozone stocks is very different. I feel the worst is yet to come for many companies operating in the weaker eurozone countries, especially the Italian banks.

I’m sticking to my original belief that the euro region is still in outright trouble and that the economic slowdown the region is experiencing could continue for a long time.

Yes, there is speculation the euro region is slowly getting out of its economic slowdown, but that opinion is not backed by the statistics—the numbers are telling a different story.

The unemployment picture in the area is not improving! In September, there were 19.47 million people unemployed in the eurozone. The unemployment rate remained at 12.2% in September, unchanged from August. (Source: Eurostat, October 31, 2013.)

What’s worrisome is the fact that the biggest economic hubs in the eurozone are seeing their unemployment rate increase. In France, the second-biggest economy in the region, the unemployment rate has risen seven percent from the same period a year ago. In September, the jobless rate in France stood at 11.1% compared to 10.4% in September of 2012. The unemployment rate in Italy, the third-biggest hub in the euro region, has increased from 10.9% in September 2012 to 12.5% in September of this year!

The root problem that created the economic slowdown in the eurozone remains—bad debt. According to Pricewaterhousecooper (PwC), the amount of bad loans has increased to 30% of all loans in Greece. At the end of 2012, this number stood at 25%, and it was 18% at the end of 2011. (Source: Kathimerini, October 31, 2013.)

To this day, there appears to be no light at the end of the tunnel for the eurozone. Buying companies operating in the region right now is risky, because we have yet to hit bottom in the eurozone. In 2009, in America, there was “blood in the street” and we hit bottom. I don’t think the eurozone has quite hit bottom yet.

This article Why Silver Prices Could Easily Double from Here is originally published at Profitconfidential


Dividend-Paying Stocks a Hold, but for the Rest of the Market?

041113_PC_clarkBy Mitchell Clark, B.Comm.

This market has been due for a major correction for quite some time. The marketplace expected it (including myself), but what we got instead was share price consolidation with continued leadership from blue chips and small-caps.

Countless stock market indices are right close to their highs, including the S&P 500, Dow Jones Industrial Average, and Dow Jones Transportation Average. There’s also the Russell 2000 Index of small-cap stocks, which has performed exceptionally well throughout this year. Finally, the NASDAQ Biotechnology Index continues to be a powerhouse wealth creator, having doubled in value over the last two years.

All this in an environment of satisfactory earnings but very little in the way of top-line growth. While the stock market has every reason to pull back significantly, fighting the Fed has proven to be unprofitable in equities. The opportunity cost of not being in the stock market since the financial crisis has been significant.

The monetary reflation has seemingly worked for the stock market so far, but it’s very clear that corporations remain unwilling to make major new investments, which would go a long way in helping the Main Street economy. Instead, they are keeping shareholders happy by returning their excess cash in the form of dividends and paying for those dividends with share buybacks. (See “If You’re Looking for Rising Dividend Income…”)

Given current information, I see no reason why prevailing conditions in capital markets might change significantly near-term. With funds continuing to flow into equities, the stock market needs a catalyst to effect a major retrenchment in share prices.

Balance sheets among many large U.S. corporations continue to get stronger. There has been an earnings multiple expansion over the last three years, but according to multpl.com, its long-run chart of the S&P 500’s price-to-earnings ratio based on trailing 12-month “as reported” earnings is well within long-run historical norms.

For investors who want liquidity, the prospect for capital gains, income, and some favorable tax treatment, the stock market is still a top asset class.

The two most important factors affecting equity prices are monetary policy and corporate financial results. The stock market and countless brand-name companies are at all-time price highs on modest earnings and lackluster sales growth. But the monetary reflation (liquidity for capital markets and very low interest rates) is still an extremely powerful underlying current for stocks. With the certainty that current monetary policy will remain near-term, the prospect for further gains in equity prices is real. With such a positive year so far for stocks, a year-end rally wouldn’t be a surprise.

It’s not a particularly good time to be sowing new positions with the stock market at all-time highs. A major correction in share prices would be a healthy long-run development. Dividend-paying blue chips are holds.

This article Dividend-Paying Stocks a Hold, but for the Rest of the Market? is originally published at Profitconfidential


Why November May Not Be So Safe for Investors

By Mohammad Zulfiqar, BA

Since the beginning of the year, key stock indices have provided investors with hefty gains; with the S&P 500 having increased more than 23% from January to October. Other key stock indices, like the Dow Jones Industrial Average and the NASDAQ composite index, have provided similar returns.

Where are they heading next?

Looking from a historical point of view, from 1970 to 2012, key stock indices aren’t as volatile for November when compared to September and October. For example, the average return on the S&P 500 for the month has been 0.95%; the highest return achieved in the time period examined was 8.9% and the lowest return was -11.38%. If we take out the highest and lowest returns, the average return on the S&P 500 for November increases to 1.06%. (Source: “Historical Price Data,” StockCharts.com, last accessed November 1, 2013.)

Looking at the data from the last 43 years, the probability of the S&P 500 providing a positive return in November is 65.11% (increased in 28 years), and the probability of the month providing a negative return is 34.88% (decreased in 15 years).

Investors have to keep in mind that the above statistics are just that: statistics. They should provide only a general idea about what to expect from a historic point of view. They need to be informed about the fundamentals of key stock indices as well. The stock markets are forward-looking animals, and past information actually may not matter.

Here’s what investors also need to know on the fundamental side.

Companies on the key stock indices have developed a dangerous trend; their corporate earnings are coming in line with expectations, but their revenues have been below estimates. For example, as of November 1, 366 companies on the S&P 500 have reported their corporate earnings and 74% of them beat the earnings estimates. However, only 53% of them were able to beat revenue expectations. (Source: “Earnings Insight,” FactSet web site, November 1, 2013.)

But the misery about the corporate earnings of companies on key stock indices doesn’t end there; they are already warning about their earnings for the fourth quarter.

Sixty-six S&P 500 companies have issued negative guidance about their fourth-quarter corporate earnings, compared to 13 that provided positive guidance. If these numbers remain the same, it would mean that more than 83% of companies on the S&P 500 that have issued their corporate earnings outlook expect earnings to be negative. That said, note that it’s too early in the quarter, and we will most likely see this number increase.

Considering all this, investors have to tread the waters carefully. Key stock indices have increased significantly and may be a little off from reality. November isn’t very volatile for key stock indices, but things can change very quickly. Investors have to keep in mind that thanks to the high frequency trading, crashes happen in a matter of minutes, rather than hours. If investors have some profits on the table, they should consider taking them off, building a cash position, and waiting for the next buying opportunity.

This article Why November May Not Be So Safe for Investors was originally published at Daily Gains Letter


Romania cuts rate 25 bps to 4.0%, fourth cut in a row

By www.CentralBankNews.info     Romania’s central bank cut its policy rate by 25 basis points to 4.0 percent, its fourth cut in a row, in a move that was expected by many economists.
    In a brief statement, the National Bank of Romania (NBR) said it’s board had also decided to pursue adequate liquidity management in the banking system and to maintain the existing level of minimum reserve requirements on both leu and foreign-currency denominated liabilities of credit institutions.
    A more detailed statement would be released later today at a press briefing, while the bank’s new quarterly inflation report would be released on Nov. 7, the bank said.
    At its previous meeting in September, the NBR said a further decline in inflation had allowed the central bank to continue easing its policy and the trend had strengthened its expectation that inflation would fall bellow the bank’s 2.5 percent target. The fall in inflation is expected to continue until the first half of next year.
    Romania’s inflation rate fell to 1.88 percent in September from 3.67 percent in August. In August the central bank lowered its inflation forecast for 2013 to 3.1 percent from 3.2 percent but the bank also said the pass-through of its lower policy rates to commercial lending rates was moderate and slow.
    The NBR has now cut rates by 125 basis points this year following cuts of 75 basis points in 2012.
    Romania’s Gross Domestic Product expanded by 0.5 percent in the second quarter from the first for annual growth of 1.5 percent, down from 2.2 percent in the first quarter.

    www.CentralBankNews.info

Why the Sizzling IPO Market Is a Massive Red Flag

051113_IC_leongby George Leong, B.Comm.

I kind of thought that buying in the stock market was somewhat euphoric and based more on the Federal Reserve’s easy money policy than solid underlying fundamentals.

A good indicator of excess in the stock market is when initial public offerings (IPOs) surge by ridiculous amounts on their first day of trading. We have seen numerous IPOs surge this year as the bullish stock market sentiment has allowed a perfect environment for companies to go and raise capital. When IPO activity picks up and new issues surge regardless of the fundamentals, you have to wonder if the stock market is setting itself up for a subsequent sell-off.

Take a look at The Container Store Group, Inc. (NYSE/TCS), which more than doubled from its $18.00 subscribed price when it debuted last Friday.

Now you may think the Container Store is a high-growth technology stock. But it’s not—not even close. The company sells boxes, packaging materials, organization units, and small gift items. That’s it. The network includes 62 stores but is expected to expand aggressively. Again, so what? There’s no way this stock deserves to double on its first day.

When a seller of boxes doubles in one day, you have to step away and pause. The stock market euphoria on IPOs is unwarranted and clearly suggests the stock market has gone mad. Take a step back and really think about taking some profits off the table.

There was also the IPO debut of China-based e-commerce classifieds web site company Beijing 58 Information and Technology Co., Ltd. (NASDAQ/WUBA), or 58.com Inc., which some dubbed the “Craigslist of the Orient.” The stock surged over 40% on its first day as a public company. In this case, not only is the corporate name somewhat suspect, but the fact that a Chinese classifieds provider is valued at around $3.3 billion based on a $25.00 stock price is absolutely a mispricing by the stock market.

I thought the taste for Chinese stocks was not there. This spike in the price of 58.com was not justified. There are much better Chinese stocks that are already listed, and they are seeing little action.

Of course, can you imagine what it’s going to be like when social networking company Twitter, Inc. lists in early to mid-November? Trust me when I say it’s going to be absolutely insane when the stock debuts. There’s going to be a lot of happy investors out there who are able to get some of the stock at the subscribed price of around $20.00. And if the Container Store is trading at $36.00, could you imagine the surge Twitter will see? It could triple on its first day.

Again all of this IPO frenzy should be a massive red flag; it may be time to take some profits off the table.

This article Why the Sizzling IPO Market Is a Massive Red Flag was originally published at Investment Contrarians