Finally, Someone Else Says Housing Market Rebound Suspicious

081113_DL_zulfiqarby Mohammad Zulfiqar, BA

It’s as bad as expected, or should I say so far so good? I have been critical about the housing market in the U.S. economy for some time now; I don’t buy the blind optimism that is heard in the mainstream these days, which states the housing market will continue to increase at the rate we have seen in 2012. I stand in the camp that says we are not going to see a crash like the one we saw not too long ago, but at the same time, the increase in the U.S. housing market won’t be as exuberant as we witnessed last year—in fact, we might even see a correction going forward.

It’s not just me saying this; Fitch Ratings also agrees with this notion. According to its U.S. RMBS Sustainable Home Price and Economic Risk Factor Report, home prices in the U.S. housing market are overvalued by 17% as per Fitch’s Sustainable Home Prices (SHP) model. The rating agency said that the U.S. housing market has increased 20% year-over-year; this is the highest growth rate in any time in the last 10 years. (Source: “Fitch: Several U.S. Cities Nearing Bubble-Year Home Price Peaks,” Fitch Ratings web site, November 6, 2013.)

Here’s why the housing market looks to be facing hardships going forward.

The U.S. economy is still in trouble, as the financial crisis has left deep wounds that haven’t healed. If someone doesn’t have enough income to pay for their expenses and they’re relying heavily on government assistance, such as food stamps, would they actively look to buy a home? I don’t think it would be their first priority.

In addition to this, the mortgage rates have increased substantially since May of this year. This is all thanks to the quantitative easing taper speculation. What it has done is send those who were thinking of entering the housing market away. When the mortgage rates increase, it makes it more expensive for an individual to own a house. For example, According to the National Association of Realtors, 28% of all existing home sales in the U.S. housing market in September were from first-time home buyers. Compared to last year, this number has declined 12.5% from the same period a year ago. (Source: “Existing-Home Sales Down in September but Prices Rise,” National Association of Realtors web site, October 21, 2013.)

Worst of all, the U.S. housing market saw an influx of investors coming in and buying homes in bulk with cash. We have seen this in the past, when companies like Blackrock, Inc. (NYSE/BLK) purchased a significant amount of residential properties for the sole purpose of renovating and renting them out.

With all this in mind; one must wonder what happens to the homebuilder stocks, since they are closely related to the housing market.

Truth be told, if the housing market in the U.S. economy faces hurdles, the homebuilder stocks will face a precarious future ahead. If investors are heavily invested in them, this may be the time to think and reflect on what’s happening in the U.S. housing market. If they insist on keeping those stocks, then they should consider taking some profits off the table.

This article Finally, Someone Else Says Housing Market Rebound Suspicious was originally published at Daily Gains Letter

Euro Slightly Lower Against Greenback amid ECB Rate Cut

By HY Markets Forex Blog

The 17-nation euro  traded slightly lower against the US dollar on the first day of the trading week, extending last week’s drop  after the European Central Bank revealed its surprising decision to trim its interest rate to a new record-low.

A string of upbeat US macro releases dragged the euro to its lowest level in two month, dropping below the $1.3400 mark.

The euro traded flat, standing at $1.3366 against the US dollar as of 6:40am GMT, while the economic slowdown in the eurozone led the ECB to reduce its borrowing cost to a new record-low.

“While no follow up move is likely in December, ECB officials have been happy to flag that further action could be taken as needed, such as another LTRO, adjusting forward guidance or even a negative deposit rate. Data flow including euro zone Q3 GDP should encourage fresh bearish EUR positioning after IMM speculative accounts built a sizeable long stance from August to late October. Look to sell into any rallies to high 1.34s, with an obvious near term target the 200 daily moving average around 1.3215 but scope for further losses if US data keeps alive ‘taper’ hopes for a little longer,” analysts from Westpac Global Strategy Group wrote in a note on Monday.

Preliminary gross domestic product (GDP) reports  from some of eurozone major economies are expected to be released later this week. The eurozone is expected to rise 0.1% in the third quarter. The economic output for the eurozone is forecasted to come in at 0.3% year-on-year in the third quarter.

ECB cuts rate

The European Central Bank (ECB) revealed its surprising decision after its November meeting on Thursday, when it cut its main interest rate to a new all-time low.

The ECB trimmed its benchmark interest rate by 25 basis points to a new record low of 0.25%, analysts had expected the bank to keep its benchmark rate unchanged.


Visit www.hymarkets.com   to find out more about our products and start trading today with only $50.

The post Euro Slightly Lower Against Greenback amid ECB Rate Cut appeared first on | HY Markets Official blog.

Article provided by HY Markets Forex Blog

Gold Prices Could Extend Losses Incurred After Jobs Report, says Technical Analysis

By HY Markets Forex Blog

The decline that gold prices suffered on Nov. 8 after the U.S. jobs report was released could easily be extended in the near future, market experts stated, citing technical analysis.

This information could be very helpful to those who want to make money trading the precious metal, as being aware of the latest developments – as well as the predictions that have been generated using technical analysis – could enable these individuals to make better, more informed decisions.

Gold plunges in value

December contracts for the metal plunged to as little as $1,280.50 per ounce on the Comex division of the New York Mercantile Exchange, according to Bloomberg News. For a most-active contract, this represented the lowest figure since Oct. 17. The future later recovered and settled at $1,284.60 an ounce. This price represented a loss of 1.8 percent for Nov. 8.

The sharp decline in the price of the precious metal was attributed to a jobs report that provided strong figures and the boost that it provided to hopes that the Federal Reserve will engage in tapering of quantitative easing later this year, the media outlet reported.

Data provided by the U.S. Labor Department revealed that in October, 204,000 positions were added to payrolls, according to the news source. This figure was far higher than the median forecast of 120,000 new jobs, which was provided by economists taking part in a poll.

“To say the October nonfarm payrolls report has exceeded forecasts is an understatement,” Fawad Razaqzada, technical analyst at GFT Markets, wrote in a recent note, MarketWatch reported. “The numbers absolutely blew past expectations. After yesterday’s surprisingly strong U.S. GDP figure, this has strengthened the argument for the Fed to reduce stimulus before the end of this year … And because of that reason, gold prices have plunged today.”


Decline sparks technical analysis

Kitco News reported that after the sharp drop in the price of gold, many market experts started reading charts in an effort to predict when the decline would end. Jim Wyckoff, senior analyst at Kitco Metals, stated that the sentiment surrounding gold was undermined as a result of contracts for the commodity falling below $1,300 per ounce. He said that the contract could easily encounter further support at $1,251 an ounce.

The level of $1,250 per ounce was also identified as being crucial by Sterling Smith, who is a futures specialist, commodity research, at Citibank Institutional Client Group, according to the news source. He stated that reaching this price level is inevitable given the amount of pessimism that surrounds the precious metal.

These two market experts are certainly not the only ones to express negative sentiment surrounding the commodity. Gold entered a bear market in April, having dropped 20 percent from its record high that it attained in 2011. The metal then continued its free fall, declining to less than $1,200 an ounce in June.

Some experts lose faith in gold

Amid the sharp declines that gold has suffered in 2013, some market experts have come out and stated that they no longer think of the precious metal as being the safe-haven asset that it was before, Bloomberg reported. The price of gold is down 23 percent for the year.

As a result of this sharp decline, the precious metal is currently on track to record its first annual loss in 13 years. Gold experienced annual gains between 2000 and 2012, and experienced very robust appreciation during this period.

While the precious metal has frequently been propped up as the ultimate safe haven, this perception has been breaking down in 2012 as gold has experienced lackluster performance. Since many market experts are starting to think of the commodity in a new way, individuals who want to make money trading gold might benefit from being aware of this change in sentiment.


The post Gold Prices Could Extend Losses Incurred After Jobs Report, says Technical Analysis appeared first on | HY Markets Official blog.

Article provided by HY Markets Forex Blog

Why Did Institutions Sell 29 Million Apple Shares?

081113_IC_leongby George Leong, B.Comm.

Apple, Inc. (NASDAQ/AAPL) is maintaining its position as the top seller of smartphones in the U.S., but in the more important global market, Apple is trailing behind its competitors. Unless Apple gains traction in China and the emerging markets, the stock is going nowhere—and that is exactly what institutional money is saying. In the last six months, institutions sold a net 29.14 million shares of Apple, cutting institutional ownership by 5.5%, according to Thomson Financial. The takeaway point in this scenario? When institutions sell, you need to take note and follow the pro money.

Simply put, by looking at where the institutional money is flowing, you can get a better sense of the market. Institutional investors are the money guys who have better access to important information and know when it’s time to jump ship. When a top-ranked analyst says jump, it’s usually wise to jump.

Take a look at the high momentum Internet services stocks. Institutional ownership is declining here, and I’m not surprised, given the massive run-up in prices this year.

Netflix, Inc. (NASDAQ/NFLX) has been the current target of heavy selling by institutions, as the share price surged above $300.00 and the valuation got out of whack at 86 times (X) its estimated 2014 earnings per share (EPS) and a massive price-to-earnings growth ratio at 8.62. Talk about overvalued! Institutions realize this, and over the past six months, 16.13 million shares were dumped, representing a decline of 4.5% in institutional ownership, according to data from Thomson Financial.

Even insiders at Netflix are selling, with 1.06 million shares sold via 26 transactions. On November 4, Neil Hunt, Netflix’s chief product officer, exercised an option to buy 5,000 shares at $54.50 per share and immediately sold at $330.95 per share.

            Chart courtesy of www.StockCharts.com


Online deal provider Groupon, Inc. (NASDAQ/GRPN) also saw heavy selling by institutions after its run-up, with 29.77 million shares sold, representing a 7.55% decline in institutional ownership.

While many of the Dow Jones industrials are seeing institutional selling, there are a few exceptions. These tend to be the companies that are defensive and could handle some stalling in the economy.

Companies that are being purchased include the more defensive and lower-risk plays. For example, consumer products company Johnson & Johnson (NYSE/JNJ) saw a 1.01% rise in institutional ownership, or 19.60 million shares, over the past six months. Johnson & Johnson makes products that people will always need, regardless of the economic climate.

AT&T, Inc. (NYSE/T) saw a massive 285.7 million shares added by institutions, or an 8.01% jump in institutional ownership. The chart below shows the sideways channel and AT&T’s possible upcoming breakout at $37.00.

            Chart courtesy of www.StockCharts.com


As we move forward, I suggest you take some profits on some of the high-momentum stocks. Also take a look at your stock market portfolio and see if the institutions are selling any of the positions you hold; institutional selling can be a good indicator that you should also lighten up on some of your stocks.

This article Why Did Institutions Sell 29 Million Apple Shares? was originally published at Investment Contrarians


Economic “Growth” in Eurozone a Hoax?

081113_IC_cekerevacby Sasha Cekerevac, BA

Most readers, I’m sure, are aware of how weak the eurozone has been over the past few years. That area has had essentially no economic growth at all for quite some time.

But now, eager to find any investment opportunity, some investors are looking at the eurozone as a value play, hoping for a turnaround and a possible acceleration in economic growth. These thoughts of investing in the eurozone, however, are based primarily on hope. As I said, there are no signs of economic growth emerging at all. But you don’t have to take my word for it…

Recently, the European Commission issued its forecasts and, well, the news wasn’t good.

According to the European Commission, real gross domestic product (GDP) growth in the eurozone on an annual basis this year will be -0.4%—meaning contraction. For 2014, estimates are for a mere 1.1% growth, and in 2015, that number only increases to 1.7%. (Source: “Autumn 2013 Economic Forecast,” European Commission, November 5, 2013.)

I’m sure this isn’t breaking news to my readers: another year, another weak level of poor economic growth in the eurozone.

What’s interesting, however, is how the European Commission calculated its estimates. According to the European Commission, economic growth in the region will be a result of “resuming private consumption growth and the rebound in gross fixed capital formation.” (Source: Ibid.)

Capital formation I can understand; money can easily move to areas that offer the best opportunity. However, expecting private consumption to drive growth in this region surprises me.

If you think America is having a tough time with unemployment, you obviously haven’t been to the eurozone lately. The region has massive levels of unemployment and no income growth at all. The report itself forecasts that the eurozone will have an unemployment rate of 11.8% in 2015!

Are we living in a world where unemployment of 11.8% somehow magically becomes a positive driver for economic growth? Call me crazy, but I don’t think that’s a recipe for a burst in consumer spending.

But it doesn’t end there: the report specifically states the forecast is dependent on domestic demand being the main driver of economic growth “against the background of a weakened outlook for EU exports to the rest of the world.” (Source: Ibid.)

The commission is literally saying that it forecasts a lack of economic growth throughout the rest of the world, yet the eurozone will be so strong domestically, that the region can drive economic growth all by itself.

Am I missing something? When I think of economic growth, the eurozone is certainly not on the top of my list.

Below is a chart of the eurozone exchange-traded fund (ETF) the Vanguard European VIPERS (NYSEArca/VGK).

            Chart courtesy of www.StockCharts.com


By looking at this chart, you would think the eurozone is on fire with a huge increase in economic growth. However, the reality is that the eurozone would be lucky to have positive economic growth this year—to even achieve one-percent economic growth in 2014, all its stars would need to align perfectly. And again, unemployment is still well into the double digits.

Let’s face it: looking at this chart, it’s apparent the market has moved up far ahead of the actual data, which are still showing a very weak economic growth level for the region. Clearly, investors have become far too optimistic and are hoping for better conditions.

I understand that as an investor, you would like to get in “ahead” of the crowd. But with no sign of unemployment dropping and a lack of fundamentals to support the seemingly skyrocketing market, the building blocks of a strong, long-term investment are missing.

If you have money in a fund with eurozone investments, now would probably be a good time to take profits.

This article Economic “Growth” in Eurozone a Hoax? was originally published at Investment Contrarians


Monetary Policy Week in Review – Nov 4-8, 2013: 4 central banks cut as countries look to currencies to boost growth

By CentralBankNews.info
    Last week central banks worldwide continued to loosen monetary policy, either by cutting policy rates or by pushing down exchange rates, underscoring the lack of inflationary pressure and sluggish global demand.
    Financial markets were largely caught by surprise by the easing, whether it was rate cuts by the European Central Bank (ECB) and Peru’s central bank, the Czech Republic’s decision to intervene in currency markets or Denmark’s decision to break with tradition and keep rates despite the ECB cut.
    But what is now less of a surprise, and more worrying, is the growing use of exchange rates as a policy tool, either to prevent deflation or to boost exports by making them cheaper.
    This is happening despite the oft-repeated assurances by global policy makers that “we will refrain from competitive devaluations and will not target our exchange rates for competitive purposes,” to quote the Group of 20’s latest declaration from St. Petersburg, Russia.
    A 7 percent rise in the euro against the U.S. dollar from early July to late October undoubtedly caused some concern, albeit so far unspoken, among ECB policy makers. But it was left to Australia to lift the veil and point out the uncomfortable truth that many countries are now pinning their hopes on exports to boost growth as interest rates are already cut to historic lows and growth remains lacklustre.
    The Australian dollar is “uncomfortably high,” bemoaned Glenn Stevens, governor of the Reserve Bank of Australia.
    “A lower level of the exchange rate is likely to be needed to achieve balanced growth in the economy,” he said, continuing his recent campaign to talk down the Aussie and boost exports.
    While ECB President Mario Draghi did not refer to exchange rates – a fall in inflation gave him more than enough reason to cut rates – the reaction of markets to this week’s events was the same, a result that must have pleased many policy makers.
    The euro dropped from 1.35 to the U.S. dollar to 1.34, the Australian dollar dropped from 0.95 U.S. dollar to 0.94, the Czech koruna fell from 25.8 to the euro to 27 and Peru’s sol fell to 2.79 to the U.S. dollar from 2.77.
    At the moment policy makers’ explicit or implicit use of exchange rates is not on the political agenda, but  the obvious danger of a global beggar-thy-neighbor policy will undoubtedly soon surface if the global economy continues to be stuck in a rut.

     A total of 17 central banks decided on their monetary policy stance last week, with four cutting rates (ECB, Peru, Romania and Serbia) while the other 13 banks maintained their rates, accelerating this year’s dominant trend of rate cuts.
    The banks that maintained their rates include Zambia, Uganda, Tunisia, Australia, Kenya, Georgia, Iceland, Poland, the United Kingdom, Denmark, Malaysia, the Czech Republic and Russia.
    The four rate cuts this week raised the total number of rate cuts this year to 102. But the percentage of decisions favouring easier policy was unchanged on the week at 23.2 percent of this year’s 439 policy decisions by the 90 central banks followed by Central Bank News. Compared with end-June, the percentage of rate cuts is still down from 25.3 percent after six months, reflecting the upward shift in rates among some of the major emerging markets.
    There were no rate rises this week, leaving the number of rate increases this year steady at 23 for the second week in a row. The percentage of rate rises was steady at 5.2 of this year’s 439 decisions, up from 4.7 percent at the end of the first six months.

    LAST WEEK’S (WEEK 44) MONETARY POLICY DECISIONS:

COUNTRYMSCI     NEW RATE           OLD RATE         1 YEAR AGO
ZAMBIA9.75%9.75%9.25%
UGANDA12.00%12.00%12.50%
TUNISIAFM4.00%4.00%3.75%
AUSTRALIADM 2.50%2.50%3.25%
ROMANIAFM4.00%4.25%5.25%
KENYAFM8.50%8.50%11.00%
GEORGIA3.75%3.75%5.50%
ICELAND6.00%6.00%6.00%
POLANDEM 2.50%2.50%4.50%
SERBIAFM10.00%10.50%10.95%
UNITED KINGDOMDM0.50%0.50%0.50%
EUROSYSTEMDM0.25%0.50%0.75%
DENMARKDM0.20%0.20%0.20%
MALAYSIAEM 3.00%3.00%3.00%
CZECH REPUBLICEM0.05%0.05%0.05%
PERUEM4.00%4.254.25
RUSSIA (NEW RATE)EM5.50%5.50%8.25%


    This week (week 46) seven central banks are scheduled to hold policy meetings, including Sri Lanka, Latvia, Armenia, Indonesia, Croatia, Mozambique and South Korea.
    The Bank of England will release its highly-anticipated inflation report on Wednesday. The report is expected to show that the UK economy is growing faster than previously expected with the unemployment rate hitting the BOE’s 7.0 percent threshold prior to mid-2016, paving the way for an earlier-than-projected rate rise.
    The past and future of U.S. monetary policy will be scrutinized on Thursday as Janet Yellen, nominated to succeed Federal Reserve Chairman Ben Bernanke, testifies to the Senate Banking Committee.

COUNTRYMSCI             DATE CURRENT  RATE        1 YEAR AGO
SRI LANKAFM11-Nov6.50%7.75%
LATVIA11-Nov2.50%2.50%
ARMENIA12-Nov8.50%8.00%
INDONESIAEM12-Nov7.25%5.75%
CROATIAFM13-Nov6.25%6.25%
MOZAMBIQUE13-Nov8.25%9.59%
SOUTH KOREAEM14-Nov2.50%2.75%

    www.CentralBankNews.info

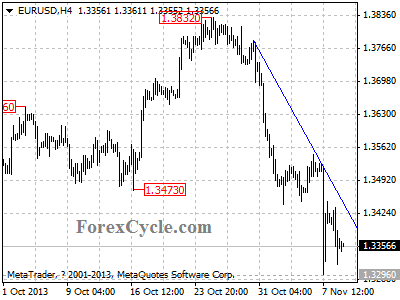
EURUSD stays below a downward trend line

EURUSD stays below a downward trend line on 4-hour chart, and remains in downtrend from 1.3832, the rise from 1.3296 could be treated as consolidation of the downtrend. Key resistance is now at 1.3450, as long as this level holds, the downtrend could be expected to resume, and next target would be at 1.3200 area. On the upside, a clear break above the trend line resistance will indicate that the downtrend from 1.3832 had completed at 1.3296 already, then the following upward movement could bring price to 1.4000 zone.

eurusd

Provided by ForexCycle.com

Sri Lanka holds rate steady on benign inflation outlook

By CentralBankNews.info
    Sri Lanka’s central bank held its benchmark repurchase rate steady at 6.50 percent, as expected, saying the outlook for inflation remains benign, exports are continuing to improve and there are signs of a take-off in credit to the private sector.
    The Central Bank of Sri Lanka cut its rate by 50 basis points last month for total cuts of 100 basis points this year and said the easing of policy continued to yield the desired positive effects.
    “Going forward, the inflation outlook continues to remain benign, with subdued international commodity prices, reduced supply side pressures, and well contained demand driven inflationary pressures,” the central bank said, adding:
    “In this background, according to current projections, inflation is expected to remain at mid-single digit levels throughout 2014 as well.”
    Sri Lanka’s annual inflation rate rose to 6.7 percent in October from 6.2 percent but the annual average eased to 7.6 percent from 7.8 percent. Core inflation continued its declining trend, falling to an annual rate of 2.6 percent from 3.0 percent.

    The central bank aims for inflation to fall to 5.0-5.5 percent by the end of the year for an average rate of 7.0 percent.
    On Nov. 1 the central bank governor of Sri Lanka said inflation should slow to between 4 percent and 6 percent next year unless there is a major supply shock.
     Sri Lanka’s broad money growth increased to 16.3 percent on an annual basis in September from 15.3 percent due to a significant increase in net foreign assets, the bank said, and credit disbursed to the private sector by domestic banking units of commercial banks rose by around 20 billion rupees during September “indicating some early signs of a take-off in credit,” the bank said.
    Exports are continuing to improve, the bank said, heightening expectations of sustained growth in export proceeds during the rest of the year, while imports are expected to decline marginally this year, leading to a narrower trade deficit.
    “Meanwhile, the recent positive developments in advanced economies raising the prospect of a global economic turnaround, may also result in increase inflows to the financial sector account, thereby strengthening the BOP and increasing the reserve position further, in the near term,” the bank said in a much more upbeat assessment than in October when it voiced concern of market volatility due to the U.S. Federal Reserve’s delay in tapering it asset purchases and the shutdown of the U.S. government.
    Sri Lanka’s gross official reserves rose to USD 7.1 billion at the end of October from 7.0 billion in August, equivalent of 4.5 months of imports, while the current account deficit narrowed to 95.1 billion rupees and the central bank expects the deficit to shrink further due to inflows from the export of goods and services and workers’ remittances.

    www.CentralBankNews.info

Fortunes Are Still Made in Recessions…

By MoneyMorning.com.au

Not many (if any) in the mainstream predicted the 2008 financial meltdown.

Those who predicted the event (if not the timing) were from outside the mainstream. They were on the fringe of financial and economic analysis.

That’s why few heeded their message.

Some of the few to predict the financial meltdown were our pals over at The Daily Reckoning. They warned that the financial system was over-leveraged and heading for a collapse.

That happened in 2008. It was the worst financial collapse in living memory. Banks went bust and even national governments went close to the brink.

It was the end of the world. Or was it? Since then the unthinkable has happened. The US market has broken through to a new high. And the talk is of an economic recovery. Yet, as a percentage of GDP, the US national debt has almost doubled since 2008 and unemployment is still high.

What’s going on?

In a moment we’ll show you two key charts.

They highlight the mistake that many made following the 2008 collapse.

At the time many believed it would take years for stock markets to recover. The most common comparison was with the Great Depression. Following the Great Depression it took 25 years for the market to recover to the 1929 high.

This time it took the Dow Jones Industrial Average just five years to recover.

An Important Lesson for Investors

It’s important you see and understand the following chart:

Source: Federal Reserve Bank of St Louis

It’s a chart of the Dow Jones Industrial Average from 1895 to the current date.

The grey shaded bars indicate official US recessions.

Now we’ll show you another chart. This one is of the US federal debt as a percentage of GDP:

Source: Federal Reserve Bank of St Louis

This chart is from 1966 to the current date.

Since 1980, US federal debt has climbed from around 30% of GDP to the current level of more than 100% of GDP. During the same time the US economy has gone through four official recessions.

That’s bad news right? You’d think so, but at the same time, the Dow Jones has climbed from 820 points to 15,761 points. That’s a gain of 1,688%.

These charts provide investors with an important lesson. They show why although we understand and take note of macro-economic events and data, we don’t let it rule our investment decisions.

This Doesn’t Look Like a Bubble to Us

If you had followed the macro data you would probably have run a mile from the stock market. That was understandable, because the macro data looked – and still looks – awful.

Debt up. Unemployment up. Economic growth almost stagnant. China faltering.

What is there to cheer about?

Well, there’s plenty to cheer about. But you wouldn’t know that if you spent all your day wading through largely meaningless macro-economic data. That’s why we call it ‘paralysis by macro analysis’.

Yes, governments are in debt. But that’s not news. More important is the fact that businesses continue to innovate and grow.

We see innovation all the time. It’s why technology stocks in particular have done so well over the past few years. In the mainstream look at Google [NASDAQ: GOOG] and Apple [NASDAQ: AAPL]. These stocks are up 229% and 510% respectively since the March 2009 low.

Elsewhere in technology is one of the innovations we’ve followed closely – 3D printing. It’s within touching distance of hitting the mainstream. And the stock we’ve followed has gained 53% in just five months.

That’s not to say investors are suddenly revelling in optimism. In fact, that’s the biggest surprise. The US market has hit record highs without the level of irrational exuberance you tend to see leading up to the top of the market.

That’s another reason why, for all the talk of a price bubble, we say stock prices still have much further to go…

A Recession is Good News for Speculators

The old theory is that you know when the market has hit the top because that’s when most ordinary investors start buying stocks.

It’s a sad fact that many investors do the opposite of what they’re supposed to do. Instead of buying low and selling high they tend to panic buy at the top of the market and then panic sell at the bottom of the market.

That kind of indiscipline then has them whinging for the next few years that the stock market is a losers’ game. They maintain that view until they see stocks rising all the way to a new top.

Finally, they decide they were wrong about stocks, so they buy…just as the market is about to crash again. Those types of investors will never make money from stocks because they don’t understand investing.

Don’t get us wrong. As you know from reading Money Morning, we know the market and the global economy is far from perfect. But that doesn’t mean you can’t make money as an investor.

Look at those charts again. Recessions are a fact of life in this manipulated economy. They happen. But what you can also see from those charts is that it’s still possible to make money from stocks, whatever the macro-economic picture.

In fact, as we’ve long argued, fortunes are made in recessions.

Look, folks can feel free to sit on the sidelines and moralise about the perils of excessive debt. We’ll nod and agree with them. But while they’re sitting there doing that, we’ll make the most of our time by looking for and investing in quality, innovative and growing companies that can help investors grow their wealth.

To our mind that’s a much more productive way for you and us to spend our time.

Cheers,
Kris+

From the Port Phillip Publishing Library

Special Report: Read This or Retire Poor