How to Find Trading Opportunities in ANY Market

Learn to trade an ending diagonal — a high-confidence Elliott wave pattern

By Elliott Wave International

Senior Analyst Jeffrey Kennedy is the editor of our Elliott Wave Junctures trader education service and is one of our most popular instructors. Today, Jeffrey shares a video
lesson about trading one of his favorite Elliott wave patterns, the diagonal.

You can apply these methods across any market and any time frame.


There are two major types of Elliott wave structures — motive and corrective. Within these two categories, motive waves include impulse waves and ending diagonals. Zigzags, flats and triangles are all corrective wave patterns.

Today, we are going to examine an ending diagonal in Union Pacific (UNP).

An ending diagonal is an easily discernible wave pattern because it looks like a rising (or falling) wedge. Specifically, it is a five-wave overlapping pattern wherein each wave subdivides into three smaller waves. Also, trendlines connecting the extremes of waves one and three, and two and four, often converge.

Ending diagonals can form only in the fifth wave position of an impulse wave or the wave C position of an A-B-C formation.

Price behavior following an ending diagonal is quite impressive because it tends to be swift, retracing the entire length of the pattern.

The guideline covering the resolution of an ending diagonal tells us that it will be more than fully retraced in one-third to one-half the time it takes the pattern to form, just like it did in this case.

Watch this 4-minute video where I explain more:


If you are ready for more lessons on how to become a more successful technical trader, get Jeffrey Kennedy’s free report, 6 Lessons to Help You Spot Trading Opportunities in Any Market.

Jeffrey has taught thousands how to improve their trading through his online courses, his international speaking engagements, and in his trader education service Elliott Wave Junctures.

This free report includes 6 different lessons that you can apply to your charts immediately. Learn how to spot and act on trading opportunities in the markets you follow, starting now!

Access Your Free Report Now >>

This article was syndicated by Elliott Wave International and was originally published under the headline How to Find Trading Opportunities in ANY Market.
EWI is the world’s largest market forecasting firm. Its staff of full-time analysts led by Chartered Market Technician Robert Prechter provides 24-hour-a-day market analysis to institutional and private investors around the world.

EURUSD Forecast for This Week

Article by Investazor.com

For better understanding the future movement of the EUR/USD currency pair we should take a look over last week’s events.

Wednesday we published our scenarios for what could happen at the ECB monetary policy from the next day and one of the preferred scenarios was for the ECB to cut the interest rate. Unexpectedly, on Thursday, the ECB has cut the minimum bid rate to 0.25% and mentioned that it can be lowered if needed. This had a negative impact for the Euro, which dropped in front of the US dollar.

eurusd-week-forecast-resize-12.11.2013

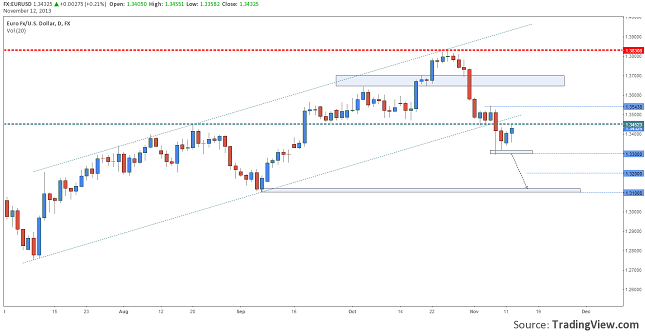
Chart: EURUSD, Daily

The uptrend became sensible when the price of EURUSD broke the 1.3450 support and the trend line. On Friday the United States posted the Non-Farm Employment change above the expectations, sending the US dollar higher.

From the technical point of view we can see that the price has stabilized itself around 1.3400 with a very good support at 1.3300 and a key resistance at 1.3450. A daily close above this resistance could mean a rally towards 1.3500, but our preferred scenario would be a rejection from 1.3450/70 followed by a drop under 1.33 with a target of 1.3200.

The drop in the price would also be sustained if the flash GDPs and the Industrial Production for the Euro Area will be published in line or under the estimates, while for the USA the Trade Balance and the Unemployment Claims would surprise with better readings.

The post EURUSD Forecast for This Week appeared first on investazor.com.

3 REITs to Buy During the Next Round of “Taper Tantrum”

By The Sizemore Letter

REITs are on sale again.  Last week’s better-than-expected jobs report sent bond yields soaring and caused the prices of anything that “looks” like a bond—such as conservative REITs—to drop like a rock.

We’ve seen this show before, and we already know how it ends.  It appears that we’ve fallen into a repeating cycle:

  1. Fed announces that quantitative easing will continue indefinitely, so long as employment picture is weak.
  2. Yields fall and the prices of income investments drift higher.
  3. A positive blip of economic data causes investors to panic, fearing that tapering is imminent.
  4. Yields soar and the prices of income investments plummet.
  5. Fed clarifies that economy is still weak…and reiterates step one.

I don’t want to get into the game of Fed handicapping because, as we’ve seen over the past six months, the Fed seems to have a real talent for doing the unexpected.  But just for grins, let’s take a look at the jobs report that caused the last selloff.

The economy added 204,000 jobs in October, significantly higher than the 120,000 expected by the Street.  Yet the unemployment rate actually ticked up a little, from 7.2% to 7.3%.  Average hours worked was unchanged, and the number of persons employed part time rather than full time for “economic reasons” was little changed.  And the labor force participation rate—which Chairman Bernanke took note of in his last announcement—declined fairly sharply from 63.2% to 62.8%.

Most importantly, one month does not make a trend, and all of these numbers are subject to revision.

Will the Fed taper this year?

Maybe.  Maybe not.  I’m not sure if even Chairman Bernanke or Janet Yellen know the answer to that question at this point.  But regardless, my income strategy is the same.  I am opportunistically picking up shares of REITs that are raising their dividends whenever I see a selloff.  And today, I’ll share five of my favorites.

The first is Realty Income (O), also known as the “Monthly Dividend Company.”  Realty Income has been a dividend-paying and dividend-raising monster since going public in 1994.  In 19 years, it’s made 519 dividend payments and hiked the dividend 73 times.
Realty-Income-Dividends

Realty Income’s conservative portfolio of triple-net-leased properties has been a rock of consistency throughout the past five years of on-again, off-again crisis.  But that bond-like stability is exactly what is hurting the share price today.  Because the company locks its tenants into long-term leases, rents tend to rise slowly and consistently.  That’s great during a time of stable or falling bond yields.  But when yields are soaring–as they are today–it makes the REIT less attractive as a bond substitute.

At $40.00, Realty Income sports a current dividend yield of 5.46%. And again, the payout will almost certainly grow with time, raising your yield on cost.  Given the quality of the portfolio–and given its history of weathering crisis–I would gladly take 5.5% from Realty income over 2.7% from “safe” Treasuries from a bankrupt and disfunctional federal government.

I recommend accumulating shares of Realty Income at or below $42.00.  I’m actually comfortable buying at higher prices, but I see no reason to pay them at this time.  Be patient and accumulate  new shares every time we get a taper scare.  You’re locking in a great yield on a stock you can hold forever.  And yes, I mean “forever” literally.

Next on the list is National Retail Properties (NNN), a competitor of Realty Income’s in the triple-net retail space. For those unfamiliar with the term, in a “triple net” lease the tenant is responsible for property taxes, insurance and maintenance.  If a pipe breaks or a health inspector discovers black mold, it’s not the landlord’s problem.

This makes the revenues and profits of triple-net leased properties ridiculously stable, assuming your tenants are good credits and your occupancy rates are stable.  And this is certainly the case for National Retail Properties.  The REIT owns 1,850 properties across 47 states with a total gross leasable area of approximately 20.3 million square feet. Current occupancy is 98.1%.

Tenant concentration is sometimes a risk for triple-net landlords.  Not so for National Retail Propertoes.  The REIT has more than 350 tenants in 38 industry classifications.
National-Retail-Properties-Dividends
National Retail Properties has raised its dividend for 24 consecutive years and currently yields 5.0%.  I would recommend buying every time it dips below $35.00.

And finally, we come to Digital Realty Trust (DLR), a REIT that specializes in data centers.  2013 has been a rough year for REITs in general, but DLR has been beaten like the proverbial red-headed stepchild. Earlier in the spring, hedge fund Highfields Capital made a very public short bet on Digital Realty, noting that the REIT was facing new competition from the likes of Amazon.com (AMZN), Microsoft (MSFT) and Google (GOOG) among others.
chart

Digital Realty’s quarterly earnings seemed to confirm this; earnings came in below expectations, and funds from operations (FFO) were actually down year over year.  And management has lost serious credibility with Wall Street, as they fumbled an announced accounting change (which actually brings the REIT more in line with GAAP) and have generally done a poor job of communicating.

Yet this bearish story doesn’t seem to fit reality. The REITs two primary competitors–CoreSite Realty (COR) and DuPont Fabros Technology (DFT)–have been reporting healthy FFO increases, indicating that the macro environment cannot be as bad as Highfields seems to think.  And Digital Realty has continued to grow its portfolio, with lease signings through the first three quarters of 2013 already higher than full-year 2012.

Digital Realty is a very different type of REIT than O or NNN.   It operates in a more volatile sector and lacks their long track records.  But as an investor, you’re also getting paid handsomely to accept these risks.  Digital Realty sports a current yield of 6.8%, and the payout has been growing steadily.

Company insiders certainly appear to see value.  Three officers have made significant purchases since August, buying throughout the share price decline.

Again, Digital Realty is more speculative than O or NNN.  But at current prices, I would hardly call it risky.  I would recommend accumulating shares below around $52.00 per share.  At time of writing, the shaes traded for $46.03.

Charles Lewis Sizemore, CFA, is the chief investment officer of the investment firm Sizemore Capital Management. As of this writing, he was long O and NNN. Click here to receive his FREE 8-part investing series that will not only show you which sectors will soar, but also which stocks will deliver the highest returns. This series starts Nov. 5 and includes a FREE copy of his 2014 Macro Trend Profit Report.

This article first appeared on InvestorPlace.

This article first appeared on Sizemore Insights as 3 REITs to Buy During the Next Round of “Taper Tantrum”

Join the Sizemore Investment Letter – Premium Edition

Time Frame Analysis Explained in Forex

While many forex traders and investors only use one time frame to analyze currency, it is a great advantage for amateur forex traders to familiarize themselves with utilizing multiple time frames. Multiple Time Frame Analysis (MTFA) is the assessment of very basic, fundamental forex trend indicators and forex charts, beginning with the largest trends and timeframes, and working backwards down through smaller timeframes to understand how the smaller timeframes and trends supply the larger timeframes. If a larger trend is established on a specific currency pair, analysts have to enter the trade when the smaller trends and time frames are congruent with the larger trends. According to forextraders.com, the social forex network, theorists review charts of many different time frames in order to arrive at their most likely wave counts. Even though utilizing multiple time frames may require effort, this method is imperative for analyzing currency prior to entering a trade and risking money.

What is the MTFA Breakdown?

For amateur forex traders to get a strong grasp of the forex market, the principles of Multiple Time Frame Analysis should be used daily. Technical analysts use methods to provide forecasts for particular currency pairs. MTFA provides the most accurate assessments available to forex traders looking for logical predictions based on evidence. There are five types of MTFA:  intraday-time frame, short-time frame, intermediate-time frame, long-term time frame and very long-term time frame.

The intraday-time frame covers trading that occurs mostly within the current trading day; analysts use charts with short bars to analyze the current price actions. With this information, traders can look for clues that the market might be changing or reversing. The short-time frame covers trading from the previous month or less; analysts use hourly or four-hour bar charts to review the price action data. Traders can use this time frame to improve objective plans for how to trade in the upcoming week. The intermediate-time frame covers trading that has occurred over the last few months; analysts use a chart with daily bars for examination. Traders can use this data to identify trends more easily. The long-term time frame covers the price action that has been seen during the last several years; analysts use weekly bar charts to get a good picture of the extended time frame. This knowledge is beneficial for traders who intend on taking up positions that may last up to a year. The very long-term time frame covers the overall historical perspective of the exchange rate for a specific currency pair; analysts use a compilation of monthly bars to observe and analyze the prices in this frame. Understanding the very long-term time frame can be beneficial to investors in the process of making international investments over a business cycle, involving some type of currency risk.

By using the MTFA to analyze the market, forex traders will know if currency pairs are trending, ranging or experiencing unstable trading cycles. Traders can also benefit from MTFA by learning if the behavior of the analyzed pair has good enough potential to consider a trade. By being aware of which parallel or inverse pairs in currency groups are also trending, it increases the odds of making accurate analyses and trade plans. When investors and forex traders invest time in using the MTFA method, they gain an advantage over others by having a glance at larger trends as well as a closer analysis of price actions. The overall impact is not only immediate but positive because they can also prepare trading plans, while learning and further understanding the behavior of currency pairs.


To learn more please visit www.clmforex.com

Disclaimer: Trading of foreign exchange contracts, contracts for difference, derivatives and other investment products which are leveraged, can carry a high level of risk. These products may not be suitable for all investors. It is possible to lose more than your initial investment. All funds committed should be risk capital. Past performance is not necessarily indicative of future results. A Product Disclosure Statement (PDS) is available from the company website.


What It Would Take for Me to Consider Buying Twitter

By George Leong, B.Comm.

If you chased and purchased Twitter, Inc. (NYSE/TWTR) at $50.09 on the first day of its initial public offering (IPO), you would already be looking at a paper loss of 15.5% after the company’s stock price fell to $42.32 on Friday morning. For those who chased the stock price of Twitter higher—it was the wrong move.

Twitter was initially priced at $17.00 to $20.00 and was raised when demand became euphoric. Even at $50.00, the company’s stock price was already nearly three times the initial lower range, which is astounding. (Read “2013 IPO Frenzy an Omen for the Stock Market?”)

But just like Facebook, Inc. (NASDAQ/FB), Twitter’s stock price could inevitably head much lower after all of the initial excitement fades and investors realize the company needs to make money.

I wouldn’t be a buyer now at the current stock price; I still wouldn’t be buying the company at $40.00. A decline in the stock price to the mid-$30.00 range may strike my interest, but again, I would likely want to wait until the company’s stock price fell to $30.00 or below before even considering the social media stock. At $20.00, I would seriously look at picking up some shares of Twitter. Some of you may not believe Twitter will sink that much, but just look at what happened to Facebook and Groupon, Inc. (NASDAQ/GRPN) following their strong debuts.

With social media stocks, it comes down to eyeballs—the more, the better. Facebook has about one billion users, so it is intriguing to investors. The company is working hard to monetize its user base via the use of mobile advertising, and it seems to be helping. Twitter must also do the same.

Making money from a service that allows users to send 140-character “tweets” (what I consider essentially a texting service to your followers) will not be easy.

I often tweet for my Daily Profits service, but I just can’t seem to get my head around how Twitter will report revenues, never mind make a profit. There is some advertising inserted among tweets, but I can tell you that I have never clicked on one. It’s going to be difficult for the company to figure out how to make money from its tweeting service.

At this point, unless the stock declines to $30.00 or below, I would not be buying; I would rather stick with Groupon or Facebook

Twitter trades at 46 times (X) its trailing revenues, which is way overvalued, considering Groupon trades at 2.62X and Facebook at 17X. Just this simple comparison should make you think long and hard before jumping in at the current high price.

Twitter is all about potential at this time. If the company can figure out how to make money, buyers will come. But until that happens, I would stay far, far away and enjoy the action from a distance.

This article What It Would Take for Me to Consider Buying Twitter is originally publish at Profitconfidential


Why the Blind Optimism Behind the Housing Recovery Won’t End Well

111113_PC_lombardiBy Michael Lombardi, MBA

The news headlines are saying the U.S. housing market is witnessing robust growth and flipping homes for profit is back.

While many are now saying there is growth in the U.S. housing market and that it will continue, I disagree with them, based on many different factors…all of which I want my readers to know about.

Yes, home prices have gone up, but that’s about it for positive developments. The housing market still suffers, and there are problems that need to be fixed before it sees a full-on recovery.

The delinquency rate on single-family residential mortgages in the U.S. remains staggeringly high. In the second quarter of this year, it was 9.41%. Yes, again; it has declined from its peak of 11.27% in the first quarter of 2010, but it’s still almost 140% higher than its historical average of 3.94%! (Source: Federal Reserve Bank of St. Louis web site, last accessed November 8, 2013.)

As I have been harping on about in these pages; institutional investors jumped into the U.S. housing market buying residential homes in bulk, and as a result, prices increased. But we didn’t see first-time home buyers run towards the housing market—an increase in first-time home buyers is essential for any economic recovery.

According to the National Association of Realtors, in September, first-time home buyers accounted for 28% of all existing home sales in the U.S. Meanwhile, investors were behind one-third of all existing home sales! (Source: National Association of Realtors, October 21, 2013.)

The “U.S. Economic and Housing Market Outlook” report issued in October by the Office of the Chief Economist at Freddie Mac said, “According to our forecast, the U.S. economy will add less than 1 million housing units in 2013, and around 1.5 million in 2014, significantly below normal levels.” (Source: “U.S. Economic and Housing Market Outlook,” Freddie Mac, October 2013.) In simple words, it suggests demand for new homes in the U.S. isn’t strong.

With all this, I believe homebuilder stocks face a precarious future ahead. Since May, when we heard the Federal Reserve was debating tapering its quantitative easing program, homebuilder stocks shed value—and I would not be surprised to see them fall further.

Don’t buy into this housing market rebound. It’s not real. It is fueled by investors. I’ve never seen a housing market recovery that wasn’t fueled by people who bought houses to live in them. Like the stock market, this will not end well.

Michael’s Personal Notes:

Consumer confidence in the U.S. economy is falling fast. This phenomenon will bring key stock indices lower. But sadly, no one is really talking about this. “Buy, buy, and buy even more” is the theme among stock advisors. Optimism is increasing, and so is stock market risk.

The Thomson Reuters/University of Michigan Consumer Sentiment Index, a measure of consumer confidence in the U.S. economy, has fallen to a level not seen since December of 2011. This gauge of consumer confidence fell to 72.0 in November from 73.2 in October. (Source: Reuters, November 8, 2013.)

With that said, please take a look at the chart below of consumer confidence as plotted with the University of Michigan Consumer Sentiment Index in red and the S&P 500 in green. Pay close attention to the circled areas.

Chart courtesy of www.StockCharts.com

Generally, the chart above shows consumer confidence and key stock indices have had a direct relationship since 2001. In fact, at times, consumer confidence acts as a leading indicator of where key stock indices will head.

But since the beginning of this year, this relationship has gone the wrong way! As consumer confidence fell, key stock indices continued to march to new record highs! Just add the divergence between consumer confidence and the key stock indices to my long list of why this stock market shouldn’t be going up.

Consumer confidence predicts where consumer spending will go. If consumers in the U.S. economy are pessimistic about their future, it is very likely they will pull back on their spending. As a result, companies sell less, produce less, and earn lower profits—which eventually results in lower stock prices.

Dear reader, my skepticism towards the key stock indices just grows and grows daily! The higher they go, the harder they will eventually fall.

The fundamentals that drive key stock indices higher are missing. Third-quarter earnings show the continuation of troubling trends—lower company revenues but higher profits. Financial engineering, mostly in the form of stock buyback programs, can only go on for so long. In fact, we are already starting to hear companies provide negative guidance about their fourth-quarter corporate earnings.

My conviction remains the same: key stock indices are running on nothing but freshly printed money provided by the Federal Reserve. This money is setting up the stock market for big disappointment.


Miner Hedging & Smart Buying Seen If Gold Falls to “Symbolic” $1000

London Gold Market Report
from Adrian Ash
BullionVault
Tues 12 Nov 08:55 EST

WHOLESALE GOLD bumped up to $1285 Tuesday lunchtime in London, reversing an overnight drop to fresh 3-week lows at $1277 as European stock markets slipped with government bond prices.

 “A slip through the six-month support line at $1270.16 will confirm our bearish outlook,” says Commerzbank’s Axel Rudolph.

 “We could potentially,” says French bank Natixis’ precious metals analyst Bernard Dahdah, “see gold prices reach levels of $850 to $1,000. But this is our very low-case scenario.”

 Gold prices that low could unleash a wave of forward selling by mining companies, says French investment bank BNP Paribas, with miners trying to lock in current prices for fear of further falls ahead.

 “Producers, the share prices of which have not been faring well of late,” BNP’s commodity team notes, “might initiate and/or accelerate hedging were we to approach the symbolic $1000 level, adding supply to the market and further downward pressure to prices.”

 Were gold to fall below that price, investment author and hedge-fund manager Jim Rogers told India’s ET Now TV last week, “I hope I’m smart enough to buy a lot more.”

 Explaining why he’s not buying gold right now, “It went up 12 years in a row, which is highly unusual for any asset,” says Rogers. “And of course, India’s doing its best to kill the gold market.”

 This month’s Diwali festival saw gold buying drop by more than one-third from 2012, according to retail dealers, thanks to the lack of supply caused by the Indian government’s anti-gold import rules.

 Even with gold falling a further 3% in the wholesale bullion markets for November so far, “There’s little sign yet of a boost in physical demand,” says one Asian dealing desk.

 “Gold is clearly lacking bullish conviction,” says another.

 “With equities performing well,” agrees Scotiabank’s latest Metals Matters monthly, “and with the global economy looking more stable, investment demand for gold may well remain subdued.

 “That could keep the lid on prices.”

 Confidence levels amongst UK private investors rose in October for the third month running, says a survey from retail stockbrokers Hargreaves Lansdown, reaching a nine-year high with 8 in 10 respondents saying the stock market will rise again in 2014.

 Market professionals have also “fallen into a state of relative complacency,” says bond-fund giant Pimco’s CEO Mohamed El-Erian, “comforted by the notion of a ‘central-bank put’.

 “The result is financial risk-taking that exceeds what would be warranted strictly by underlying fundamentals.”

 Contrasting with last week’s strong GDP and new jobs figures, the National Federation of Independent Businesses said Tuesday that its optimism index dropped 2.3 points to 91.6 last month, primarily due to the government shutdown.

 Gold for UK investors had earlier turned higher from its 3rd dip below £800 per ounce this year as the British Pound sank on news of much weaker than expected consumer price inflation.

 The news comes after strong GDP and other data raised expectations that the Bank of England could soon raise UK interest rates from their all-time low at 0.5%.

Adrian Ash

BullionVault

Gold price chart, no delay | Buy gold online


Adrian Ash is head of research at BullionVault, the secure, low-cost gold and silver market for private investors online, where you can fully allocated bullion already vaulted in your choice of London, New York, Singapore, Toronto or Zurich for just 0.5% commission.


(c) BullionVault 2013

Please Note: This article is to inform your thinking, not lead it. Only you can decide the best place for your money, and any decision you make will put your money at risk. Information or data included here may have already been overtaken by events – and must be verified elsewhere – should you choose to act on it.


Dollar Consolidating After a Last Week’s Rise

The EURUSD Trying to Develop An Upward Momentum

Yesterday the market activity was rather weak. The EURUSD was consolidating after a fall during the last week. During the day the pair was corrected, having increased above the 34th figure and tested resistance around 1.3415. During the Asian trading session the bears became active and the pair`s rate decreased to 1.3380. The pair’s prospects are quite negative and in the short term it may test the 33rd figure. If the bears are able to break through this level, then the euro may be corrected above towards 1.3475-1.3544, where a possibility to open short positions should be considered.

eurusd12.11.2013

The GBPUSD Drops to 1.5965

Yesterday the GBPUSD decreased to support around 1.5965 where it stayed during the whole day testing it. The pair’s fluctuations were limited by resistance around 1.5994. Today the bears have already managed to break below support and tested 1.5951. The inability to increase above 1.6118 and a fall to 1.5956 caused to worsening of the pair’s prospects. In the short term it may try to check support around the 59th figure the loss of which will mean a downtrend development. The pound needs to rise and be consolidated above 1.6118-1.6131 to improve its prospects.

gbpusd12.11.2013

The USDCHF May Decrease to 0.9100

The USDCHF has also entered into a phase of consolidation. The pair’s rate decreased to 0.9188, which was able to give it support. Today the dollar has returned to resistance around 0.9218 that still prevents it to rise above. Nevertheless, a preserved positive sentiment towards the dollar allows to predict a rise resumption and testing the current highs at the level of 0.9249. At the same time a decline towards the 91st figure should not be excluded, but it should be used to open long positions. Falling below puts into question the effectiveness of a buying strategy on declines.

usdchf12.11.2013

The USDJPY Approaching to 100.00

During the whole previous day the USDJPY was traded within a narrow range above the 99th figure. During the Asian trading session demand for the pair has preserved and it rose to 99.73. As growth occurred in the conditions of some liquidity, it is difficult to assess the ability of the dollar to break through the psychological level of 100.00. Nevertheless, the ability of the dollar to stay above the breached 99th figure is a positive factor for it, and it increases its chances of breaking through the 100th figure. Returning below the 99th figure will weaken the bullish momentum.

usdjpy12.11.2013


provided by IAFT


Indonesia raises rate 25 bps to cut inflation, C/A deficit

By CentralBankNews.info
    Indonesia’s central bank raised its benchmark BI rate by a further 25 basis points to 7.50 percent to rein in inflation and reduce the current account deficit.
    Bank Indonesia (BI) has now raised its policy rate five times this year by a total of 175 basis points. It also raised the lending rate to 7.50 percent and the deposit rate to 5.75 percent.
   “This policy was taken in light of the persistently large current account deficit amid widespread global uncertainty” to ensure that the current account deficit is reduced to what BI described as a more sound level and that inflation in 2014 returns to the bank’s target of around 4.5 percent, plus/minus one percentage point.
    Indonesia’s headline inflation rate eased to 8.32 percent in October from 8.4 percent in September, “reinforcing indications that monthly inflation is returning to normal,” the bank said, with core inflation stable at 4.73 percent on stable external markets and lower international food prices.
    BI’s rate increase comes after its senior deputy governor, Mirza Adityaswara, on Monday said that the central bank would stick to its tight bias due to continued high imports while it was comfortable with the exchange rate.

    The impact of the rupiah’s deprecation on inflation in October was relatively negligible, BI said.
    Based on lower inflationary pressures, the bank expects an average inflation rate in 2013 of slightly below 9.0 percent and for inflation to hit the bank’s target range in 2014. In 2012 Indonesia’s inflation rate was 4.3 percent.
    BI projected that Indonesia’s current account deficit would shrink to US$ 8.4 billion in the third quarter from $9.85 billion in the second quarter, with the surplus in the capital account eroded by evaporating inflows of foreign portfolio investment due to uncertainty in global financial markets. Nevertheless, foreign direct investment had surged.
    Indonesia’s foreign exchange reserves rose $1.3 billion to $97.0 billion in October, the equivalent of 5.3 months of imports and serving of external debt, a level the BI described as adequate.
     The central bank said it would continue to “monitor the global economy while uncertainty remains pervasive,” noting the shift in the international economic landscape as developing countries slow down and advanced economies start to strengthen along with an end to the cycle of high commodity prices that “could undermine efforts to recover the domestic economy.”
   “Bank Indonesia will monitor a number of risks in the global and domestic economies as well as optimize their monetary and macro prudential policy mix,” the bank said, adding it would continue to strengthen its policy coordination with the government to control inflation and the current account.
    The central bank said the global economy picked up during October on the back of positive sentiment in financial markets due to delayed discussions of the U.S. debt ceiling and the Federal Reserve’s delayed tapering of its asset purchases.
    Indonesia’s economy slowed, as expected, in the third quarter, with Gross Domestic Product expanding by an annual 5.62 percent, down from 5.81 percent in the previous quarter, due to weak construction investment and tepid non-construction investment.
    But the BI said this slowdown was linked to the government and the central bank’s efforts to “bring economic growth to a more balanced and sound level.”
    For the year, the BI still projects growth of 5.5-5.9 percent in 2013, rising to 5.8-6.2 percent in 2014. In 2012 the economy grew by 6.2 percent.
    The exchange rate of the rupiah was stable in October, falling by 0.14 percent during the month to an average rate of 11,343 to the U.S. dollar, helped by improved global financial markets, dampened demand for oil and gas imports, and lower inflation expectations that led to an influx of foreign capital to domestic financial instruments.
    “Bank Indonesia will continue to maintain rupiah exchange rate stability in line with fundamentals,” said the BI, which has seen the rupiah fall by 16 percent this year against the U.S. dollar as global investors have withdrawn some funds in anticipation of stronger growth in advanced economies.

    www.CentralBankNews.info

Three Reasons the “Smart Money” Looks Pretty Dumb

By WallStreetDaily.com

As everyday investors, we often get belittled for being the “dumb money” in the market.

We’re unsophisticated and always late to the opportunity. Therefore, we’re destined to underperform.

Given such dismal proclivities, what are we supposed to do – give up? Of course not!

The “smart money” counts on us to willingly (and stupidly) keep parting ways with our capital in the market.

All the while, we’re supposed to envy their super-sophisticated strategies they employ as venture capitalists, hedge fund managers and private equity firms.

Admit it, at some point you’ve dreamt that you made a quick fortune and were suddenly qualified to invest alongside these so-called market mavens.

But did you ever think to ask if the smart money actually, well… makes any money?

You should. Because a quick look at the scoreboard reveals that there’s absolutely no reason for you to envy them in any way…

Who Wants to Be a Venture Capitalist? Not Me!

In the wake of Twitter’s (TWTR) IPO, articles abound promising to enlighten investors on how to find the next great venture capital company.

Ignore them all.

As I revealed earlier in the year, the venture capital (VC) model is mortally wounded. Just ask insiders…

After analyzing its 20-year history of VC investing, the Ewing Marion Kauffman Foundation found that its returns “haven’t significantly outperformed the public market since the late 1990s. [And] since 1997, less cash has been returned to investors than has been invested in VC.”

Or, more specifically, after accounting for fees, the majority of its funds (62 out of 100) failed to outperform investing in the stock market.

A simple exchange-traded fund like the SPDR S&P 500 Fund (SPY) would have performed nearly as well (if not just as well) – all without the hassle, long holding period and expense.

Privacy is Overrated

Lest you think the venture capital failure is an exception to the “smart money” norm, consider the latest research on private equity (PE) funds…

Professors at Columbia University, Shanghai University and the Columbia Business School just published a working paper in the National Bureau of Economic Research. It’s not going to win them any fans on Wall Street, though…

According to the report, “Conventional interpretations of PE performance measures appear optimistic.”

(You mean Wall Street’s elite played up their ability to make money? Who knew!?)

The academics go on to conclude (emphasis mine), “On average, LPs may just break even, net of management fees, carry, risk and costs of illiquidity.” (In case you don’t know, “LP” stands for “limited partner,” which is Wall Street jargon for the high-net-worth investors who get to invest in PE funds.)

I’m sorry, but they don’t look too smart when they just “break even” on their investments.

As Barron’s Brendan Conway notes, everyday investors can easily outperform illiquid PE funds by simply purchasing shares of publicly traded companies with PE exposure – like Blackstone Group (BX) and Fortress Investments Group (FIG).

For instance, Blackstone rose an average of 31.9% per year over the last five years, compared to a 16.3% average annual return for the S&P 500.

Too Much Hedging Going On

Billionaires Jim Rogers and George Soros are the poster boys for the hedge fund movement.

They started the Quantum Fund way back in 1973 and delivered 4,200% returns over the next decade. Ever since then, trillions in investment dollars have been chasing the same dream.

Fast forward to today, and hedge funds now control a record $2.51 trillion in assets, according to industry tracker, Hedge Fund Research.

Yet their performance isn’t breaking records…

For the first nine months of 2013, the average hedge fund – represented by The HFRI Fund Weighted Composite Index – is up only 5.5%. That compares to a roughly 20% rise for the S&P 500 Index over the same period.

This isn’t a short-term hiccup, either.

If we evaluate the performance over the last decade, the average hedge fund returned 5.92% per year, compared to an average annual return of 7.57% for the S&P 500.

Once again, a simple, low-cost, “dumb” investment in the SPDR S&P 500 Fund would have performed better.

Bottom line: Warren Buffett was on to something in his 1993 letter to shareholders when he wrote, “By periodically investing in an index fund… the know-nothing investor can actually outperform most investment professionals. Paradoxically, when ‘dumb’ money acknowledges its limitations, it ceases to be dumb.”

So whenever you find yourself coveting the investment prowess of the smart money, just remember that they can be just as clueless – if not more so – than the average investor.

Ahead of the tape,

Louis Basenese


The post Three Reasons the “Smart Money” Looks Pretty Dumb appeared first on Wall Street Daily.
Article By WallStreetDaily.com

Original Article: Three Reasons the “Smart Money” Looks Pretty Dumb