Japanese Candlesticks Analysis 19.11.2013 (EUR/USD, USD/JPY)

Article By RoboForex.com

Analysis for November 19th, 2013

EUR/USD

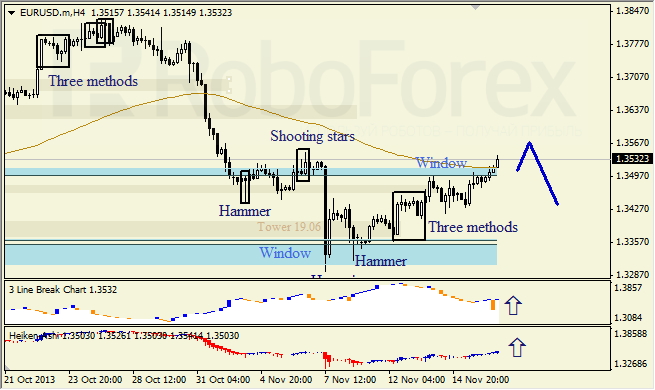
H4 chart of the EUR/USD currency pair shows that correction continues. Upper Window is broken; it may become support level. Three Line Break chart and Heiken Ashi candlesticks confirm ascending movement.

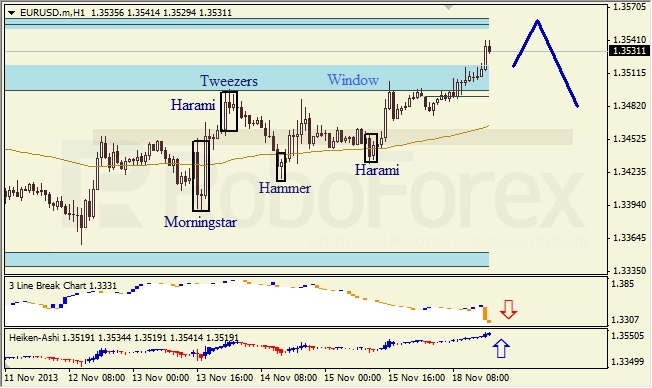
H1 chart of the EUR/USD currency pair shows resistance from upper Window. Three Line Break chart indicates that price may rebound from Window; Heiken Ashi candlesticks confirm that ascending tendency continues.

USD/JPY

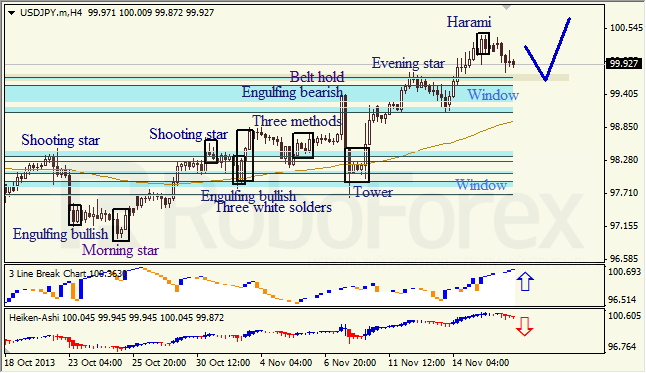
H4 chart of the USD/JPY currency pair shows correction within ascending trend. Closest Window is broken, now it’s support level. Three Line Break chart indicates ascending trend; Harami pattern and Heiken Ashi candlesticks confirm that correction may continue.

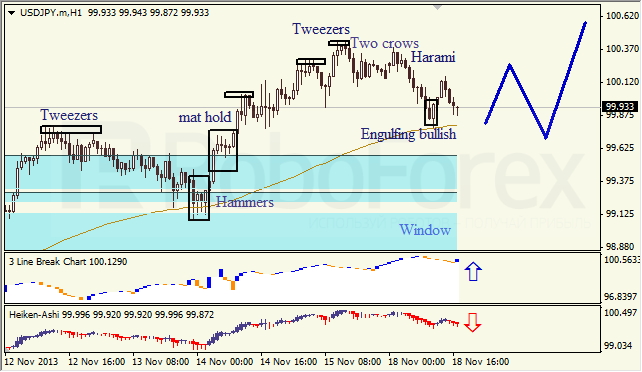
H1 chart of the USD/JPY currency pair also shows bearish tendency within ascending trend. Closest Window is support level. Engulfing Bullish pattern and Three Line Break chart indicate ascending movement; Heiken Ashi candlesticks confirm descending movement.

RoboForex Analytical Department

Attention!
Forecasts presented in this section only reflect the author’s private opinion and should not be considered as guidance for trading. RoboForex LP bears no responsibility for trading results based on trading recommendations described in these analytical reviews.

Article By RoboForex.com


Why Do Aussie Investors Still Hate Resource Stocks?

By MoneyMorning.com.au

For all the talk in the mainstream you’d think the Australian resource sector was dead.

It’s a mighty struggle for any resource firm to raise capital.

And to look at the performance of Australian resource stocks, well, it’s hard to find any sector that investors hate more.

We won’t say investors are giving their shares away, but on some days, it sure as heck seems like it.

And yet despite the negativity, resources are still by far Australia’s biggest export. So what gives?

You can see the breakdown of Aussie exports for yourself in this chart:

Source: Department of Foreign Affairs and Trade
Click to enlarge

Raw materials (such as gold, iron ore and oil) make up 55.7% of Aussie exports. Add in rural exports such as cattle and grains, and that’s another 10.8%. In other words, two-thirds of Australian exports come from the land or what’s under the land.

You’d think that would be something to cheer about. You’d think investors would use this resource dominance to their advantage. But right now it seems most Aussie investors would rather poke a finger in their own eye than buy resource stocks.

Success Despite Government Meddling

Look, from a macroeconomic point of view we get it. For the past five years we’ve argued that the government needs to cut red tape and minimum wage laws so other sectors of the economy can be more competitive.

Because mark our words, it’s not that Aussies are dumb. It’s not as though they don’t have an entrepreneurial flair. It’s just that government red tape handicaps Aussie firms when they try to compete in the global market.

And although successive governments have tried to handicap the resources sector as well (resource super tax), those firms digging and drilling for resources have mostly coped with the government meddling.

Why is that?

Well, it’s not that mining folk are smarter than biotech, technology, or manufacturing folk.

The simple reason is that if overseas firms want certain resources they have to go to whoever has the resources.

In many cases the choices are limited. Take iron ore. Right now there are three major global iron ore players – BHP Billiton [ASX: BHP], Rio Tinto [ASX: RIO], and Vale SA [BVMF: VALE5]. You can also add Fortescue Metals [ASX: FMG] into that oligopoly mix.

There are others, but not with the same kind of scale and market dominance as this crowd. That means when China wants to fill up on iron ore in order to make a bunch of steel to build gleaming new cities, it almost always has to deal with one of these four firms.

So in a way, the Aussie resources sector has flourished in spite of government interference. And if our bet is right, based on the market dynamics and Australia’s prime position, Aussie resource firms will continue to dominate the global market.

Investing in Resource Stocks is a Must for Aussie Investors

That’s why it’s so important that Aussie investors have at least some exposure to resource stocks.

That doesn’t mean putting every last penny into speculative and high-risk explorers. It just means making the most of and taking advantage of your box seat position.

We think about it this way: for Aussie investors not to own resource stocks is like an American investor not owning technology stocks, or a Saudi Arabian investor not owning oil stocks.

It’s just not natural.

And besides, there’s another reason why Aussies should invest in local resource shares

Unlike most first-world financial markets where nearly all the stocks – even the tiddlers – have a broking firm or research house covering the stock, the Australian market is still woefully under-researched.

Obviously we’re trying our best to do something about that. But there are only so many stocks we can reasonably follow. That means more than three-quarters of ASX-listed stocks go completely uncovered.

While the tendency is to think such poor analyst coverage is bad news, the reality is the opposite. Here’s why…

Your Best Chance for a Ground Floor Opportunity

When there are a number of analysts following a stock, it’s hard to gain what we call a ‘knowledge advantage’ over those other analysts. They’ve all got pretty much the same access to the same data. And odds are they’re running the same analytical models over the companies.

That means their conclusions are broadly similar. They come to a consensus view.

But when there’s only one analyst, or no analysts following a company, well, that’s a different kettle of fish. It means few others are looking at the stock. And if that’s the case it means you have the real potential to get in on a ground floor opportunity.

That’s not possible with most other markets.

Of course, you won’t strike it lucky with every stock you find. Some stocks are trading for tenths of a cent for a reason – they’re just plain rubbish. But other tiddlers are true hidden gems.

If you can find them before the rest of the market cottons on, then you’re in with a chance of hitting the jackpot.

That’s your advantage as an Aussie investor. And what’s more, with resource stock prices still in the basement, there has rarely been a better time since early 2009 to selectively punt on Aussie resource stocks.

It’s time to do it, because if you don’t, the rest of the investing world will soon catch on and resource stock prices won’t stay this low forever.

Cheers,
Kris+

Special Report: The ‘Wonder Weld’ That Could Triple Your Money


By MoneyMorning.com.au

The Clock is Ticking on America’s Booming Oil Patch

By MoneyMorning.com.au

We’re living through a stupendous, technology-driven energy boom.

In oil and natural gas fields across the land, one can see capital investment by the mile – across the surface of the land and road grid and drill rigs and pump systems that go deep into the bowels of the earth.

Looking back over 150 years in the US since the dawn of the Oil Age at Titusville in 1859, no generation has EVER seen as much volume of ‘new’ oil and gas come out of the ground as we’ve witnessed in the past couple of years…

Last year, the US enjoyed its largest increase in oil production in the country’s history. The exact number is that the US grew its overall oil output by more than 800,000 barrels per day. The latest annual BP statistical review puts it at roughly 1,000,000, which would be a 14% increase to 8.9 million barrels per day. Either way, it’s big.

And that 800,000 barrel increase is net, too. It’s over and above depletion of older oil wells and oil fields. In essence, the US oil patch added much more from new, productive wells than it lost from old, depleting ones. So output-wise, it has NEVER been this good! We’re living through energy history.

What Can Go Wrong?

It’s good, no doubt. But can anything go south on us? The oil numbers are so good that I feel like I ought to worry that something bad might happen. It’s worth asking what the risks are. Let’s take a look. But first, let me digress.

Yes, we’re living through historic times for energy. But history doesn’t just happen. It gets invented. What does that mean?

Thank a vast array of technology for bringing this ‘new’ oil and gas to the surface. Collectively, we benefit from new exploration and geophysics, based on better sensors, signal processing and computer power. We benefit from better drilling techniques, better drill bits, pipe, drilling fluids and well monitoring. We benefit from directional drilling and all manner of tech related to fracking. All that and more.

Keep a historical context. This new energy revolution happened when it happened. It could not have played out even a few years ago with tech of that era’s vintage. We needed all sorts of new developments in math, physics, chemistry, metallurgy, computing and much more.

I should add that the fracking boom in the US is also a product of legal culture, particularly individual ownership of mineral rights. This encourages leasing and drilling.

In many other locales around the world, governments want to promote development, and especially repeat US success in fracking. For example, there are large areas of Russia, China, the Middle East and Argentina that look promising in terms of geology and shale deposits, etc.

But ‘just’ good geology is not enough. Outside the US, most other nations lack the legal environment – let alone the oil service industry and equipment – to make fracking for shale oil and gas worth the cost.

Consider this metric. In 2012 in the US and Canada, the energy industry drilled over 6,000 wells for unconventional oil. Outside North America, fewer than 100 unconventional wells poked the earth in 2012. So the rest of the world has much catching up to do.

What Does IEA Say?

Now along comes the Paris-based International Energy Agency (IEA) with a new report called World Energy Outlook 2013. In the new report, IEA predicts that the shale gale in the US – and perhaps across the world, in years to come – will provide only a temporary relief from global reliance on oil from the Middle East.

In and of itself, it’s no stretch to say that mankind will have to find something else to do besides burn carbon. It’s not exactly a revelation when you think out a century or so. But the IEA report tosses a monkey wrench into the deal with its time frames. Things could get worse faster than we might think. We’ll see, eventually.

The good news from IEA is that the short and medium terms are promising. In fact, in 2012, IEA forecast that the US will overtake Saudi Arabia as the world’s largest oil producer by 2017, based on extensive use of new tech like fracking. Now this year, in 2013, IEA is advancing its prediction ahead. According to IEA, the US will overtake Saudi Arabia as the world’s largest oil producer of oil by 2015.

So far, so good. But IEA also predicts that US oil output will peak at about 12 million barrels a day by 2025 – a dozen years from now – and then start a long, slow decline.

According to IEA, ‘By the mid-2020s, non-OPEC production starts to fall back and countries from the Middle East provide most of the increase in global supply.

The IEA report allows for how high market prices for oil will stimulate drilling for light, tight oil. Actually, the energy industry requires relatively high oil prices because many tight oil plays have a cost structure north of $50 per barrel at the wellhead, before taxes, royalties, transport and refining.

But per IEA, over time, that tight oil resource is finite. It’s just a question of when the best sites will be drilled, which many critics have already pointed out. Yes, for example, plays like the Bakken and Eagle Ford are prolific now. But it’s not uncommon for the drilling patterns to encounter the limits of ‘sweet spots’ on the maps.

Eventually, Western and/or non-OPEC shale plays will reach a plateau balanced between new drilling and long-term depletion. Plus, at the end of the day, the world’s largest array of low-cost suppliers is in the Middle East.

According to a senior rep at IEA, ‘We expect the Middle East will come back and be a very important producer and exporter of oil, just because there are huge resources of low-cost light oil.‘ It gets back to the geological fact that light, tight oil is not necessarily low-cost oil.

The IEA report is filled with all manner of assumptions that might or might not be valid. There’s much that no one knows, particularly about fracking and the size and scope of the shale resources of the world. There’s nothing easy about this kind of forecasting at all! The better route is to draw up alternative scenarios, a type of managerial tool developed by Shell Oil over many years.

One IEA limitation, for example, is that the authors of the new report were extremely conservative about ‘inventing’ new tech that has not yet come on line, let alone been drawn up, produced or tested. So looking out to 2035, IEA does not anticipate major breakthroughs.

Yes, IEA factors in continued cost reductions in terms of efficiencies, as well as growth of other sources of energy like renewable systems. But no new tech, which might lead to other game-changing ways to pull hydrocarbon molecules out and burn them wisely.

Also per IEA, future global economic growth will spur demand for all manner of energy sources, and oil and gas will remain key in meeting global demands. So as supply crimps down, demand and pricing will go up. That could cause all sorts of other feedback items.

Another angle on energy from the IEA report is that the world will continue to have significant regional differences in energy prices. These differences will have major impact on industrial competitiveness. This will cause investment decisions that will be highly disruptive to communities, regions and even national governments.

The bottom line is that IEA anticipates that the energy industry will continue to drill for light, tight oil in the US. The US will continue to play a major role in meeting global oil demand growth over the next decade. But by the mid-2020s, US output will plateau, and we’ll be looking back at the Middle East as a large source of (relatively) low-cost oil.

If you’ve followed these pages for more than few months, then you doubtless know how highly I think of the oil service plays like Schlumberger (SLB), Baker Hughes (BHI) and Halliburton (HAL: NYSE). These guys have many great, profitable years ahead of them. IEA or no, in my view, there’s much more to come from the shale gale, both at home and abroad.

Looking ahead for this decade and well into the 2020s, we’ll see more drilling, more wells, more downhole investment, more technology and more energy production from wells that corkscrew through the shale and tight limes and sands.

I respect the work of the IEA. We’ll see how it all plays out, should we live long enough. Meanwhile, I firmly believe that we have many years of good energy investing ahead.

Thanks for reading.

Best wishes…

Byron W. King
Contributing Editor, Money Morning

Join Money Morning on Google+


By MoneyMorning.com.au

Silver, Gold & Miners About To Sell Off Again

By Chris Vermeulen, GoldAndOilGuy.com

Silver, Gold & Miners About To Sell Off Again

A couple weeks ago I posted these same charts talking about the pending breakout (in either direction) with silver, gold and mining stocks. Fast forwarding to this week its clear this sector continues its struggle to rally. Key support levels are now being tested and if these levels fail prepare for a sharp correction with mining stocks showing the most downside potential of roughly 25% for the GDX ETF trading fund.

Let’s take a quick look at what is going on.

Gold Trading Chart:

The chart of gold shows price being wedge into the apex of the down sloping resistance trend line and the rising support trendline. Gold was trading below this level but has since bounced. But if gold closes the week below this line in the sand the price could start to fall quickly and test the $1200 per ounce within a week or two.

gold18


Silver Trading Chart:

Silver is under performing gold and trading below its support level currently. If silver does not recover by Friday’s closing bell then things could get ugly for a few weeks as investors start to exit their positions. That being said, I need to point out that silver is more of a wild card when using trend lines like this. Both gold and gold miners should be confirming this breakdown in silver if it is the real deal.

silver18


Gold Mining Stocks ETF:

The chart of gold miners I like the most. I like it because it’s pointing to lower prices, roughly 25% lower if the breakdown takes place. Gold mining stocks could be a fantastic long term investment if we see the $17.50 level reached on this GDX etf.

gdx18


Last week I talked about ETF trading strategies and the big picture on gold, silver, miners and bonds. They look to be nearing a major bottom and once they do bottom it should be a great buying opportunity for specific stocks or the entire sector.

The next few weeks are going to be crucial for precious metals and we will keep an eye on them as this bottom unfolds. Get more reports like this here: www.GoldAndOilGuy.com

Chris Vermeulen


Could Bad Data Be Depressing the Gold Price? Eric Sprott Says GFMS Stats Are Flawed

Source: JT Long of The Gold Report (11/18/13)

http://www.theaureport.com/pub/na/could-bad-data-be-depressing-the-gold-price-eric-sprott-says-gfms-stats-are-flawed

Demand for gold bars, coins and jewelry increased to multiyear highs in the first half of 2013, but was offset by outflows from exchange-traded funds, according to the World Gold Council, which produces a quarterly Gold Demand Trends Report and recently released the first-ever Direct Economic Impact of Gold Report. Sprott Securities founder Eric Sprott questioned those statistics in a call-out on his website. He figures that the demand for gold is actually 3,000 tons more than the annual supply, and therefore the gold price will soon be much higher. What is the true demand for gold? How much is really available in any given year? Does supply and demand really determine the price of gold anymore? The Gold Report called Sprott and John Gravelle, global and Canadian mining leader for PwC, which produced the report for the World Gold Council, to find out.

The Gold Report: Eric, you published an Open Letter to the World Gold Council saying that the massive imbalance between supply and demand is not reflected in prices because available statistics are misleading, and that is the most important obstacle to a healthy gold mining industry. Why has it been so difficult to get accurate statistics and what should be measured to get a better picture of demand, particularly in emerging markets?

Eric Sprott: I have always had a dispute with the data that Thomson Reuters GFMS Gold Survey puts out, which the World Gold Council uses as the basis for its analysis of gold. Since I’ve been involved in the gold market, the supply always magically equals the demand. Of course, we know that’s almost impossible.

The report has two what I call fudge numbers. One is recycling, which is a very big item. The report suggests it could be upward of something like 1,600 tons some years. I don’t know how it would possibly come up with that number. I find it very difficult to get numbers on recycling in any country, let alone all countries.

Two, the report always uses what it calls a net investment demand or supply. It’s the plug number to make supply equal demand. Many times I think that the investment number is understated.

Furthermore, as I wrote in “Do the Central Banks Have Any Gold Left?,” we have seen a net increase in gold demand over the decade of at least 2,000 tons per year (2,000 tpa). China’s demand alone is going up 100%; jewelry demand is up 50%. Mine supply has essentially been flat at 2,700 tpa, or 2,100 tpa for Western consumption because China and Russia don’t export the gold they produce. As we move into 2013, we start to see significantly higher imports of gold into the Asian countries. That makes the shortages even more extreme. We could see demand of 5,100 tpa. That would result in a 3,000 tpa shortfall, not a balance. How can all these people be buying all this gold per year when the supply hasn’t gone up? That is why I question the GFMS data. I think it is flawed.

TGR: You published a chart with your calculations of actual supply and demand (below). What statistics should investors use to understand what is being imported versus what is being mined in China and Russia?

ES: The Chinese announce their monthly gold production, so we know how much gold is produced; we just don’t get export and import data. The only data we get is that Hong Kong exports well over 1,000 tons into China. That makes it highly unlikely that China would be exporting at the same time it is importing. It’s hard to imagine that somebody isn’t supplying that market. In my mind, that someone is central banks.

I think Western central banks lease gold into the market to keep the price down. We can’t tell what they lease, because on their own balance sheets they have one line called gold and gold receivables. Of course, gold receivables is the least they put out, so they can pretend they own it. But, in fact, the gold is gone. We get no transparency whatsoever as to what part of that line is real metal and what part of it is leased gold.

Central banks think they should be totally nontransparent. As you may be aware, there has been no audit of the gold held by the U.S. Department of the Treasury since 1954. There are no physical data supplied by any central banks as to what their current positions are.

Earlier this year, Germany requested the 330 tons that it had leased to the U.S. Department of the Treasury be redelivered to Germany. At first the U.S. declined to deliver, and then it agreed to deliver the gold over seven years. There is no logistical problem with delivering gold. So why is it that when a country says it wants its gold back, which would represent approximately 4% of all the gold theoretically the U.S. has, that it takes seven years to deliver it? It begs the question.

TGR: Could the selloff of the EFTs noted in the report make up some of the supply shortfall?

ES: The ETF was raided in H1/13, and I think the World Gold Council should wonder why. I believe it is because there was no gold. The plan was to slam the gold price down, get everyone to liquidate their SPDR Gold Shares ETF (GLD:NYSE) shares, then buy the shares, redeem them for gold and deliver the gold out to the counterparties that are demanding it. The whole thing was a setup because of the shortage of gold.

TGR: Have the statistics this year been more off, according to your calculations, than in previous years? Or is this a continuation of a trend?

ES: No. They’ve been radically different this year in the sense that we now see this huge increase in imports, 471 tons into Hong Kong. This is a 4,000-ton market, so 471 tons is 12% of the market. Hong Kong in total has exported about 900 tons into China in the first eight months of the year. These are gargantuan shifts. Let’s just take the month of August, when Hong Kong imported 299 tons. The free world mines 175 tons per month. That means it bought not quite twice the value of all the gold mined in the month. Where did it come from? Who supplied the gold? That is what I want to know.

TGR: How is what is happening today different than the controversy Frank Veneroso outlined in “The 1998 Gold Book Annual” in 1998?

ES: It’s the same thing. Frank Veneroso wrote a tremendous book in 1998 suggesting that, instead of having 36,000 tons of gold, the central banks really only owned about 18,000 tons, and that they had been supplying gold to the market. What I’ve done in the meantime is identify that it looks as if there’s another 2,000 tpa that have come out of the central banks somehow. Therefore, I throw out this question: Is there any gold left?

I suspect that the raid on gold that happened in H1/13 was created by central banks because there probably was no gold left, and they thought by bashing the price of gold down that everyone would sell it. In one respect, it worked. Many who owned the SPDR Gold Trust, the paper gold, sold it. But it started huge buying in the East, in India and China in particular. There were months when India and China were probably consuming 300 tons/month, and we only mine 175 tons/month. So the central banks won one battle to get the gold out of the ETF, but they lost the other battle by igniting this buying interest with low gold prices. At $1,200/ounce ($1,200/oz) gold, you can buy 50% more gold than when it’s $1,800/oz for the same amount of dollars. There could be a lot of appetite here.

TGR: If there really is 3,000 tons core annualized demand above supply, what does that mean for what the price of gold will be going forward?

ES: Well, it will be astronomic, because things get out of control. When people finally realize that there’s a shortage of gold, the price starts to go up. The most incredible thing to me is that because of all the misinformation out there, China can buy an extra 25% of the gold market over the last two years, and the price goes down. Do you think that could happen in any market like oil, corn, wool or anything? It goes against the rules of supply and demand.

TGR: What should the price of gold be?

ES: It should be substantially higher.

TGR: We’ve been talking about gold. Is there a similar situation going on in silver? Is silver a more transparent market?

ES: No, it’s not. In fact, it’s probably less transparent because it’s even harder to get data on silver. Who knows how much is used in industry? I have no idea. But in the current year, India looks as if it will go from buying 2,000 tons silver to 6,000 tons silver. Silver is about a 25,000-ton market. So we have a situation where India has stepped into the market and bought 16% of the market out of nowhere, and the price has gone down. Again, that doesn’t seem logical to me.

One of the reasons Indians are buying more silver is because they’ve been restricted from buying gold. If the Indians had to buy as much silver as they normally buy of gold, in the last six months of this year, they’d have to buy two years of silver supply to equate to the gold they normally would buy in the last six months.

TGR: For our investor readers, this can all be very confusing. What should they take away from the debate about the actual supply and demand for gold and silver?

ES: Most markets are manipulated. I think we know that. The bond market is manipulated by the Federal Reserve. We’re finding out that the forex market is being manipulated, as is the swaps market. Certainly, the energy markets have proven to be manipulated. Platinum, palladium. The high-grade bond market was manipulated. There are a lot of things that get manipulated.

Therefore, it is important to understand who is trying to set the price. The cash markets trade about 80% of annual production every day. There is no physical metal behind those trades; it would be impossible to constantly move that amount of metal. It is all paper. But the paper market determines the price of physical gold, not the other way around. And I would argue that the physical market says the price should be up, while the paper market knocks it down.

TGR: Can this continue indefinitely? Eventually, won’t it become apparent and people will trade based on the actual price based on supply and demand?

ES: No, it can’t go on forever because some people do demand delivery of gold. That’s why I look at the delivery side. COMEX inventories have fallen from 11 million ounces (11 Moz) to 7 Moz. Most of the dealer gold that’s owned on the COMEX has already been nominated for. So there’s really no gold held by the dealers anymore. I think the physical market will win out.

We have also seen what’s called the gold forward offered (GOFO) rate. It is negative today, which means there is a tightness in the gold market. That’s only happened five times. It happened in June of this year. It happened in October 2008 after gold had a big decline. It happened in 2001 at the bottom of gold, and it happened in 1998, when we had the World Gold Agreement, and all of a sudden the price of gold shot up. Every time it has happened, gold has been followed by a very large rally.

TGR: Thank you for your time.

At this point The Gold Report called John Gravelle, global mining leader for PwC, to ask where the numbers in the WGC report came from and what the supply-demand picture really says about what the price of gold should be. He wasn’t able to clarify the source of the recycling numbers or the numbers used in the Thompson Reuters GFMS statistics by press time, but he did break down the sources of the supply.

TGR: The World Gold Council report outlining the supply and demand picture for gold was published last month. What were the major trends?

John Gravelle: It was a snapshot of the situation in 2012. As we continue doing this, we will be able to see more trends develop.

TGR: The report showed that gold production increased by 50% from 2007 to 2012, spurred by a doubling in the gold price, and that China is the largest producer, with 14.4% of gold production, followed by Australia, the U.S. and Russia. In fact, Mexico’s production grew by 118%. What are the factors behind those changes? Can that continue?

JG: Mexico certainly had a good run. The government has introduced a number of business reforms that are seen, with one exception, as being positive. The one exception is the mining reform, which includes a 7½% royalty that has been proposed. That will cause people to take a second look at their investments in Mexico. It could have a dramatic impact on the rate of return compared to other gold-producing countries. Mexico has a lot of positives, and gold production has gone up as a result. But the industry is in a tough spot. Costs are going up; shareholders are reluctant to provide financing for significant new capital projects. It will be interesting to see what happens to Mexico over the next three years as a result of some of these changes.

TGR: What about China? According to the report, it mined 413 tons in 2012, or 14.5% of world production.

JG: China has become the biggest gold producer. It’s also the biggest gold-consuming nation. China has continued to mine gold. We’ve seen some countries fall off, such as South Africa, which historically has been one of the main players. South Africa certainly has its challenges. A lot of investors have been scared away from there. China continues to produce because it has the demand. Even with the record production, the country is still a significant net importer of gold. It will continue to be a big producer and consumer of gold.

TGR: And Australia? It has also had some controversy around natural resource taxation.

JG: I always thought of Australia as being an iron and coal country and never focused on it as a major gold-producing country, but in fact it produced 250 tons in 2012. It has a new government now and the mining tax proposed three years ago was eventually scaled back, so it doesn’t apply to the gold industry, only coal and the iron ore. Also, Australia’s new government looks like it wants to create a more favorable environment for investment. However, Australia is still a high-cost place for gold miners. Gold miners must compete for scarce skilled labor against all the much bigger iron ore and coal miners. Water is also an issue. Australia is a historic mining jurisdiction, but it has its challenges.

TGR: When I talk to people about mining in the United States, it’s not all one thing. Depending on the state, the country risk can be very different.

JG: It does vary by state. Nevada is a key one for the gold miners. But together, the United States delivered 231 tons in 2012.

TGR: Russia, at 230 tons, is also a net consumer of gold.

JG: Some Canadian companies have done an excellent job of navigating the environment there and being successful investing there, but the government has been inconsistent toward mining and most foreign investors are a little worried about what the government may do, for example, with their licenses. It’s always been a higher-risk jurisdiction.

TGR: Overall, do you see that the price of gold fluctuates based on actual supply and demand factors or just macroeconomic headlines that might indicate a change in demand factors in the future, for instance if people lost confidence in the dollar and bought gold as a store of value?

JG: Speculation as to whether the U.S. Fed will continue to taper can have an impact. because if the money supply increases that’s positive for gold. We do see people buying based on what governments are doing.

The other factor that is interesting about gold is current-year demand is simply current-year demand. Full stop. Current-year supply, however, is not simply just the gold that was produced in that year, because unlike other commodities, gold isn’t consumed; sometimes gold produced in prior years comes on to the market. For example, if sentiment toward holding gold decreases, ETFs that hold physical gold can get flooded with redemption requests, so they need to sell their physical gold, thereby decreasing the price of gold. Demand can go up and down a bit based on the price of gold, but often the factors are external. I think going forward we are looking at a favorable market for gold.

Current-year demand is very high compared to current-year supply coming from current-year production. China will continue to be a net importer. Those economies are getting richer and they’re growing a lot faster than the rest of the world. As those countries grow there’s going to be more demand for gold. The gold producers have had a very difficult time getting more production operational in this funding climate. If we don’t have prior year supply coming on to the market, I think it’s a positive supply/demand story for gold.

TGR: Thank you for your time.

Eric Sprott has more than 40 years of experience in the investment industry. In 1981, he founded Sprott Securities (now called Cormark Securities Inc.), which today is one of Canada’s largest independently owned securities firms. After establishing Sprott Asset Management Inc. in December 2001 as a separate entity, Sprott divested his entire ownership of Sprott Securities to its employees. Sprott’s predictions on the state of the North American financial markets have been captured throughout the last several years in an investment strategy article that he authors titled “Markets At A Glance.” Sprott has been widely recognized for his strategic insights and his accurate market predictions over the years. His newest ventures are Sprott Money Ltd., one of Canada’s largest owners of gold and silver bullion, and the recently launched Sprott Physical Platinum and Palladium Trust.

John Gravelle is the global and Canadian mining leader for PwC, based in Toronto. Gravelle assists several large mining companies with operations in the Americas address their business issues. He is also a tax services partner and provides tax advice to numerous large- and medium-size producers as well as junior exploration companies.

Want to read more Gold Report interviews like this? Sign up for our free e-newsletter, and you’ll learn when new articles have been published. To see a list of recent interviews with industry analysts and commentators, visit our Streetwise Interviews page.

1) JT Long conducted this interview for The Gold Report and provides services to The Gold Report as an employee.

2) Streetwise Reports does not accept stock in exchange for its services or as sponsorship payment.

3) Eric Sprott: I was not paid by Streetwise Reports for participating in this interview. Comments and opinions expressed are my own comments and opinions. I had the opportunity to review the interview for accuracy as of the date of the interview and am responsible for the content of the interview.

4) Interviews are edited for clarity. Streetwise Reports does not make editorial comments or change experts’ statements without their consent.

5) The interview does not constitute investment advice. Each reader is encouraged to consult with his or her individual financial professional and any action a reader takes as a result of information presented here is his or her own responsibility. By opening this page, each reader accepts and agrees to Streetwise Reports’ terms of use and full legal disclaimer.

6) From time to time, Streetwise Reports LLC and its directors, officers, employees or members of their families, as well as persons interviewed for articles and interviews on the site, may have a long or short position in securities mentioned and may make purchases and/or sales of those securities in the open market or otherwise.

Streetwise – The Gold Report is Copyright © 2013 by Streetwise Reports LLC. All rights are reserved. Streetwise Reports LLC hereby grants an unrestricted license to use or disseminate this copyrighted material (i) only in whole (and always including this disclaimer), but (ii) never in part.

Streetwise Reports LLC does not guarantee the accuracy or thoroughness of the information reported.

Streetwise Reports LLC receives a fee from companies that are listed on the home page in the In This Issue section. Their sponsor pages may be considered advertising for the purposes of 18 U.S.C. 1734.

Participating companies provide the logos used in The Gold Report. These logos are trademarks and are the property of the individual companies.

101 Second St., Suite 110

Petaluma, CA 94952

Tel.: (707) 981-8999

Fax: (707) 981-8998

Email: [email protected]


What to look for in the Economic Calendar this Week

Article by Investazor.com

Even though the beginning of the week was pretty calm, next days we might encounter a rise in the volatility for the Forex market because of the economic releases. At this point the markets are quite stable. The US dollar is week after the speech of Janet Yellen and the Euro is not that powerful because of the latest rate cut.

Let us take a look over the most important economic publishes of this week:

Currency

Forecast

Previous

AUD

CB Leading Index m/m

-0.20%

AUD

Monetary Policy Meeting Minutes

EUR

German ZEW Economic Sentiment

54.6

52.8

EUR

ZEW Economic Sentiment

63.1

59.1

GBP

10-y Bond Auction

2.74|1.8

USD

Employment Cost Index q/q

0.50%

0.50%

USD

Treasury Sec Lew Speaks

USD

FOMC Member Dudley Speaks

USD

FOMC Member Evans Speaks

USD

President Obama Speaks

NZD

PPI Input q/q

0.60%

0.60%

NZD

PPI Output q/q

1.00%

1.00%

CAD

Gov Council Member Murray Speaks

AUD

MI Leading Index m/m

-0.10%

JPY

Trade Balance

-0.88T

-1.09T

USD

Fed Chairman Bernanke Speaks

AUD

RBA Assist Gov Debelle Speaks

CNY

CB Leading Index m/m

0.90%

CNY

Foreign Direct Investment ytd/y

6.20%

JPY

All Industries Activity m/m

0.50%

0.30%

EUR

German PPI m/m

0.10%

0.30%

GBP

MPC Asset Purchase Facility Votes

0-0-9

0-0-9

GBP

MPC Official Bank Rate Votes

0-0-9

0-0-9

CHF

ZEW Economic Expectations

24.9

GBP

MPC Member Dale Speaks

CAD

Wholesale Sales m/m

0.40%

0.50%

USD

Core CPI m/m

0.10%

0.10%

USD

Core Retail Sales m/m

0.10%

0.40%

USD

Retail Sales m/m

0.10%

-0.10%

USD

CPI m/m

0.00%

0.20%

USD

Existing Home Sales

5.17M

5.29M

USD

Business Inventories m/m

0.30%

0.30%

USD

FOMC Member Dudley Speaks

USD

Crude Oil Inventories

-0.2M

2.6M

USD

FOMC Member Bullard Speaks

GBP

MPC Member Weale Speaks

USD

FOMC Meeting Minutes

CAD

BOC Gov Poloz Speaks

CNY

HSBC Flash Manufacturing PMI

50.9

50.9

NZD

Credit Card Spending y/y

5.20%

JPY

Monetary Policy Statement

JPY

BOJ Press Conference

CHF

Trade Balance

2.45B

2.40B

EUR

French Flash Manufacturing PMI

49.6

49.1

EUR

French Flash Services PMI

51.3

50.9

EUR

German Flash Manufacturing PMI

52.3

51.7

EUR

German Flash Services PMI

53.1

52.9

EUR

Flash Manufacturing PMI

51.6

51.3

EUR

Flash Services PMI

51.9

51.6

AUD

RBA Gov Stevens Speaks

GBP

Public Sector Net Borrowing

4.8B

9.4B

GBP

CBI Industrial Order Expectations

0

-4

USD

PPI m/m

-0.20%

-0.10%

USD

Unemployment Claims

333K

339K

USD

Core PPI m/m

0.10%

0.10%

USD

Flash Manufacturing PMI

52.6

51.8

USD

FOMC Member Powell Speaks

EUR

Consumer Confidence

-14

-15

USD

Philly Fed Manufacturing Index

15.8

19.8

USD

Natural Gas Storage

20B

EUR

German Buba President Weidmann Speaks

USD

FOMC Member Bullard Speaks

NZD

Visitor Arrivals m/m

-1.00%

JPY

BOJ Monthly Report

EUR

German Final GDP q/q

0.30%

0.30%

EUR

German Ifo Business Climate

107.9

107.4

EUR

Italian Retail Sales m/m

0.40%

0.00%

CAD

Core CPI m/m

0.00%

0.20%

CAD

Core Retail Sales m/m

0.20%

0.40%

CAD

CPI m/m

0.20%

0.20%

CAD

Retail Sales m/m

0.30%

0.20%

USD

FOMC Member George Speaks

EUR

Belgian NBB Business Climate

-6.9

-7.7

USD

JOLTS Job Openings

3.89M

3.88M

USD

FOMC Member Tarullo Speaks


As you can see, tomorrow Australia will have its monetary policy meeting, for Germany will be publish, as well as for the Euro Area, the ZEW economic sentiment and FOMC members Dudley and Evans will have their speeches.

economic-calendar-18.11.2013Wednesday will be first published the MPC votes for the Asset Purchases and the Official Bank Rate and after that United States will release the CPI, Retail Sales, Existing Home Sales, Business Inventories and not to forget the FOMC Meeting Minutes. The party will continue with the release of China’s HSBC Flash Manufacturing, BOJ will have its monetary policy statement and the press conference, while in Europe will be published the Flash indicators for the manufacturing and services sectors. Afterwards the American PPI, Unemployment Claims and Philly Fed Manufacturing PMI will be announced.

The week will end with the German Ifo Business Climate and Canadian releases. Each and every indicator mentioned earlier, and not only them, could trigger high volatility around their publication, especially if they will come as a surprise for the market.

Get your weapons ready, sharpen your money management systems and get the best from these runs that might come.

The post What to look for in the Economic Calendar this Week appeared first on investazor.com.

Has Bitcoin Gone Establishment?

By The Sizemore Letter

I’m not sure if this news is welcome or distressing to Bitcoin’s hardcore libertarian ideologues, but the U.S. Justice Department and the SEC are about to give the virtual currency their blessing as offering a “legitimate” financial service, according to representatives from both agencies. That news is driving Bitcoin up to fresh all-time highs north of $650.

bitcoin investing
Click to Enlarge
Of course, the U.S. government now has skin in the game. After shutting down Silk Road, an illegal drug trafficking website, the FBI walked away with the site’s Bitcoin stash, which amounted to about 1.5% of all Bitcoins in circulation.

If the government accepts Bitcoin as legitimate, half the gritty, underground appeal is gone. But for optimistic Bitcoin speculators investors, acceptance by the suits is a bullish sign of broadening demand for the anti-currency.

Demand from China helps, too. BTC China recently because the world’s largest Bitcoin exchange, overtaking Mt. Gox of Japan, and is using venture capital money to expand.

So, what’s the story here? Has the anti-currency come of age? Is Bitcoin “a thing” now?

No, it’s not. Frankly, it’s asinine, but I’ll get to that in a moment.

If you want to join the speculation party, be my guest. The “value” of a Bitcoin in dollar terms has tripled in the past month as the price has gone parabolic. As I’m writing this, it’s up by more than 26% in the past 24 hours alone. Who’s to say it can’t triple again in the next month?

But don’t put any money in Bitcoin that you can’t afford to lose. Bitcoins lost about 75% of their value in April, and at the time its price was less than half what it is today.

Furthermore, the arguments backing the currency are flimsy at best.

The Holey Argument for Bitcoin

Let’s start with its role as an anti-currency untainted by the world’s central banks and their quantitative easing.

If investors truly were concerned about debasement of the currency and a loss of purchasing power, then the prices of gold and other monetary precious metals would be rising.

They’re not.

After a brief blip this past summer, the price of gold has resumed the downtrend that started in October of last year. Gold is down about 30% in the past 13 months. Silver’s decline has been even more devastating, off about 40% since last October. Platinum? The price action has been a little more volatile, but platinum is also down about 20%. (ZeroHedge puts this into wonderful visual perspective in a recent post.)

I’m not the biggest fan of gold as an inflation and currency hedge. If I want to be out of the mainstream financial system, I prefer to buy something with tangible value, such as land or rental real estate. Gold collects no interest or rent, and in the event that all hell broke loose and society collapsed into anarchy (a perpetual Mad Max goldbug fantasy, it seems) gold would be as useless as paper currency.

The only currency that would have any value would be shotgun shells.

But all of that said, if Bitcoin were rising due to “fundamental reasons,” such as currency debasement, then precious metals should be following. The fact that they are not makes the rally highly suspect.

Furthermore, while the “full faith and credit” of the United States of America might not mean as much as it used to in the era of government shutdowns and default scares, what exactly are you putting your faith in with Bitcoin? An algorithm? The generous spirit of anarcho-libertarian hackers?

Given its anti-establishment ethos, you’re getting into bed with people with a questionable respect for the law. Earlier this month, a Chinese Bitcoin exchange “disappeared,” taking more than $4 million in Bitcoins with it. And this happened just days after a hacker stole $1.3 million in Bitcoins from an Australian online bank.

Bottom Line

Bitcoin is a bubble. Of course, bubbles can be fun, and it’s possible to make a killing in them. Plenty of speculators walked away from the greatest bubbles in history — everything from the Dutch tulip bulb bubble to the 1990s Internet bubble — laughing all the way to the bank.

So, I’m not going to wag my finger and tell you not to speculate. But I do recommend only trading with money you can afford to lose.

And take profits along the way.

Charles Lewis Sizemore, CFA, is the chief investment officer of the investment firm Sizemore Capital Management. As of this writing, he did not hold a position in any of the aforementioned securities. Click here to receive his FREE 8-part investing series that will not only show you which sectors will soar, but also which stocks will deliver the highest returns. This series starts Nov. 5 and includes a FREE copy of his 2014 Macro Trend Profit Report.

This article first appeared on Sizemore Insights as Has Bitcoin Gone Establishment?

Join the Sizemore Investment Letter – Premium Edition

Gameplan for 2014: Buy Europe and Emerging Markets

By The Sizemore Letter

I’ve got some good news for you and some bad news. We’ll get the bad news out of the way first.

Using the ratio of total market cap to GDP, the U.S. equity markets are looking expensive again.  This metric—which is one that Warren Buffett himself claims to use as a general gauge of market valuation—suggests that U.S. stocks are priced to return a measly 2.1% per year going forward.

The good news, however, is that many of my favorite international markets are priced to generate fantastic returns going forward.  Spain—which I wrote about last week—is priced to deliver returns of 11.4%.  Singapore is priced to deliver returns of 16.7%.

And the implied returns on several emerging markets is jaw-dropping.  China—which I wrote about last month—is priced to deliver annual returns of 34.3% per year.

Some major caveats are in order here. These estimates are for long-term returns based on current market caps, and the relationship between GDP and market cap is constantly evolving. There is no cardinal rule of nature that says that the future has to look like the past. And with capital markets evolving—and with the mega-cap multinationals that tend to dominate cap-weighted indices getting a larger and larger proportion of their revenues from outside their home markets—I would expect market caps to gradually trend upward as a percentage of GDP. Furthermore, GuruFocus made assumptions that future GDP growth will be the same as past growth. In a country like China—whose growth is slowing—this will massively overstate the implied future returns. And in Europe—where growth has been all but nonexistent for over half a decade—it will probably understate implied future returns.

So, we should take these estimates with a very large grain of salt and understand that they are exactly that: estimates.

Still, these valuations do support my investment thesis for the remainder of 2013 and 2014: European and emerging market equities should vastly outperform their American peers. In my Tactical ETF portfolios I have dedicated positions to the iShares MSCI Spain ETF (EWP) and the iShares China Large Cap ETF (FXI). Both have been in correction mode for most of the past month. That’s ok. Use the weakness as an opportunity to accumulate more shares.

Charles Lewis Sizemore, CFA, is the chief investment officer of the investment firm Sizemore Capital Management. Click here to receive his FREE 8-part investing series that will not only show you which sectors will soar but also which stocks will deliver the highest returns. The series starts November 5 and includes a FREE copy of his 2014 Macro Trend Profit Report.

This article first appeared on Sizemore Insights as Gameplan for 2014: Buy Europe and Emerging Markets

Join the Sizemore Investment Letter – Premium Edition

Bearish Bets on Gold Hiked “Aggressively” But Prices Move “Sideways” Short Term

London Gold Market Report

from Adrian Ash

BullionVault

Mon 18 Nov 08:35 EST

LONDON prices for gold reflected subdued dealing Monday lunchtime as silver and other commodities also dropped but major government bond price edged higher.

European shares drifted lower as well, but the MSCI World index was pulled up to 6-year highs by a sharp rise in Chinese equities.

 Prices ended the day on the Shanghai Gold Exchange unchanged in the Chinese Yuan, holding at a $3.90 premium per ounce to the world’s benchmark quote for London settlement.

 Silver fell 1.3% to $20.54 per ounce before ticking higher in line with gold.

 “With no significant impulses expected,” says the latest weekly update from refining group Heraeus, “we foresee a sideway movement in a range of $1280-1295 for the next few days.”

 “Overall this is a sideways environment,” agrees bullion market-maker ScotiaMocatta’s head of precious metals Simon Weeks, speaking to Reuters.

 “Prices are likely to trade within a range in the near term,” says Barclays analyst Suki Cooper, noting that “a potential pick-up in Chinese buying ahead of Chinese New Year may provide some support on the downside.”

 Looking at last week’s dovish testimony on 2014 Federal Reserve policy from likely chairwoman Janet Yellen however, “Gold has been presented with a number of catalysts over the past year and in particular over the past two months, all of which have failed to reignite investor demand,” Cooper adds, noting that in the US Comex gold futures and options market, latest data show “the most aggressive reduction in positioning since March 2012.”

 In the week-ending last Tuesday, the “net long” of bullish minus bearish bets held by speculative players fell 25% to a 4-week low, new data from regulators the Commodity Futures Trading Commission showed late Friday.

 As a group, non-industry players in gold futures and options raised the size of their short positions by 60% to the highest level in 3 months.

 “The ratio of the longs to shorts” amongst those speculators “was at 1.79 the lowest since mid-August,” says analysis from ANZ Bank.

 Across 17 other commodities contracts, notes Bloomberg, the net long position (of bullish minus bearish bets) fell 12%.

 “People were feeling very bearish before Yellen’s statement,” the newswire quotes Donald Selkin, chief market strategist at the $3 billion National Securities Corp. in New York.

 “Her comments were dovish and can be seen as a postponement to tapering, which is definitely helpful for gold. But the main reasons why gold has fallen are intact. Inflation is low, and equity markets continue to march ahead.”

 Wednesday this week brings US consumer price inflation data for October, expected to slip to 1.1% annually.

 But after the US Federal Reserve failed to “taper” its quantitative easing of $85 billion per month as expected in September, “It’s unlikely that [current chairman] Bernanke will do anything at his last meeting if he perceives that his successor would prefer to leave policy unchanged,” says Nic Brown, head of commodities research at French investment bank and London bullion dealer Natixis.

 “The Dollar may drop back…potentially positive for gold in the very short term.”

 But “There are hardly any strong views out there at the moment,” says a note from Swiss investment bank and London bullion market maker UBS.

 “Instead, there is a lot of nervous, defensive trading as investors strive to either protect [year-to-date] profits or avoid losses as we head closer into year-end.”

Adrian Ash

BullionVault

Gold price chart, no delay | Buy gold online


Adrian Ash is head of research at BullionVault, the secure, low-cost gold and silver market for private investors online, where you can fully allocated bullion already vaulted in your choice of London, New York, Singapore, Toronto or Zurich for just 0.5% commission.


(c) BullionVault 2013

Please Note: This article is to inform your thinking, not lead it. Only you can decide the best place for your money, and any decision you make will put your money at risk. Information or data included here may have already been overtaken by events – and must be verified elsewhere – should you choose to act on it.


Gold Futures Trades Flat on Fed- Tapering Speculation

By HY Markets Forex Blog

Gold futures were seen trading flat on Monday, steady below the $1,300-level per ounce as investors speculate on the Federal Reserve (Fed) and hoping it will keep its bond-buying program until the end of the year.

Gold futures dropped 0.07% lower, trading at $1,286.60 per ounce at the time of writing, while silver futures edged 0.30% lower at $20.670 per ounce.

The US dollar index, which measures the strength of the US dollar against a basket of six of its major peers, edged 0.07% lower, standing at 80.792 points. Holdings in the SPDR Gold Trust came in at 865.71 tones on Friday.

Gold Futures – Federal Reserve

The yellow metal has been trading below the $1,300 threshold per ounce as investors continue to speculate about how long the Federal Reserve will keep its monthly bond-buying program at its current pace.

On November 14th, Fed Chairperson nominee Janet Yellen said she would support the central bank’s monetary policy until the US economy is stronger.

Yellen said the US economy still needs to work on the growth of the economy and the unemployment rate as it remains high.

The current Fed Chairman Ben Bernanke is expected to give a speech on Tuesday, while minutes from the Federal Reserve’s (Fed) October meeting are expected to be released on Wednesday, November 20th.

Analysts are worried over the possibility that the central bank may start to taper its bond-buying program at its next meeting, scheduled for December 17-18.

Recent data released reveals that the number of non-farm payrolls climbed 204,000 higher in October, while the US economic growth expanded an annualized 2.8% in the third quarter.

However, some analysts are predicting that the Federal Reserve will begin tapering its asset-purchasing program at the March meeting.


Interested in trading Metals Online? 

Visit www.hymarkets.com and start trading today from only $50!

The post Gold Futures Trades Flat on Fed- Tapering Speculation appeared first on | HY Markets Official blog.

Article provided by HY Markets Forex Blog