Do You Have What it Takes to be an Active Investor?

By MoneyMorning.com.au

It’s hard to imagine the market and world’s economies carrying on like this forever.

You can’t continue to have a situation where a crisis appears and the only solution is to print more money and postpone the inevitable fallout to a later date.

You’ve doubtless heard the saying about ‘kicking the can down the road.’ One day someone will have to pick up the can. Right now no one knows when that day will arrive…or who will pick it up.

But that doesn’t mean the market and world’s economies can avoid the consequences forever.

That’s why two of our colleagues suggest you remain on high alert, because the blowback from ‘kicking the can’ could come at any moment…

As you know, we’re betting the Australian stock market will hit 6,000 points early next year and 7,000 points in 2015. We’re so confident that we topped up our personal share portfolio on Friday, taking advantage of the lower market.

We believe stocks will rally for two reasons.

You’ll see a continued demand for dividend paying stocks (which is why over one-third of the Australian Small-Cap Investigator stocks pay a dividend), plus you’ll see investors take more risks and buy growth stocks.

That’s especially so if investors believe the economy is improving (whether it really is improving or just an illusion is irrelevant. Investors buy stocks if they think things are getting better).

But we won’t deny it. We’re certain the markets can only cope with so many crises and temporary fixes. At some point investors will say they’ve had enough and refuse to play…

Stocks to Soar or Meet a Grisly End?

Last week our old pal Dan Denning warned you that a catastrophic market crash is inevitable. Well, he’s not the only one with a crash alert ringing loud.

Our new colleague Vern Gowdie, the chairman of Gowdie Family Wealth, warns that:

There’s going to be a stock market crash, here in Australia. A big one. The value of your shares may well have halved by this time next year.

The storm has been brewing since 2007. It will take around two more years to blow itself out. By the time it’s over, Australian stocks will most likely have fallen by 90%.

Many people have criticised us for giving you two opposite points of view – a bull market surge versus a bear market crash.

But giving you two views is a good thing. We would be doing you a disservice if we didn’t present these two different views. Not because it’s our purpose to offer a balanced point of view – we don’t do balanced points of view.

Instead, it’s important to introduce you to strong, well-researched ideas that have merit and which could help with your investing decisions. From that point on it’s up to you to decide which argument makes more sense.

Is it your editor’s view that investors will keep buying stocks as interest rates remain at record lows? Or is it that decades of government borrowing, spending and money printing must surely come to a financially grisly end?

Armed with both possibilities you can structure your investment portfolio in a way that suits your outlook and risk profile. That’s how we structure our personal investments. We’re backing the Aussie market to hit 7,000 points in 2015. But we haven’t put all of our money in stocks.

We own other investments such as cash, corporate securities (fixed interest), gold and silver. Depending on where we see the market heading we adjust how we invest our cash flow.

And that’s the thing. That’s what you have to do if you want to be an active investor

Active Investing Isn’t for Everyone

Quite frankly – and sorry to be blunt here – if you can’t be bothered or don’t have the capacity to digest various well-thought ideas and analyses then you’ve got no business being an active investor.

If reading two different points of view confuses you and leaves you wondering what to do, then our guess is your mind isn’t really into being an active investor.

And that’s fine. It’s not for everyone. In fact it’s probably best that you admit it and move on. Instead of managing your own money, you’re probably better suited to letting an investment manager look after your money and paying them a whopping fee for doing so.

The only thing is, you should find out how aware they are of the problems facing the financial world. Because if they’re like the 99% of the financial pros we come across, they’ve got no idea.

They’ll probably tell you to put all your money in stocks because, well, if anything goes wrong the government will just put everything right again.

This is the value of Money Morning giving you alternate views. It’s not to confuse you. It’s not to provide a balanced view. It’s to provide you with an educated and thorough analysis of the outlook for the market.

Naturally, both your editor and Vern can’t be right with our two-year forecasts. Or can we? Although we’re banking on the ASX hitting 7,000 points in 2015, after that anything’s possible.

Cheers,
Kris+

Join Money Morning on Google+

Special Report: UNAVOIDABLE: Australia’s First Recession in 22 Years

It’s About Time – How to Invest in a Secular Bear Market

By MoneyMorning.com.au

‘Time in the market’ or ‘timing the market’ – which do you believe?

The answer is, it depends on whether the market is in a secular (long term) bull or secular bear phase.

If you’re not familiar with secular markets, they are long term (10-20 year) cycles that take markets from an undervalued to overvalued (bull) position back to an undervalued (bear) position. And then the cycle repeats itself.

In simple terms, the bullcharges ahead and the bearclaws back the bull’sexuberance.

Plus and minus. Night and day. Yin and yang; good and bad. Drought and flood.

Opposing forces provide balance in the world. However, the investment industry has built an unbalanced story based on the secular bull only and completely ignored the secular bear.

This investment industry bias is completely understandable. The greatest secular bull market in history treated the industry very kindly.

From 1982 to 2007 the Australian share market rose from a little over 400 points to 6,800 points – nearly 1,500% in 25 years.

The 1987 ‘crash’ and the 2000 ‘Tech Wreck’ slowed but didn’t stop the charge of the secular bull.

During this 25-year bull ride the best strategy was to hang on (time in the market), even through the tough periods. Eventually the market would take you to a new high. That was until late 2007.

The 2007 detonation of sub-prime lending killed the secular bull and awoke the secular bear. The investment industry and the majority of investors still haven’t recognised this changing of the guard.

Identifying these once in two-decade turning points in markets is critical to your investment success or failure.

The following chart (courtesy of MacroTrends.com) shows us how secular market cycles (bull and bear)have played out in the US (Dow Jones index). The returns have been adjusted for inflation:

  • 1921 to 1948: blue line
  • 1948 to 1982: green line
  • 1982 to present: red line

In all three cycles the secular bullphase has delivered real (after inflation) returns, ranging from 300% to 700% – very impressive. Time in the market paid off handsomely.

After the secular bull finished charging in the first two cycles (blue and green lines) the secular bear set about clawing back the majority of those gains. The claw-back wasn’t a linear descent.

The market zigged and zagged its way to its eventual undervalued position (from where the next secular bullwould begin). It’s the ‘zigs and zags’ of a secular bear that requires a change of strategy to ‘timing the market’ – buy the dips and sell the recoveries.

The red line (current secular cycle) highlights this perfectly. The US secular bull ended seven years earlier than the Australian secular bull. The US market peaked with the tech boom in 2000.

From this peak it has repeated a distinctive down, up, down, up pattern. Over the past thirteen years ‘time in the market’ would have yielded you nothing in real terms. However, selling the peaks and buying the troughs (timing the market) would have been an extremely profitable investment strategy.

I readily acknowledge that without the benefit of 20/20 hindsight the timing strategy is a pretty difficult one to implement successfully.
 
This is why, on the surface, the industry’s message of ‘time in the market’ easily refutes the ‘timing’ option.

A lot of Pain Coming to Investors Who Ignore the Bear

However, there is a third strategy. Stay out of the market during a secular bear until valuations become cheap. History clearly shows us secular bear markets crush the optimism created during a secular bull.

Letting go of this optimism doesn’t happen overnight – human nature isn’t wired that way. It takes years to sap human confidence.

The US has played this down, up game for thirteen years. There remains an optimistic feeling the Fed will create a new secular bullmarket. While this optimism is evident then the secular bearisn’t finished – just biding its time and sharpening its claws.

The secular bearwon’t hibernate until it has ripped out investors’ hearts.

A few years ago the Wall Street Journal ran an article titled ‘The Market Timing Myth’.

The article referred to a study conducted by Javier Estrada, a finance professor at the IESE Business School at the University of Navarra in Spain:

[Professor Estrada] looked at nearly a century’s worth of day-to-day moves on Wall Street and 14 other stock markets around the world, from England to Japan to Australia. Yes, he found that if you missed the 10 best days you missed out on a lot of the gains. But he also found that if you managed to be out of the market on the 10 worst days, your profits went through the roof.’

The investment industry often cites the losses you would incur by missing the ten ‘best’ days in the market. However, they never mentioned how profitable it would be to miss the ten ‘worst’ days.

We know the market ‘goes up by the staircase’ and ‘down by the elevator’, so missing the down days is far more important. It’s simple maths. If a market falls 50%, it has to rise 100% for you to recover to your starting position.

Those big down days are more likely to happen during a secular bear, so for the average investor looking to retain their capital it’s best to wait for far better value to appear.

If you look at the red line on the chart above there is a massive air pocket between its current position and the two previous cycles. When this market runs out of Fed fuel and hits that air pocket, rest assured you’ll be glad you missed the big down days this secular bearhas in store for you .

Vern Gowdie+
Chairman, Gowdie Family Wealth

Special Report: UNAVOIDABLE: Australia’s First Recession in 22 Years

Join Money Morning on Google+

What to expect from the Economic Calendar for next Week

Article by Investazor.com

A pretty interesting week has ended. The data published for Great Britain was mixed, both manufacturing and construction PMI’s came under estimates, but the services PMI was in line with the expectations. The Chinese Manufacturing PMI was 51.1, under the forecasted value and the Canadian GDP did not surprise the markets.

From the Euro Area the Unemployment rate was 12.00% and the retail sales are up 0.4%, but the ECB remained dovish with their monetary policy. The Euro gained some trust during the ECB’s press conference, but the impulse came from the fact that Letta got the vote in Italy. United States published an ADP under estimates with 11K, but the unemployment claims rise only with 308K. The Non-Farm Payroll was scheduled for Friday, but because of the partial shutdown it was deleted from the FX calendar.

For next week we are expecting:

DateCurrencyForecastPrevious
MonOct 7CHFForeign Currency Reserves434.2B
CADBuilding Permits m/m-2.40%20.70%
TueOct 8NZDNZIER Business Confidence32
GBPBRC Retail Sales Monitor y/y1.80%
JPYCurrent Account0.65T0.33T
AUDANZ Job Advertisements m/m-2.00%
AUDNAB Business Confidence6
EURGerman Trade Balance15.1B14.5B
CHFCPI m/m0.20%-0.10%
CHFRetail Sales y/y1.70%0.80%
EURGerman Factory Orders m/m1.20%-2.70%
CADTrade Balance-0.7B-0.9B
CHFSNB Chairman Jordan Speaks
WedOct 9AUDWestpac Consumer Sentiment4.70%
JPYMonetary Policy Meeting Minutes
GBPManufacturing Production m/m0.30%0.20%
GBPBOE Credit Conditions Survey
GBPTrade Balance-8.9B-9.9B
EURGerman Industrial Production m/m1.10%-1.70%
GBPNIESR GDP Estimate0.90%
USDFOMC Member Evans Speaks
USDCrude Oil Inventories5.5M
USD10-y Bond Auction2.95|2.9
USDFOMC Meeting Minutes
ThuOct 10NZDBusiness NZ Manufacturing Index57.5
EURECB President Draghi Speaks
JPYCore Machinery Orders m/m2.90%0.00%
JPYTertiary Industry Activity m/m0.50%-0.40%
AUDMI Inflation Expectations1.50%
AUDEmployment Change15.2K-10.8K
AUDUnemployment Rate5.80%5.80%
CNYNew Loans669B711B
EURFrench Industrial Production m/m0.70%-0.60%
EURECB Monthly Bulletin
GBPAsset Purchase Facility375B375B
GBPOfficial Bank Rate0.50%0.50%
GBPMPC Rate Statement
CADNHPI m/m0.30%0.20%
USDUnemployment Claims307K308K
USDFOMC Member Bullard Speaks
JPYBOJ Gov Kuroda Speaks
EURECB President Draghi Speaks
FriOct 11CADEmployment Change15.3K59.2K
CADUnemployment Rate7.10%7.10%
USDPrelim UoM Consumer Sentiment77.277.5
CADBOC Business Outlook Survey
USDFOMC Member Powell Speaks
CHFGov Board Member Danthine Speaks
CADGov Council Member Murray Speaks
SatOct 12CNYTrade Balance25.2B28.5B
ALLIMF Meetings
EURGerman Buba President Weidmann Speaks
JPYBOJ Gov Kuroda Speaks

As you can see the most important indicators that will be published during next week are the Canadian Trade Balance, Great Britain’s Manufacturing Production and monetary policy.  Australia and Canada will publish their labor market data. From the Euro Area Mario Draghi will have a speech and the United States will release the FOMC meeting minutes.


The post What to expect from the Economic Calendar for next Week appeared first on investazor.com.

Monetary Policy Week in Review – Sep 30-Oct 4, 2013: 11 central banks on hold as Fed decision now appears astute

By www.CentralBankNews.info
    Last week 11 central banks kept their policy rates steady while Romania cut its rate for the third time in a row as the U.S. Federal Reserve’s surprise decision to delay a tapering of its asset purchases now looks like a very astute and prescient move given the economic fallout from the shutdown of the federal government and growing nervousness over the debt limit.
    In its statement from Sept. 18 the Fed said it would “await more evidence that progress will be sustained before adjusting the pace of its purchases” and last week Atlanta Federal Reserve Bank President Dennis Lockhart said the disruptions from political gridlock in Washington D.C. had  “vindicated” the Fed’s decision.
    The Fed already said in June that “fiscal policy is restraining economic growth” and San Francisco Fed President John Williams voiced what appears to be growing frustration within the Fed over the inability of politicians to pull in the same direction as the central bank.
    “Every time there is another factor holding us back, whether it is tax policy, whether it is spending … it just means we have to keep interest rates lower for longer. We have to do more active purchases,” Williams was quoted as saying in San Diego.
    But it’s not only the Fed that is continuing with extraordinary accommodative monetary policy, ultra-easy policy is seen across most advanced economies and last week the European Central Bank (ECB) confirmed that its policy would “remain accommodative for as long as necessary” and further stimulative measures were possible if money market rates were to rise.
    One of the recurring themes among advanced central banks since May, when global bond yields rose in response to the prospect of reduced asset purchases by the Fed, has been to assure markets and investors that monetary policy will not be tightened before the economic recovery is truly on a sound footing and unemployment rates are down to more normal levels.
    Sweden’s Per Jansson, a member of the Riksbank’s board, was the latest to push back against financial markets’ expectations of tighter policy.
    Financial markets are currently pricing in a 50 percent chance of a Swedish rate rise in April 2014, but Jansson said this was too soon and the central bank’s plan was to wait until the end of end of next year before tightening.
    Global monetary policy thus continues on on divergent paths, with most advanced economies continuing with extremely loose policy while some major emerging markets have been tightening to stamp out inflationary pressures from currency depreciation.
    In addition to the ECB, the Bank of Japan (BOJ) last week also maintained its aggressive policy stance, the Reserve Bank of Australia (RBA) kept its cash rate at a record low, adding “a lower level of the currency than seen at present would assist in rebalancing growth in the economy,” while the National Bank of Poland confirmed that it expected to keep its reference rate at a record low at least until the end of this year.
    Other banks that maintained policy rates last week included Angola, Mauritius, Zambia, the Dominican Republic, Iceland, Uganda and Botswana. (Click on the links to read the story.)

    Through the first 40 weeks of this year, the global trend toward lower policy rates remains in tact although it may have bottomed out following the recent rate rises by several emerging markets.
    Policy rates have been cut 89 times so far this year, or 22.8 percent of this year’s 389 policy decisions by the 90 central banks followed by Central Bank News, down from 23.3 percent the previous week and 23.6 percent two weeks ago and 25.3 percent after the first half of 2013.
    Meanwhile, central banks have raised rates 21 times, or 5.4 percent of this year’s policy decisions, down from 5.6 percent the previous week but up from 4.7 percent at then end of June. Emerging markets account for 43 percent of the 21 rate rises, with Brazil, Indonesia and India accounting for eight of those rate rises.

LAST WEEK’S (WEEK 40) MONETARY POLICY DECISIONS:

COUNTRYMSCI      NEW RATE             OLD RATE         1 YEAR AGO
ROMANIAFM4.25%4.50%5.25%
ANGOLA9.75%9.75%10.25%
MAURITIUSFM4.65%4.65%4.90%
ZAMBIA9.75%9.75%9.25%
DOMINICAN REPL.6.25%6.25%5.00%
AUSTRALIADM2.50%2.50%3.50%
POLANDEM2.50%2.50%4.75%
ICELAND6.00%6.00%5.75%
EURO AREADM0.50%0.50%0.75%
UGANDA12.00%12.00%15.00%
BOTSWANA8.00%8.00%9.50%
JAPANDM                N/A                N/A0.10%

    This week (week 41) six central banks are scheduled to hold policy meetings, including those from Indonesia, Brazil, Croatia, South Korea, United Kingdom and Peru. Singapore’s monetary authority is also likely to hold its bi-annual policy meeting next week but the exact date has not been released.

COUNTRYMSCI             DATE  CURRENT  RATE        1 YEAR AGO
INDONESIAEM8-Oct7.25%5.75%
BRAZILEM9-Oct9.00%7.25%
CROATIA9-Oct6.25%6.25%
SOUTH KOREAEM10-Oct2.50%2.75%
UNITED KINGDOMDM10-Oct0.50%0.50%
PERUEM10-Oct4.25%4.25%

 
  www.CentralBankNews.info

Top Five Stocks With Insider Buying

By The Sizemore Letter

I’ve written recently about insider buying (see “Two REITs With Insider Buying” and “Kinder Morgan Insiders Backing Up the Truck”).

As I wrote before, company insiders can sell their company’s stock for any number of reasons.  Perhaps they are diversifying or reallocating their portfolios, or perhaps they decided to pony up for a beach house.

But there is only one reason why company insiders would buy their company’s stock, and that is because they consider it underpriced and due for a bounce.

With that in mind, I ran a stock screen for insider “cluster buys,” or large purchases by multiple insiders.  In order to make the cut, a stock had to have multiple, unique insider buys over the past three months.  And with no further ado, here is a list of the top five ranked by number of insider buys:

Aircastle Ltd (AYR):  21 insider buys for a total 663,400 shares.

RLJ Entertainment (RLJE): 12 insider buys for a total of 30,082 shares

ERF Wireless Inc (ERFB): 9 insider buys for a total of 229,412 shares

Remax Holdings Inc (RMAX): 9 insider buys for a total of 51,450 shares

Main Street Capital Corp (MAIN):  9 insider buys for a total of 6,113 shares

Of each of these stocks, only two have had significant price movements since the insider trading began.  ERF Wireless is down 72% and Remax is up 37%.

An insider buying screen does not constitute exhaustive research, of course.  You still need to roll up your sleeves and investigate any stock before you buy it. But a screen like this can be a useful first step. If the insiders are buying, it’s a stock that is worth a look.

Charles Lewis Sizemore, CFA, is the editor of the Sizemore Investment Letter and the chief investment officer of investments firm Sizemore Capital Management. Click here to learn about his top 5 global investing trends and get your copy of “The Top 5 Million Dollar Trends of 2013.”  This article first appeared on TraderPlanet.

This article first appeared on Sizemore Insights as Top Five Stocks With Insider Buying

Join the Sizemore Investment Letter – Premium Edition

Trading and Gambling – 5 Fundamental Differences

When it comes to making money, many consumers assume that Forex trading and gambling are the same. The assumption that trading and gambling are the same is wrong because fundamental differences are found between the two activities. Learning about the differences will make it easier to feel comfortable with investments and trading to generate cash from savings.

Research:Forex trading is based on research into different countries, currency exchanges, politics and other factors that will create a rise or fall in the exchange rates. Investors spend several hours, days or even weeks looking into all of the factors involved in the exchange rates.

Gambling with the devil

In trading, research is a vital part of making any investment decision. Investors are making an educated decision based on historical trends in prices, current rates and the economic climate in two countries. The amount of research that goes into making a trade is a key difference between gambling.

In gambling, research is not necessary because the odds are already given. The individual makes a bet and plays the game. It does not involve hours of research and the bets are made with the full knowledge that individuals are more likely to lose than to win.

Risk of Losing:

The risk of losing is much higher in gambling because the odds are stacked against the players. In a casino, gamblers are more likely to lose funds over the course of the evening. Professional gamblers have a much higher risk of losing funds than making gains.

In trading, and especially if you’re a scalper, the risk of loss is much less because countries care about their economy and work to improve economic standing over time. While it is risky to invest in emerging market currencies due to the speculative nature of the country’s current economy, most well-developed countries will take measures to protect their currency.

Actual Value:

Gambling is making a bet on a game. It does not have any value and it is not a type of property. Trading is different because the exchange is between two currencies. When the trade is complete, the investor is still holding onto a property. In the case of Forex trading, the investor is holding onto the currency of a different country instead of the original currency put into the trade.

Limiting Losses:

In trading, it is possible to limit the amount of loss an investor is likely to see. Trading allows investors to put a stop-loss on the account so that it will automatically sell the original investment if it drops below a certain amount. As profits are made over time, investors can move the stop-loss so that it is possible to ensure a profit by selling before the figures drop below the initial funds put into the account.

Gambling does not have a limitation. It is an all-or-nothing game. Players either lose everything or win everything in most gambling games. That means it is impossible to limit losses.

Diversity:

Trading is about diversifying investments to hedge risks. In Forex trading, that means investing in several different currencies and exchange markets to get the greatest diversity among emerging markets, developed markets and different countries. By diversifying the currencies, it is possible to gain profits even if one currency results in a loss.

Gambling does not have any diversity. While players can select different games, they are all a matter of pure chance and it is not possible to hedge the risk by playing more than one game.

Trading and gambling are not the same. Fundamental differences exist because it is possible to reduce the risk of trading different currencies to ultimately result in a profit. Investors will usually see a profit over time by diversifying accounts and making careful decisions. Gamblers will inevitably see major losses because the casinos have a major advantage over the players.

About the Author

Post written by Jamie Hanley, writer for a number of finance and forex blogs, and forex trader for himself.


Is Apple Going the Way of Microsoft?

By The Sizemore Letter

Apple’s (AAPL) share price has been on the rebound ever since Carl Icahn’s infamous tweet reignited interest in the company.  Still, the stock is down 30% from its all-time highs hit last year, and there is a general consensus that the company’s days of rapid growth are behind it.

A common question I hear asked is whether Apple is destined to follow in Microsoft’s (MSFT) footsteps, suffering years of underperformance.  Microsoft, like Apple, once held the distinction of being the most valuable company in American history.  (And adjusted for inflation, Microsoft’s 1999 high-water mark still holds the title.)   Today, Microsoft’s share price is still 40% below its dot-com-era peak…13 years later.

Ouch.

There are certainly some similarities.  Both companies were dominant in their respective areas of expertise: Microsoft in PC operating systems and office productivity software and Apple in smart mobile devices.  Both companies were led by brilliant technology visionaries in their heyday, and now both are led by less-imaginative “company men,” at least until Steve Ballmer’s replacement is announced.  And both, once they grew to a certain size, found their markets mature or close to maturity with fewer obvious avenues for growth.

But there is one major difference between the two stocks: valuation.

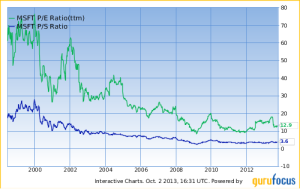
MSFT PE

In 1999, Microsoft’s valuation had reached absurd, nosebleed levels that were (sadly) typical for the time.  Microsoft peaked with a trailing price/earnings ratio of over 70 and a price/sales ratio of over 20.

We’re talking about the peak of one of the greatest stock bubbles in history.  From those levels, Microsoft was doomed to years of stock price correction, regardless of how successful the company operationally.  Ballmer can be faulted for missing the boat on the mobile revolution and for a generally sloppy history of acquisitions over his tenure.  But Microsoft’s stock underperformance since 2000 is a product of an unrealistically high starting price.

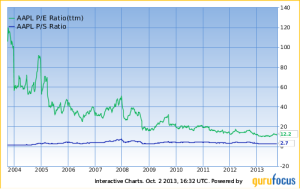
AAPL PE

Let’s now take a look at Apple.

Apple is peculiar because its trailing price/earnings ratio and price/sales ratio actually trended downward throughout its meteoric rise in the mid-to-late 2000s.  At its peak last year, Apple traded hands for 13 times trailing earnings; hardly a bubbly valuation by any standard.

What does this mean going forward?  Is Apple destined to become the next Microsoft?

If we’re talking about the share price, I would say no.  Apple’s shares trade at a steep discount to the broader market, and the company is aggressively raising its dividend.  Though Apple is no longer the growth story it once was, it’s a profitable company with a cheap stock.

If we’re talking about shareholder friendliness, then I legitimately hope Apple follows the path of Microsoft.  Microsoft has raised its quarterly dividend from $0.08 per share in 2003 to $0.28 per share today.  A similar move by Apple would represent the greatest transfer of wealth to investors in history.

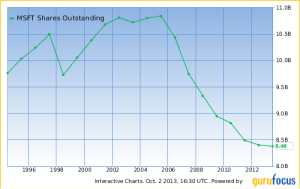
MSFT Share Count

Microsoft has also reduced its share count by 23% since 2005 and plans to aggressively continue its share buybacks in the years ahead.

As an investor, you cannot control the future direction of the market.  But you can control the price you pay.  And today, both Apple and Microsoft are reasonably-priced stocks with a high probability of seeing continued dividend growth and share count reduction.

Charles Lewis Sizemore, CFA, is the editor of the Sizemore Investment Letter and the chief investment officer of investments firm Sizemore Capital Management. As of this writing, he was long MSFT. Click here to learn about his top 5 global investing trends and get your copy of “The Top 5 Million Dollar Trends of 2013.”  This article first appeared on MarketWatch.

This article first appeared on Sizemore Insights as Is Apple Going the Way of Microsoft?

Join the Sizemore Investment Letter – Premium Edition

USDCHF: Vulnerable Despite Printing Rejection Candle.

USDCHF – Although the pair saw a price rejection candle and closed marginally lower the past week, its broader medium term downside bias remains lower. If its present attempts on the upside fail, expect USDCHF to return to the 0.8967 level. Further down, support lies at the 0.8900 level with a turn below here leaving the pair targeting the 0.8850 level followed by the 0.8800 level. Its weekly RSI is bearish and pointing lower supporting this view. On the other hand, the alternative scenario will be for the pair to retake the 0.9278 level followed by the 0.9454 level. Further out, resistance resides at the 0.9496 level with a break paving the way for a run at the 0.9750 level and subsequently the 0.9838 level, its Jun 2013 high. On the whole, the pair remains biased to the downside on further bearishness.

By fxtechstrategy.com


A Big Reason Why 2013 Stock Prices are in the Stratosphere

Margin debt is up 100 times in the last 39 years

By Elliott Wave International

A famous quote attributed to Archimedes, the ancient Greek mathematician, is: “Give me a place to stand and with a lever I will move the whole world.” And, as you probably know, leverage can also move the stock market.

In the July-August Elliott Wave Theorist, Robert Prechter discussed the role of leverage in sending the market to new price highs.


Get a FREE 2-page sample of Robert Prechter’s Elliott Wave Theorist.


First, take a look at this chart from that issue, and then read Prechter’s commentary.

Margin debt, incredibly, is up 100 times in the last 39 years (see the chart above). It was $4 billion back in 1974; it’s nearly $400 billion today. That is a big reason why stock prices are in the stratosphere. You might think that there’s a lot more money around, thereby justifying the rise. … Let’s normalize this indicator to GDP and see what we have. … [M]argin debt as a percentage of annual GDP is still 10 times the 1974 level. … The current ratio is also 3 times what it was at previous major tops in the stock market in the 20th century.

The Elliott Wave Theorist, July-August 2013

Margin debt levels are not a precise market timing indicator, but one major financial firm advises caution.

“Investors have rarely been more levered than today,” said Deutsche Bank, warning that the spike in margin debt is a “red flag” and should be watched closely. … It said the equity rally may have further legs but it cited “astonishing similarities” between the latest patterns and events preceding prior market crises.

— The Telegraph, August 13

The high levels of margin debt in the stock market should be a concern to every investor, as should other indicators that Elliott Wave International reviews.

You can learn what EWI sees ahead for the market by reviewing The Elliott Wave Theorist without any obligation. No questions will be asked if you decide to cancel within 30 days. You have nothing to lose and exclusive market insights to gain.

See what Prechter presents to subscribers of The Elliott Wave Theorist with no obligation for 30 days. The September issue is packed with insights you won’t see anywhere else. Preview what’s inside and learn how to get your risk-free review.

This article was syndicated by Elliott Wave International and was originally published under the headline A Big Reason Why 2013 Stock Prices are in the Stratosphere. EWI is the world’s largest market forecasting firm. Its staff of full-time analysts led by Chartered Market Technician Robert Prechter provides 24-hour-a-day market analysis to institutional and private investors around the world.


Quality over Quantity Stressed at Colorado Conferences

Source: JT Long of The Gold Report (10/4/13)

http://www.theaureport.com/pub/na/quality-over-quantity-stressed-at-colorado-conferences

If it is fall, it must be conference season in Colorado. The Denver Gold Forum, held Sept 22–25, was an invitation-only event billed as featuring seven-eighths of the world’s publicly traded gold and silver companies measured by production. It was preceded by the Precious Metals Summit in Beaver Creek, which focused on smaller, emerging companies, some 90 of them with market caps of at least $20 million. Attendees included analysts, fund managers and institutional investors eager to hear updates on companies they own—or may want to own in the future. The Gold Report Publisher Karen Roche and Associate Publisher Jason Mallin were there and brought back these reports.

At the Denver Gold Forum, Adrian Day, president of Adrian Day Asset Management, noted, “Among the larger miners, there was the constant drumbeat that profitable operations would come ahead of growth for the sake of growth. To hear ‘Our new focus is on mines that make money’ makes one wonder what the old focus was: ‘Mines that lost money,’ perhaps? We all know that when gold gets back to $1,800 an ounce ($1,800/oz) or $1,900/oz, the miners—admittedly at the behest of large shareholders—will be out there once again looking for acquisitions. Why are they not looking for acquisitions now, when the market is depressed? Isn’t this the time to be buying? A few are, but very few.”

He used the opportunity of having company management in one place to visit with those in his portfolio, and with some companies that were not. “Generally, companies we own justified the support, while those we do not own did nothing to change that view. One exception: I never thought I’d say this, but Barrick Gold Corp. (ABX:TSX; ABX:NYSE) is looking intriguingly undervalued here. (That is not a recommendation, but we’re looking.)”

Beacon Rock Research founder Michael Niehuser used the conference to learn more about the companies attending. “A focus among presenters at the 2013 Denver Gold Forum was on reducing costs in an effort to demonstrate viability. This was reminiscent of the late 1990s. If this is the case, there should be a good opportunity to locate companies with good prospects.” He sat down with Excellon Resources Inc. (EXN:TSX; EXLLF:OTCPK) and was impressed with what he heard. “The company appears to have the potential to emerge as a solid junior silver producer in the class of an Endeavor Silver Corp. (EXK:NYSE) or Great Panther Silver Ltd. (GPR:TSX; GPL:NYSE.MKT). Excellon is one of the highest grade silver producers in the world, with a goal of increasing annual production to about 1.4–1.5 million ounces (1.4–1.5 Moz) of silver a year or approximately 2.2 million silver equivalent ounces.

“Excellon appears to have moved beyond some of the challenges of 2012 and represents one of the best investment ideas undiscovered by analysts. This low-tonnage underground operation has produced grades of about 800 grams per ton silver and is producing about $1 million of cash flow on a monthly basis over the last quarter. The project has a resource of about 17 Moz of silver, representing 7 to 10 years of production, with exceptional potential to both expand the identified resource and potentially locate additional higher grade feeder zones. With the recent roll back and apparently satisfied shareholder base, Excellon appears to have the bases of production, exploration and potential acquisition covered.”

Brent Cook, exploration analyst, geologist and publisher of Exploration Insights, was blunt: “The overriding theme of the Denver event could be politely summarized as an industry in transition, less politely, in decline. The major miners are rationalizing operations, reshaping and recalibrating their companies, ‘getting smarter,’ and focusing on all-in sustaining costs and cash flow while cutting dividends. This means shutting down or selling marginal operations, cutting production, high grading, slowing development and in many cases eliminating exploration. We know where this will lead—the eventual acquisition of profitable deposits, as well as a few desperation mergers. Although the focus on earnings is a positive development, it was tough to come away with a real reason to pony up some cash and buy many of the larger companies. There were, of course, a few exceptions.”

Cook also attended the Precious Metals Summit and was a little more positive. “I came away rather optimistic that we will see a number of discoveries develop into economic deposits over the next few years. There are some solid professionals diligently working through the process of turning geochemical anomalies into profitable mineral deposits, a few of which will be significantly profitable. The hurdles between an anomaly and proven deposit include metallurgy, strip ratio and geology, plus infrastructure, jurisdiction and social and environmental realities. To this list we need to add the ever-increasing time required to execute the most basic of work programs, coupled with the lack of shareholder patience and knowledge about exploration and mining. We should expect many prospects and companies to fall by the wayside, while a few manage to survive.

“In addition to the obstacles noted above, the industry is faced with a difficult financing environment for such speculative endeavors. The high-volume, fast-money hedge funds and retail are, for the most part, burned out and licking their wounds. There is, however, a new source of capital entering the mining sector that is, as yet, untainted by the sector’s previous excesses. Value funds see this as a down-beaten sector that could offer a bargain based on the lowered price-earnings ratios, technical reports and other financial metrics. I also noted a marked increase in private equity investors who claim to be seeking significant participation in mining ventures and activist roles on company boards. I suspect that if these new groups are extremely diligent in their research, they will do well as the mining companies come looking for assets in the future and the few stellar assets come into production.

“My intention was to come away from the two shows with at least one new company to add to the EI list—prices are down after all. The criteria were pretty straightforward: a simple, inexpensive operation that offered above average profitability and good exploration upside in a relatively stable jurisdiction managed by a competent group that can see the goal line. I was successful.”

Michael Gray, an analyst with Macquarie Capital Markets Canada, was impressed by the uptick in the number of intermediate to senior corporate development attendees at the Precious Metals Summit, along with a higher proportion of private equity firms. “High grade/high margin was a key theme—no surprise here with a focus on smaller high IRR deposits that have easier permitting runways and low capital expenditure (capex) requirements. Selected companies that stood out with such development projects included Probe Mines Limited (PRB:TSX.V), Roxgold Inc. (ROG:TSX.V), Troy Resources Ltd.’s (TRY:TSX; TRY:ASX) West Omai project and MAG Silver Corp. (MAG:TSX; MVG:NYSE).”

A presentation from The Bostonians panel drilled down on what makes a good CEO. “Key attributes included capital allocation discipline, demonstrating strong leadership, presenting a coherent strategy (and sticking to it) and focusing on increasing value of the business on a per share basis. CEOs such as Troy Resources’ Paul Benson and Midas Gold Corp’s (MAX:TSX) Stephen Quin come to mind,” said Gray.

Another focus was the importance of safe jurisdictions. Of the 90 companies presenting, 57% were North America assets (51 companies, with 23 in Canada, 12 in the United States, 13 in Mexico, 2 in the Dominican Republic and 1 in Nicaragua). Another 17% had South America assets (15 companies, with 8 in Columbia, 2 in Peru, 3 in Brazil, 1 in Chile and 1 in Argentina). A total of 11% included assets in Africa (10 companies, with 5 in West Africa, 3 in Burkina Faso, 1 in Ghana and 1 in South Africa). Another 10% had assets in Europe (9 companies, with 4 in Turkey and 5 in other countries). Four percent had assets in Asia (4 companies, with 1 each in Papua New Guinea, the Philippines, Indonesia and Mongolia). The last company was from Australia. Gray says, “Our broad takeaway is that North American projects are likely easier to fund in this lower gold price environment. Among our junior companies under coverage, the following meet our safe jurisdiction definition: MAG Silver, Midas Gold, Probe Mines,ATAC Resources Ltd. (ATC:TSX.V), Gold Standard Ventures Corp. (GSV:TSX.V; GSV:NYSE), Eastmain Resources Inc. (ER:TSX), Virginia Mines Inc. (VGQ:TSX) and Strategic Metals Ltd. (SMD:TSX.V). Among our producing companies under coverage at the conference, Primero Mining Corp. (PPP:NYSE; P:TSX)best fits the definition.”

One bright spot was the discovery that exploration costs are coming down in most jurisdictions. “We asked a number of companies if drilling costs had come down and the response ranged from 10–30% reductions. Despite these savings, the majority of the companies were sticking with the same exploration budget, but drilling more meters for fewer dollars. The main reason for the decline in drill costs relates to the lack of financing for juniors that has resulted in few rigs active for the drilling companies and much more competitive pricing.” Weakened drill demand seemed to be the result of a market that is not paying much attention to early-stage drill hole plays. “We only counted nine among the 90 companies. Our takeaway is that these companies have been hit the hardest. This said, the best ones tend to already have a strategic investment from an intermediate or senior providing validation; this includes ATAC and Gold Standard Ventures.

Overall, the Precious Metals Summit reinforced Gray’s conviction that high margin deposits will be the most sought-after opportunities for funding. “Investments and funding will continue to focus on companies with assets in safe jurisdictions such as Canada, Mexico and the U.S. Our top producer picks at the conference were Primero and Troy. Top developers and explorers were MAG Silver, Probe, Roxgold and Midas Gold.”

Dan Hrushewsky, senior precious metals analyst at Jennings Capital, also saw the quality-over-quantity theme in action at the Precious Metals Summit. This came in the form of “reserves calculated at lower prices to obtain smaller but higher grade ore bodies.” He also saw a lot of emphasis on disciplined capital allocation by companies deferring or rationalizing capex decisions and investing in higher return projects only to maintain a strong balance sheet. This was also realized by reducing costs through head office headcount and salary reductions, deferring stripping decisions, processing stockpiles where available, contract renegotiation with contractors and reducing exploration. “Everyone stressed the undrawn lines of credit they had secured,” he said.

Not everyone was scaling back, however. Hrushewsky heard a Goldcorp Inc. (G:TSX; GG:NYSE)executive say, “Growth is not a dirty word.” And a Barrick executive quipped, “You can’t have five or six months of gold price weakness decide whether or not to build a mine with a 25-year mine life.”

In the end, Hrushewsky was impressed by Bard College Professor Walter Mead’s message that the “demise of the U.S. dollar” thesis does not need to play out for demand for gold to grow. As more and more people stop being involved in subsistence farming, demand for methods to store wealth will increase. “Demand for gold is somewhat independent of demand for the U.S. dollar, as there is room for both to grow as the overall pie grows.”

Adrian Day, London-born and a graduate of the London School of Economics, heads the eponymous money management firm Adrian Day Asset Management (www.adriandayassetmanagement.com; 410-224-2037), where he manages discretionary accounts in both global and resource areas. Day is also sub-adviser to the new EuroPacific Gold Fund (EPGFX). His latest book is “Investing in Resources: How to Profit from the Outsized Potential and Avoid the Risks.”

Mike Niehuser is the founder of Beacon Rock Research LLC, which produces research for an institutional audience and focuses in part on precious, base and industrial metals, oil and gas and alternative energy. Previously a vice president and senior equity analyst with the Robins Group, he also worked as an equity analyst with The Red Chip Review. He holds a bachelor’s degree in finance from the University of Oregon.

Brent Cook brings more than 30 years of experience to his role as a geologist, consultant and investment adviser. His knowledge spans all areas of the mining business, from the conceptual stage through detailed technical and financial modeling related to mine development and production. Cook’s weekly Exploration Insights newsletter focuses on early discovery, high-reward opportunities, primarily among junior mining and exploration companies.

Michael Gray is a mining equity analyst with Macquarie Capital Markets and covers a range of precious metal explorers and producers with an emphasis on North and South America. He is an exploration geologist and holds a bachelor’s degree in geology (University of British Columbia) and master’s degree in economic geology (Laurentian University). His career of more than 25 years in the mineral exploration business started with senior mining companies including Falconbridge, Lac Minerals, Cominco and Minnova, where he worked throughout Canada and the U.S. He co-founded Rubicon Minerals in 1996 and helped navigate the company through a series of joint ventures and an asset portfolio build that was eventually centered on the Red Lake gold district in Canada.

Dan Hrushewsky, senior precious metals analyst at Jennings Capital, is primarily responsible for African precious metals. He joined Jennings Capital in Toronto from NCP Northland Capital Partners, and was previously senior vice president, corporate development with Chalice Gold Mines and vice president of High River Gold. Hrushewsky has nearly 30 years of experience within the mining sector. Hrushewsky holds an engineering degree from the University of Toronto, a Master of Business Administration degree from McMaster University and is a CFA.

Want to read more Gold Report interviews like this? Sign up for our free e-newsletter, and you’ll learn when new articles have been published. To see a list of recent interviews with industry analysts and commentators, visit our Streetwise Interviews page.

DISCLOSURE:

1) JT Long collected the feedback for The Gold Report and provides services to The Gold Report as an employee. She or her family own shares of the following companies mentioned in this interview: None.

2) The following companies mentioned in the interview are sponsors of The Gold Report: Primero Mining Corp., Gold Standard Ventures Corp., Virginia Mines Inc., MAG Silver Corp., Probe Mines Limited, Excellon Resources Inc., Roxgold Inc., Goldcorp Inc. and Great Panther Silver Ltd. Streetwise Reports does not accept stock in exchange for its services or as sponsorship payment.

3) Adrian Day: I or my family own shares of the following companies mentioned in this interview: None. I personally am or my family is paid by the following companies mentioned in this interview: None. I was not paid by Streetwise Reports for participating in this interview. Comments and opinions expressed are my own comments and opinions.

4) Mike Niehuser: I or my family own shares of the following companies mentioned in this interview: None. I personally am or my family is paid by the following companies mentioned in this interview: None. I was not paid by Streetwise Reports for participating in this interview. Comments and opinions expressed are my own comments and opinions.

5) Brent Cook: I was not paid by Streetwise Reports for participating in this interview. Comments and opinions expressed are my own comments and opinions.

6) Michael Gray: Macquaries Capital Markets disclosures are available here. I was not paid by Streetwise Reports for participating in this interview. Comments and opinions expressed are my own comments and opinions.

7) Dan Hrushewsky: I was not paid by Streetwise Reports for participating in this interview. Comments and opinions expressed are my own comments and opinions.

8) Interviews are edited for clarity. Streetwise Reports does not make editorial comments or change experts’ statements without their consent.

9) The interview does not constitute investment advice. Each reader is encouraged to consult with his or her individual financial professional and any action a reader takes as a result of information presented here is his or her own responsibility. By opening this page, each reader accepts and agrees to Streetwise Reports’ terms of use and full legal disclaimer.

10) From time to time, Streetwise Reports LLC and its directors, officers, employees or members of their families, as well as persons interviewed for articles and interviews on the site, may have a long or short position in securities mentioned and may make purchases and/or sales of those securities in the open market or otherwise.

Streetwise – The Gold Report is Copyright © 2013 by Streetwise Reports LLC. All rights are reserved. Streetwise Reports LLC hereby grants an unrestricted license to use or disseminate this copyrighted material (i) only in whole (and always including this disclaimer), but (ii) never in part.

Streetwise Reports LLC does not guarantee the accuracy or thoroughness of the information reported.

Streetwise Reports LLC receives a fee from companies that are listed on the home page in the In This Issue section. Their sponsor pages may be considered advertising for the purposes of 18 U.S.C. 1734.

Participating companies provide the logos used in The Gold Report. These logos are trademarks and are the property of the individual companies.

101 Second St., Suite 110

Petaluma, CA 94952

Tel.: (707) 981-8999

Fax: (707) 981-8998

Email: [email protected]