GOLD: Sees Further Bearishness.

GOLD: Sees Further Bearishness.

GOLD: The commodity broke lower today leaving the risk of further downside on the cards. The threat is for more weakness to occur towards the 1,272.00 level. A violation of this level will aim at the 1,250.00 level with a turn below here shifting attention to the 1,215.00 level and next the 1,180.00 level. Its daily RSI is bearish and pointing lower suggesting further downside. Conversely, resistance lies at the 1,329 level where a breach will target the 1,399.79 level. A cut through here will open the door for a run at the 1,433 level. Further out, resistance resides at the 1,450.00 level, its psycho level. All in all, GOLD remains biased to the downside.

By www.fxtechstrategy.com


Is Bank of America Worth More Dead than Alive?

By The Sizemore Letter

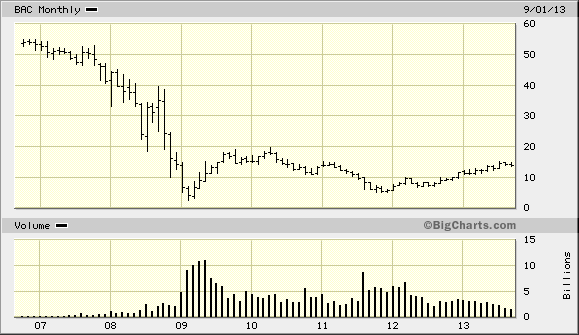
If there were ever a familiar name left for dead by Wall Street, it would be Bank of America Corporation (BAC).  It’s been nearly seven years since Bank of America’s stock price has seen a new high.

Sure, the stock has more than quadrupled from its early 2009 lows. But nearly all of those gains happened in the second and third quarters of 2009.  Bank of America has drifted lower in the years that have followed, and its current stock price is down by nearly a quarter since early 2010.

BAC

The reasons for lack of investor enthusiasm are well known.  Banks were at the center of the 2008-2009 crisis, and Bank of America’s mortgage portfolio was one of the largest and weakest of any major bank and the most at risk for claims from distressed borrowers.  New curbs on proprietary trading and higher capital requirements would be a drag on future earnings growth.  And higher interest rates would crimp demand for new loans.

But at what price are all of these negatives baked in?

Let’s take a look at the numbers.  Bank of America is trading for about 10 times earnings and 0.68 times book value.  Using the more stringent metric of price-to-tangible book, which excludes intangible assets such as goodwill, we get a multiple of 1.1 times.

This means that Bank of America is worth nearly as much dead as alive and that investors are assigning virtually no value at all to the bank’s continuing operations.  That seems a little harsh given the progress the bank has made in cleaning up its loan book and given the nationwide improvement in home prices.  The S&P Case-Shiller 20-City Home Price Index is up about 12% over the past 12 months alone.

And what about the bank’s outlook?  Bank of America isn’t due to report its third-quarter results until the 16th of this month, but we can look to the last release for guidance.

Bank of America’s net charge-offs and provisions for credit losses continue to trend down, from $3.6 billion and $1.8 billion, respectively, in the second quarter of 2012 to $2.1 billion and $1.2 billion in the second quarter of 2013. The number of mortgage loans 60+ days delinquent has been cut by more than half in the past year, from 1.1 million loans in the second quarter of 2012 to 492,000 last quarter.  Management expects this to fall to 375,000 by year end.

Overall leverage continues to shrink.  And the bank’s Basel III tier 1 capital ratio—at 9.6% as of last quarter—ranks Bank of America ahead of JPMorgan (JPM), U.S. Bancorp (USB), and even Warren Buffett’s favorite, Wells Fargo (WFC).

All of this points to a bank that, while still a mess, is cleaning up its act in a hurry.  Meanwhile, Bank of America is showing modest growth in its consumer credit card and auto loan businesses, and its client brokerage assets are up 17% year over year.

With all of this said, what is Bank of America worth?

In the eight years preceding the crisis, shares fetched 2-5 times tangible book value.  Given the bank’s diminished earnings potential in these more sober of days, I would use the lower end of that range as the target.  A price-to-tangible-book ratio of 1.5 to 2.0 would put Bank of America’s stock price at $18.90 to $25.20, giving an upside of 36%-81% from current prices.

Mohnish Pabrai and Bruce Berkowitz would appear to find value in the stock.  Pabrai—a respected value investor known for making concentrated bets—has 22.9% of his funds invested in Bank of America.  Berkowitz, manager of the Fairholm Fund and another respected value investor with a reputation for making large, concentrated bets, has 16.9% of his funds invested in Bank of America.

It may not be pretty.  But Bank of America is dirt cheap, and it is the largest single holding of two well-respected value investors with phenomenal long-term track records.

Charles Lewis Sizemore, CFA, is the editor of the Sizemore Investment Letter and the chief investment officer of investments firm Sizemore Capital Management. As of this writing, he had no position in any stock mentioned. Click here to learn about his top 5 global investing trends and get your copy of “The Top 5 Million Dollar Trends of 2013.”  This article first appeared on MarketWatch.

This article first appeared on Sizemore Insights as Is Bank of America Worth More Dead than Alive?

Join the Sizemore Investment Letter – Premium Edition

S&P Futures Could Turn Bullish Above 1685 – Elliott Wave

BY Elliott Wave Analysis Service

S&P Futures extended its weakness to 1663 last week, but decline from the high can still be counted as a three wave move, so trend could turn bullish. We however need more evidences before we may look back higher again, back towards 1726. In other words, we need impulsive recovery in clear five waves through the upper channel line and also through 1685 to confirm a reversal.

SPX Elliott Wave Analysis 4h

Alternate Elliott Wave Scenario

Further weakness in the next two days towards 1625 will suggest that prices are falling impulsively. In such case we would focus on flat correction on a daily chart

SPX Elliott Wave Analysis Daily

Elliott Wave Flat Pattern

A Flat is a three-wave pattern labeled A-B-C that generally moves sideways. It is corrective, counter-trend and is a very common Elliott pattern.

Expanded Flat

• Elliott Wave Expanded Flat has 3-3-5 sub wave structure
• Wave B moves beyond the start of wave A
• Wave C ends more substantially beyond the ending level of wave A
• Expanded Flat appears in wave two or four in an impulse, wave B in an A-B-C, wave X in a double or triple zig-zag, or wave Y in a triple threes

Elliott Wave Flat Pattern

Written by www.ew-forecast.com

Try Ew-Forecast.com’s Services Free for 7 Days at http://www.ew-forecast.com/service


Tajikistan cuts rate 60 bps to 5.5% as inflation drops

By www.CentralBankNews.info     Tajikistan’s central bank cut its benchmark refinancing rate by 60 basis points to 5.5 percent, its second rate cut this year, reflecting lower inflationary pressures.
    The National Bank of Tajikistan, which has now cut rates by 100 basis points this year following a total cut of 330 basis points in 2012, also said the change in policy was aimed at lowering the average interest rate on loans in the banking system.
    Inflation in the central Asian country of Tajikistan fell to 4.6 percent in July from 6.10 percent in June and May.
    Tajikistan’s Gross Domestic Product expanded by an annual 7.3 percent in the first quarter of this year, slightly down from 7.5 percent in the previous quarter. The government has forecast growth this year of 7.4 percent following 7.5 percent growth in 2012.

    www.CentralBankNews.info


Yellen’s Fed News Fails to Shake Gold’s “Lethargy” as Goldman Targets $1050

London Gold Market Report
from Adrian Ash
BullionVault
Weds 9 Oct 08:10 EST

The WHOLESALE price of gold gave back this week’s 1.4% gains Wednesday morning in London, dropping below $1310 per ounce as European shares recovered earlier losses.

 Commodities ticked lower, as did non-US government bonds, while silver followed gold lower, but retained a 1.0% gain for the week so far.

 US stock futures pointed higher despite Washington’s current impasse over the debt ceiling moving within 8 days of a possible debt default.

 The US Dollar meantime rose sharply after the New York Times reported that current Federal Reserve vice-chair Janet Yellen – a renowned “dove” on low interest rates and stronger quantitative easing – will today be confirmed as President Obama’s choice to succeed Ben Bernanke as the central bank’s chief.

 “Sentiment has changed. People don’t seem to be flocking to gold, even in times of distress,” said Jim Iuorio, managing director of TJM Institutional Services in Chicago to CNBC on Tuesday.

 “[Gold prices] continue to hang in limbo,” says a Singapore trading desk, “unable to rally yet does not want to give up $1300 handle.”

 “The closer the US comes to reaching its debt ceiling,” say commodity analysts at Commerzbank in Germany, “and the more the risk of insolvency grows as a result, the more gold should be in demand as a safe haven in the west…which should be reflected in a climbing gold price.

 “Perhaps gold will be shaken out of its lethargy when the Fed minutes are published this evening,” says the bank, asking if the delay in ‘QE tapering’ last month was due to the US central bank’s fears over a drop in government spending.

 But “once we get past this stalemate in Washington, precious metals are a slam dunk to sell,” reckoned investment bank Goldman Sach’s head of commodities research Jeffery Currie, speaking Tuesday at Commodities Week here in London.

 Selling gold is his top raw materials trade for 2014, a view agreed Tuesday by Swiss investment and bullion bank Credit Suisse’s research chief Ric Deverell.

 “You have to argue that with significant recovery in the US,” said Currie, “tapering of QE should put downward pressure on gold.”

 Economic growth in the UK is set to outstrip the US in 2013, the International Monetary Fund said Tuesday, adding that it was “pleasantly surprised” by Britain’s ‘austerity’ policies failing to hurt growth as the IMF warned in April.

 UK manufacturing and industrial output today showed a sharp drop for August, defying analyst forecasts of strong growth.

 The Pound fell hard after the news, dropping to a 2-week low beneath $1.60. That buoyed gold for UK investors above £820 per ounce, some 0.8% below an earlier spike to 1-week highs.

 Gold priced in Euros also eased back, touching last week’s closing level at €967 per ounce as the single currency fell despite much stronger-than-expected German industrial output data for August.

Currie at Goldman Sachs now sees his target for year-end 2014 at $1050 per ounce – a “key gold level” according to panellists speaking last week at the London Bullion Market Association’s conference in Rome.

Adrian Ash

BullionVault

Gold price chart, no delay | Buy gold online


Adrian Ash is head of research at BullionVault, the secure, low-cost gold and silver market for private investors online, where you can fully allocated bullion already vaulted in your choice of London, New York, Singapore, Toronto or Zurich for just 0.5% commission.


(c) BullionVault 2013

Please Note: This article is to inform your thinking, not lead it. Only you can decide the best place for your money, and any decision you make will put your money at risk. Information or data included here may have already been overtaken by events – and must be verified elsewhere – should you choose to act on it.


Asian Equities Rebounds Amid New Nominated Fed Chairman

By HY Markets Forex Blog

Asian equities were seen heading towards a rebound, while US President Barack Obama is expected to nominate Janet Yellen as the Federal Reserve chairman, when the current chairman Ben Bernanke stands down in January.

The Asian markets advanced after the Fed decided to maintain its $85 billion monthly stimulus program.

The Japanese benchmark Nikkei 225 index edged 0.25% lower to 13,859.84 points as of 1:31am GMT, while Tokyo’s broader Topix gauge dropped 0.1% to points as the same time.

Panasonic Corp announced that the company would stop production of plasma televisions; Panasonic traded 0.33% lower at the time of writing.

The US dollar left the Japanese yen declining after the Yellen news, giving major Japanese exporters slight gains. Mitsubishi Motors rose 0.8% higher, while Sharp dropped more than 2%.

In China, the markets saw losses as it opened, with Hong Kong’s Hang Seng dropping 0.57% to 23,046.00 points as of 1:55am GMT. While Tencent lost more than 2% and COSCO Pacific slid 2%.

Kunlun Energy dropped over 1% and China Shenhua Energy lost 0.9%.

The Chinese mainland Shanghai composite rose 0.02% higher at 2,198.64 points as of 1:55am GMT. The Australian benchmark S&P/ASX index edged 0.01% higher at 5,149.80 points as of 1:58am GMT.

Resolute Mining lost 4%, while Perseus Mining declined 3%. The largest gold mining company in Australia Newcrest Mining was trading 0.8% lower at the time of writing.

New Zealand’s benchmark NZX 50 index dropped 0.39% lower as of 1:37am GMT, at 4,720.30 points.

Asian Equities – Australia Consumer Confidence

Australia’s consumer sentiment saw a slight drop in October, according to a report released on Wednesday. The Westpac/Melbourne Institute Index of Consumer Sentiment declined 2.1% in October from the previous reading of 110.6 in September to 108.3.

“The modest fall in the Index is probably due to an expected retreat following the positive expectations around the election result,” Westpac’s chief economist Bill Evans commented.

“Other factors that might have weighed on the Index were the steady fall in the share market through the survey week (down 2%) and the steady rise in the Australian dollar (up from USD 0.93 cents to 0.94 cents) through the survey week.”Evan added.


Visit www.hymarkets.com   for updates,news and more information on how you can start trading with the award-winning broker today with only $50 .

The post Asian Equities Rebounds Amid New Nominated Fed Chairman appeared first on | HY Markets Official blog.

Article provided by HY Markets Forex Blog

Gold Prices Drops As Obama Nominates Yellen

By HY Markets Forex Blog

Gold Prices were seen trading lower during Asian trading hours on Wednesday after US President Barack Obama announced that he will nominate Janet Yellen as the Chairwoman of the Federal Reserve (Fed).

Yellow metal futures for December delivery dropped 0.59% lower at $1,316.80 an ounce, while silver futures edged 0.98% lower to $22.225 an ounce at the time of writing.

The US dollar index, measuring the US dollar’s strength against six major currencies, advanced 0.27% to 80.276 at the time of writing.

Meanwhile holdings in the world’s largest gold-backed exchange-traded fund, SPDR Gold Trust, came in at 899.99 tonnes on Monday, its lowest level since February 2009.

Gold Prices – Yellen to Be New Fed Chief

According to a report by the Wall Street Journal released on Wednesday, the US President Barack Obama will nominate Janet Yellen to be the next Fed Chairman.

The official nomination is expected to be made public at 3pm (EST) on Wednesday.

Gold Prices – US Shutdown

The ongoing government shutdown in the globe’s largest economy has entered its second week, as investors continue to worry that the Democrats and Republicans will not finalize an agreement this week.

The US lawmakers have an additional 9 days to finalize the country’s debt-limit issue by October 17, when the country’s borrowing limit is expected to end.

On Tuesday, The House Speaker John Boehner commented that the US president and Democrats needs “I’m not drawing any lines in the sand,” he said.

US President Barack Obama said he expects the Congress to finalize an agreement to raise the country’s $16.7 trillion debt limit on time.

On Tuesday, the International Monetary warned the US government failure to reach an agreement to raise the country’s debt limit could seriously damage the country’s economy, cutting this year’s global outlook. The global outlook for this year will be 2.9% and 3.6% next year.


Visit www.hymarkets.com and start trading Metals online  today from only $50!

The post Gold Prices Drops As Obama Nominates Yellen appeared first on | HY Markets Official blog.

Article provided by HY Markets Forex Blog

Simple Gap Trading Strategy for the Forex Market

Article by Investazor.com

The gaps that appear on a chart are pretty important. It is a price pattern which can offer information regarding the direction of the price and the strength of the market. On Forex, because of the high liquidity, gaps are not that frequent, but they do appear especially after the weekends.

In trading a myth, that the gaps are always covered, was born. The gaps are usually covered, but it can be done very fast or it can take a longer time until it will be covered.

It is important to know that there are mainly four types of gaps:

–          Common gaps, which usually appear inside a price pattern and they are easily covered (Head and Shoulders, Rectangle, Triangle, etc.).

–          Breakaway gaps, these gaps appear when the price breaks from a price pattern or above/under important levels and shows that the market is ready to continue the move and they are not that easy to be covered.

–          Runaway gaps, these are continuation patterns just like Flags and Pennants and are they are very hard to cover because of the strength and determination of the market to move forward.

–          Exhaustion gaps are announcing that the market has reached a limit and the current move might be reversed soon and this is why it is easier for this gap to be covered.

The strategy we recommend when trading gaps it is pretty easy. When a gap appears a trader should look for other technical elements that will tell him what kind of gap it is. If he managed to determine if it is a common, breakaway, runaway or exhaustion gap, then he should wait for another candle to be drawn.

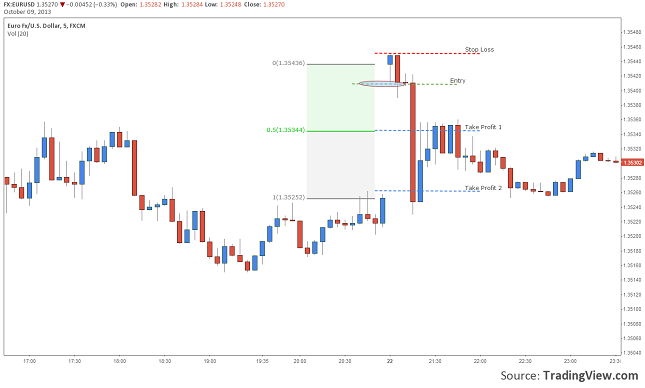
An opening of a trade right at the opening of the gap it is pretty dangerous. If another candle or candles are drawn he can use the new low as a support level. A break through this level can be used as a trigger for the trade.  The Stop level can be set above a high; it can also be the closest one. As take profit the trader can set several levels. One can be the 50% of the gap and the second the high of the last candle before the gap.

See our example on the next chart:

simple-gap-trading-strategy-resiz-09.10.2013

Chart: EURUSD, M5

This system can be adapted for all Forex instruments and time frame. The trader should consider other elements like support/resistance for his stop loss and take profit levels. The gaps could be fully closed or just partial and that is why it would be better to take into consideration several TP levels. Do not forget to apply to this strategy also your money management.

The post Simple Gap Trading Strategy for the Forex Market appeared first on investazor.com.

The Three Most Telling Economic Charts in the World

By WallStreetDaily.com

With the wounds of the Great Recession still raw for every American, it’s all too easy to fall into the fear trap.

Specifically, fearing that our country is just one financial and/or political misstep away from falling back into a deep, dark period of economic contraction and despair.

Don’t believe the lies!

While the mainstream media tirelessly tries to paint a picture of economic fragility, we’ve come a long way.

Of course, such progress isn’t obvious if all we do is focus on the media headlines of the day.

However, it is obvious if we step back and get a little perspective on the situation.

Don’t believe me? You will once you get a load of these charts…

Bank on Fewer Failures

Driven by their insatiable greed, banks stood at the epicenter of the financial crisis. Hundreds of them went belly-up, including some of America’s most storied firms.

Despite considerable regulatory reforms, most Americans still distrust banks. Moreover, they believe the banking sector is so weak, it leaves the U.S. economy vulnerable to another crisis.

Not true.

As you can see, the number of bank failures continues to plummet, dropping by about 50% each year since 2010.

In another sign of improving health, the number of institutions appearing on the unofficial list of problem banks continues to drop, too.

As Bill McBride of Calculated Risk reports, the latest list includes 685 institutions with assets of $238.7 billion. That’s down from 873 institutions with assets of $334.9 billion, representing declines of 21% and 40%, respectively.

Clearly, the banking sector is on the mend. More so than most people think.

And it’s not just important financial institutions showing definite signs of healing. The lifeblood of American economic growth is, too…

Hit the Road, Jack!

During the recession, the concept of a “staycation” gained widespread popularity. Many consumers were so broke, they couldn’t afford to travel anywhere. So they took off work and stayed put, exploring more of their own towns and cities.

Not anymore. And the proof is in rising hotel occupancy rates…

Through September, year-over-year hotel occupancy rates rose by 5.8% to 67.8%.

Even more telling… we’re actually back to pre-recession levels, which represents significant progress from 2009.

Keep An Eye on the Rails

Many economists see rail traffic as a reliable leading economic indicator. And the reason is simple: It’s a “derived demand” industry.

That means rail demand occurs only as a result of demand elsewhere in the economy for the products that are transported via rail.

Lots of railroad activity indicates lots of economic activity.

Lots of economic activity gives a much-needed boost to the country’s $15.68 trillion GDP.

And the latest data from the Association of American Railroads reveals that rail traffic is back, in a big way.

In fact, over the last month, we’ve seen the three busiest weeks for intermodal traffic volume (i.e. – shipping containersever.

This graph captures the progress. It shows average weekly intermodal traffic volumes.

As you can see, we’re on track for a record year. And we’re miles away from the anemic traffic levels witnessed in 2009.

Bottom line: Perspective matters. And now you have some.

Ahead of the tape,

Louis Basenese

The post The Three Most Telling Economic Charts in the World appeared first on Wall Street Daily.

Article By WallStreetDaily.com

Original Article: The Three Most Telling Economic Charts in the World

Have Worried Investors Given You an Opportunity to Buy Stocks?

By MoneyMorning.com.au

Investors are worried.

It’s all that talk about the US budget and the impending deadline to raise the US debt ceiling.

So it’s no surprise that investors have felt like selling stocks.

That means stock prices have dropped and the indices are lower. The Aussie S&P/ASX 200 index has fallen 150 points since hitting a five-year peak just two weeks ago. And it looks set to drop further today.

That’s about a 3% drop. Time to panic? Not on your life…

We don’t want to play down the seriousness of the budget and debt woes in the US. But we also don’t want you to overreact to it either.

These issues have pestered investors for the better part of six years – longer if you knew the stock and housing bubble was brewing before 2007.

We could be wrong, but our bet is the current volatility is just an extension of the uncertainty you’ve seen since late 2007.

To show you what we mean let’s look at the charts.

Is This the Beginning of a Bigger Fall?

Here’s a chart of the S&P/ASX 200. You can see on the right hand side how the market has dropped 150 points since the late September peak:

Source: Google Finance

However, we’ll point out one thing the chart doesn’t show. The market has just gone through a big dividend season. We know that for a fact because a whole bunch of the Australian Small-Cap Investigator stock picks have gone ex-dividend over the past few weeks.

Dividend periods can have a big impact on stock prices. You can see stock prices gain before the dividend, and then fall after shareholders have qualified for the dividend.

Odds are nervous investors have opted to ‘strip out’ the dividend by selling their stock holding after the stock goes ex-dividend. Remember that as a shareholder, in order to qualify for the dividend you don’t need to own the stock on the dividend pay date, you just need to own the stock on the ex-dividend date.

So there’s a chance that after hanging around to pick up the dividend, or even buying the stock just for the dividend, many investors have decided to take the advice of our retirement expert, Vern Gowdie, and sell their shares.

But this volatility isn’t new. We’ve seen it before. Look at the chart. It was only five months ago that the main Aussie index began a slide that would see it fall 10% in a matter of weeks.

Could stocks fall further? Sure. There’s no guarantee they won’t. What you’ve got to ask yourself is whether this is the opportunity to sell before the real plunge happens, or whether this could be the last best buying opportunity you’ll get this year.

Stocks Will Pop, but They Could Fall First

As we say, the volatility isn’t new. And quite frankly, if you can’t cope with that then you probably should take Vern’s advice and park your cash on the sidelines until either the volatility disappears or share prices are much lower.

But our view is the volatility won’t disappear. For a start, stocks are always volatile, even in relatively calm economic conditions. But when you add in worries about budgets and debt ceilings, well, that just ramps up the volatility even further.

And if you’re hoping for an immediate pop in share prices after the US President and Congress ink a deal, you may be disappointed. As the following chart shows, the last time the debt ceiling worried the markets so much in 2011, stocks fell after the President and Congress agreed to lift it (the arrow marks the spot):

Source: Google Finance

Of course, other things were happening around the same time, so we can’t pin every market rise and fall on the debt ceiling drama. Europe’s debt woes with Portugal, Greece, Spain, Italy and Ireland were at their peak around then too.

But over the longer term (the past two years) the 2011 debt ceiling impasse proved to be little more than a blip. Since US stocks bottomed in 2011 the S&P 500 index has gained 47%.

And since the start of this year the US index has gained 18%, which is almost double the return of the Australian market’s 10.2% gain.

That’s the key point. As we frequently remind you, even in a non-volatile market stocks don’t rise or fall in a straight line.

A Dangerous Game as Interest Rates Surge

We admit that we may be playing a dangerous game.

Even before the talk started to heat up about the US budget and debt ceiling, we had made it clear that our target for Aussie stocks was for the index to reach 7,000 points in 2015…and we stick by that.

But that could come undone if the US President and Congress do what we consider highly unlikely (in fact we’ll say right now there’s 0% chance of it happening). That is to allow the federal government to default on debt repayments.

That said, not everyone agrees with us. Bond investors are pricing in a possibility of default, albeit a small possibility. The US Treasury auctioned one-month treasury bills at a rate of 0.35%. According to Bloomberg News that’s the highest rate since November 2008.

Just to put that rate in comparison, the Treasury auctioned one-month treasury bills in August at a rate of 0.055%. That’s a big difference. So you can see why the market is reacting this way. By the same token we’ve seen rising interest rates spook the market before…only for stocks to shake off the concerns and rally higher (May to June this year).

So while it’s a dangerous game, as a speculator we’re prepared to play it. If we’re right and the politicians agree to pass the budget and raise the debt ceiling we expect to see stocks quickly recover and begin a long rally that will last through at least 2015.

If you agree with that view we can assure you there will be plenty of good buying opportunities today. If you think it’s more likely the US government will default on its debt then you’ll probably want to follow Vern’s advice and start ditching stocks now, while you can do so at a fair price.

Cheers,
Kris+

Join Money Morning on Google+

Special Report: UNAVOIDABLE: Australia’s First Recession in 22 Years