U.S. Credit Rating Downgraded to Same Level as Brazil?

By Michael Lombardi, MBA for Profit Confidential

The U.S. government, after winning World War II for the Allies, was very convincing. It told central banks around the world that they should hold the U.S. dollar as their reserve currency instead of gold, based on the idea the U.S. dollar would be backed by gold. Only limited amounts of U.S. dollars could be printed, because the currency was tied to gold bullion. Central banks bought into the idea.

Unfortunately, a few decades down the road, the concept of a U.S. dollar backed by gold was thrown out the window (thank you, President Nixon). Eventually we were introduced to the modern day printing press—printing money out of thin air at the will of the Federal Reserve without the U.S. dollar being tied to any “hard” currency like gold.

Why would anyone agree to this horrible idea?

Back in those days, the U.S. economy was prospering. Our government was in good shape and didn’t have much debt. And the logistics made sense, too, as time passed. Why wouldn’t a central bank have in its reserves the currency of the world’s strongest economy and military? Why wouldn’t a central banker keep U.S. dollars in his vault as opposed to hard-to-carry and hard-to-store gold?

Years have passed since the U.S. dollar “unglued” itself from gold. Things have changed, too. America is not so glorious anymore. Ever-rising debt and the never-ending printing of U.S. dollars have resulted in some countries changing their policy on U.S. dollar-backed reserves. And the fundamental factors that keep the U.S. dollar strong are deteriorating quickly.

The balance sheet of the U.S. economy does not look as good as it did in the 1950s and 1960s.

The chart below shows the change in nominal gross domestic product (GDP) and the change in U.S. debt year-over-year (yoy) on a percentage basis. You can quickly see that U.S. debt is rising at a much faster pace than GDP.

Year

% Change in GDP YOY

% Change in Public Debt YOY

2008

1.66%

10.29%

2009

-2.05%

18.26%

2010

3.75%

14.22%

2011

3.85%

9.46%

2012

4.58%

9.10%

*2013

2.56%

4.67%

Average

2.39%

11.00%

* Data until second quarter

Data source: Federal Reserve Bank of St. Louis web site, last accessed October 16, 2013.

As the chart above shows, we have U.S. government debt rising 360% faster than economic growth! GDP in the U.S. economy has been increasing at an average annual rate of 2.39% over the past six years, while government debt has been growing at an annual pace of 11% since 2008.

The mainstream doesn’t talk much about the situation I’ve just outlined above. But the obvious fact is this: the stock market rallies when it hears government debt will increase or the Federal Reserve will print more money; the stock market drops when government spending or money printing is in jeopardy.

But things are changing outside the United States.

In these pages, I have documented the actions of central banks around the global economy. In specific, after years of selling their gold bullion reserves, central banks are accumulating gold bullion again.

My belief is that central banks are losing trust in the dollar. Central banks could be realizing the devaluation of the U.S. dollar is inevitable, and thus, they are moving away from the greenback as illustrated by the chart below.

Chart courtesy of www.StockCharts.com

Just recently, the European Central Bank (ECB) and the People’s Bank of China built a bilateral currency swap line. Through this swap line, which will last three years, 350 billion yuan will be provided to the ECB and 45 billion euros will be given to the central bank of China.

The ECB, in announcing this deal, said, “The swap arrangement has been established in the context of rapidly growing bilateral trade and investment between the euro area and China, as well as the need to ensure the stability of financial markets.” The central bank added, “From the perspective of the Eurosystem, the swap arrangement is intended to serve as a backstop liquidity facility and to reassure euro area banks of the continuous provision of Chinese Yuan.” (Source: “Press Release: ECB and the People’s Bank of China establish a bilateral currency swap agreement,” European Central Bank, October 10, 2013.)

What will be the next move for central banks around the global economy? Do you really think they will continue to buy currencies that can be printed out of thin air? I doubt it.

This morning, we got news China’s Dagong Global Credit Rating agency cut its credit rating on the U.S. by one notch, stating the debt ceiling deal struck by Congress fails to solve America’s debt problem. The downgrade put the U.S. at the same level as Brazil, Israel, and Panama.

The bottom line here? The U.S. dollar is in trouble. Congress has kicked the debt ceiling problem down the road again, this time until February of 2014. Meanwhile, gold is having its best day of the month. A new trend? Maybe even a permanent one.


Why Opportunity Abounds Where the Rest of the Market Isn’t Looking

By Mitchell Clark, B.Comm. For Profit Confidential

If the trend is your friend on Wall Street, it’s also the case that there are opportunities and value among stocks that have been abandoned by investors.

While the financial media tends to prefer doom and gloom, genuine opportunity in the stock market is rarely in the headlines. The focus needn’t be on what is wrong with the world; we already know that. What’s lacking is how you can profit from it.

Precious metals stocks are becoming more and more attractive these days, but I don’t think we’ve seen a bottom yet in gold and silver stocks.

Currently, some of the best risk-capital opportunities in the stock market are U.S.-listed Chinese stocks. It’s a sector that’s pretty much been abandoned by the marketplace.

The reasons why the marketplace is no longer interested in Chinese stocks are obvious, but at the height of disinterest comes the best prices. By the time interest hits and the story is in the newspapers, most of the money has already been made.

One company that’s experiencing a genuine stock market turnaround is China Ceramics Co., Ltd. (CCCL). And it’s doing so ahead of its financial turnaround, which indicates that investor sentiment is warming to the story.

China Ceramics manufactures and sells ceramic tiles to both residential and commercial customers in China. The company stumbled both operationally and on the stock market due to China’s planned real estate restraint. The position then met the same fate as virtually all other U.S.-listed Chinese stocks that imploded on the stock market because of the plethora of accounting frauds.

But the tide is slowly turning for many of these listings and there’s real value in some turnaround trades. (See “One of the Best Agriculture Businesses You’ve Never Heard Of.”)

China Ceramics actually offers a hefty dividend and the stock is reasonably priced. Stock market action recently experienced a robust turnaround, and it very much looks like there is some new betting on the company’s operational turnaround. China Ceramics’ one-year stock chart is featured below:

Chart courtesy of www.StockCharts.com

In the second quarter of 2013, China Ceramics said business conditions were picking up and that the construction sector is showing signs of recovery.

The company had to deeply discount its prices for ceramic tile to keep its market share in China’s recent economic downturn. But second-quarter sales volume was 8.3 million square meters of ceramic tiles, representing a substantial 36% increase over the first quarter this year.

With continued improvement in the company’s sales in its upcoming earnings report, China Ceramics’ $80.0-million stock market value could easily be $100 million.

With effort and persistence, you can find jewels among the stock market’s downtrodden. The key is to ignore the media and focus on individual companies and the action of the stock market.

All the opinions in the world are worth far less than knowing for yourself a company’s corporate earnings results, which companies recently hit new 52-week highs and lows, and what new companies are coming to market.


Global Market Review 18/10/2013

Guest post provided David Wilson of BinaryOptionsDailyReview.com

Dow Jones

US stocks ended mostly higher with the S&P 500 finishing at a record high. Investors’ attention has now switched to corporate earnings now there has been a temporary fix for the fiscal dilemma. So far IBM, which traded down 6.7% and Goldman Sachs, which traded down almost 2.5% are the main Dow constituents to report disappointing earnings. The S&P 500 finished up 11.61 points at 1,733.15. The Dow was at one stage over 140 points easier but rallied and late in the session did break into positive territory before finishing down 2.18 points at 15,371.65.

After hours Google reported earnings that beat estimates and in after hours trading the shares surged 7% to $950.50 on heavy volume.

FTSE

The FTSE extended its winning streak to the sixth straight session helped by well received earnings from SABMiller PLC and British Sky Broadcasting PLC and upbeat economic news in the form of retail sales. The FTSE finished the session up 4.57 points at 6,576.16.

Pre Market Opening

European stocks are expected to open higher this morning boosted by data showing acceleration in China’s economic growth. The Chinese economy grew 7.8% in the third quarter, the fastest pace of growth this year as rising foreign and domestic demand lifted factory production and retail sales. The FTSE is expected to open around 30 points higher, the DAX around 23 points higher and the CAC around 15 points higher.

The Nikkei closed down 24.97 at 14,561.54, the Hang Seng was on track to close higher, it was last seen up 232.51 points at 23,327.39.

The US Department of Labor reported that the number of people filing for initial jobless benefits last week declined by less than expected 15,000 to a seasonally adjusted 358,000, however data is still being affected by computer issues in California. The Philly Fed manufacturing index came in ahead of expectations with a reading of 19.8 against an expected reading of 15.0.

The UK Office for National Statistics said that retail sales in the third quarter grew 1.5% on the second quarter that makes the largest calendar quarter increase since the first quarter of 2008, which was when economic output hit its peak.

Forex, Binary Options News

The Dollar eased against most major currencies as the possibilities grew that the Federal Reserve would continue its bond buying programme well into next year due to the fallout from the debt crisis. After the Dollar rallied yesterday on the news of the deal it soon turned easier as investors focused on the damage to the fragile US economy and the chance that the whole issue could be replayed early next year. The Dollar was sharply lower against the Yen with the USD/JPY dropping 0.88% to ¥97.90. The Euro rose to an eight month high against the Dollar with the EUR/USD advanced 0.99% to $1.3670. Sterling rallied strongly on the back of strong retail sales data with the GBP/USD climbing 1.26% to $1.6149. The Dollar lost ground against the Canadian dollar with the USD/CAD losing 0.35% to CAD$1.0291. The Dollar was easier against the Australian and New Zealand dollars with the AUD/USD ending the session up 0.86% to a four month high of $0.9634 and the NZD/USD climbed 0.93% to a six month high of $0.8503.

Commodity News

Gold prices ended the US day session sharply higher as heavy short covering was prominent as well as some safe-haven buying interest. The sharply lower US Dollar index was also a bullish factor for the precious metals markets. December gold was last up $37.90 at $1,320.80 per ounce. Spot gold was last quoted up $38.50 at $1,321.50. December silver last traded up $0.56 at $21.925 per ounce.

Crude oil futures settled lower and close to the $100 a barrel level following data from a trade group which showed a much bigger-than-expected jump in crude supplies coupled with the possibilities that the government shutdown may have impacted on energy demand. November crude dropped $1.62 to settle at $100.67 per barrel. December Brent crude fell $1.48 to $109.11 per barrel.

Overview

Debt ceiling sorted, budget sorted and US government is back to work everything is rosy, or is it? The deal that was struck is only a temporary fix and the band aid will come off early next year if a permanent solution is not found, meaning we could be back to square one and going through all this again early in the new year. The euphoria in the markets on the news that a deal had been struck soon evaporated when the details were published and the brakes were put on any further headway. It will be an interesting few days in the markets as all the news is digested, expect a fair bit of volatility in the DOW, USD and gold, making for some ideal short term trading opportunities.


EUR/USD Technical Overview before the NFP Release

Article by Investazor.com

The United States Congress got to an agreement on the debt ceiling, avoiding this way a default of the country. Yesterday the government was restarted after a two week partial shutdown. The markets became euphoric and investors started to sell safe havens for riskier assets. The dollar was sold quickly and the selling accelerated when Dagong, a rating company from China, downgraded the United States to A-.

eurusd-technical-overview-before-nfp-resize-18.10.2013

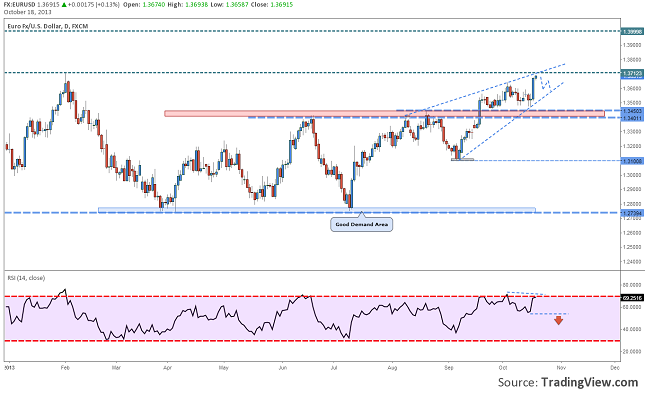
Chart: EURUSD, Daily

EUR/USD rallied yesterday from 1.3515 to 1.3670 in several hours, hitting a new high for the past eight months. The price is very close to February’s high, 13710, and the price action is signaling a reversal. The Rising Wedge drawn during the past weeks might find a new high near this level. From here I expect a short correction, before a break above the resistance.

Next week on Tuesday the Non-Farm Payrolls are scheduled to be published on the economic calendar. If the labor data from United States will disappoint the market, we might see another big fall for the dollar because the Quantitative Easing will most probably continue even after Ben S. Bernanke will leave Federal Reserve.

The post EUR/USD Technical Overview before the NFP Release appeared first on investazor.com.

Friday Charts: Setting the Record Straight on the United States, Europe and Japan

By WallStreetDaily.com

Why use lots of words when pictures will suffice?

That’s our motto on Fridays in the Wall Street Daily Nation.

Once a week, we select a handful of graphics to put important economic and investing news into perspective for you.

This week, I’m dishing on the one thing more painful than the debt ceiling debate, why repetition is important to profitability, and why the fearmongering about the United States being the next Japan needs to stop.

Without further ado, let’s go to the charts!

It Could Have Been Worse

The government is (finally) open again. And that should put an end to the hour-by-hour stock market spasms we endured for the better part of two weeks. Fingers crossed.

Of course, it never hurts to put our most recent trying times into perspective. In this case, it could have been worse.

Despite the uptick in volatility during the shutdown, the average daily percentage move for the S&P 500 Index only increased from +/-0.43% to +/-0.55%, according to Bespoke Investment Group.

That’s a far cry from the volatility we witnessed during the last debt ceiling debate. Back then, the S&P 500 whipsawed, swinging back and forth by an average of 1.92% on any given day.

So rejoice and be glad that this wasn’t as bad as the last time.

Turning Japanese? Not Anymore!

How many times have we heard that the United States was following in Japan’s footsteps? Too many to remember, for sure.

I’ll concede, the similarities were scary: runaway government debt, stubbornly low inflation and, of course, a comatose stock market.

But don’t let anyone dog our great country like that anymore.

As Michael Hartnett, Chief Investment Strategist at Bank of America (BAC), says, “Leveraged areas of the [U.S.] economy appear to be healing more strongly than they did in Japan.” And that’s finally showing up in the stock market.

After mirroring the moves of the Nikkei 225 Index for way too long, the S&P 500 is now officially charting its own course.

Lest you think I’m overly patriotic, here’s a humbling development for U.S. stocks…

European Blue Chips Win Out

After months and months of banging the drum, I know that my wildly contrarian and bullish calls on Europe got tiresome. But please tell me someone listened!

Cheap blue-chip European stocks trounced their American counterparts in the third quarter. By an embarrassing margin, quite frankly.

The SPDR EURO STOXX 50 ETF (FEZ) rallied 16.2%, compared to a mere 2.3% rise for the SPDR Dow Jones Industrial Average ETF (DIA).

Blue-chip European stocks remain the cheaper of the two. They’re about 10% less expensive on a forward price-to-earnings ratio basis – and almost 50% cheaper on a price-to-book ratio basis.

Plus, they’re still not getting much attention. In other words, it’s still a contrarian trade, which points to more profits ahead. So stick with the trade.

That’s it for this week. Before you go, though, let us know what you think of this weekly column – or any of our recent work at Wall Street Daily – by going here.

Ahead of the tape,

Louis Basenese

The post Friday Charts: Setting the Record Straight on the United States, Europe and Japan appeared first on Wall Street Daily.

Article By WallStreetDaily.com

Original Article: Friday Charts: Setting the Record Straight on the United States, Europe and Japan

Chile cuts rate 25 bps, sees slower demand, global growth

By www.CentralBankNews.info     Chile’s central bank cut its policy rate by 25 basis points to 4.75 percent, citing slower global growth, indications that the domestic demand will slow down further and inflation below forecasts.
    The rate cut comes after the Central Bank of Chile’s board considered cutting the rate in the last five meetings but ultimately decided to maintain the rate while awaiting evidence of how the economy was evolving. But the bank had warned in recent months that it may cut its rate if the economy continues to slow down.
    The rate cut came as a surprise to most economists who had expected to central bank to maintain its rate this month but then cut later this year.
    The central bank, which previously cut its rate by 25 basis points in January 2012, did not give any sign of future policy direction, saying “any future changes in the monetary policy rate will depend on the implications of domestic and external macroeconomic conditions on the inflationary outlook.”
    Chile’s inflation eased to 2.0 percent in September from 2.2 percent in August, at the bottom of the bank’s 2-4 percent inflation range, and the central bank said it would continue to conduct monetary policy with flexibility so projected inflation stands at 3.0 percent over the policy horizon.

    Chile, the world’s largest copper exporter, has been feeling the impact of slower global growth for months and the central bank said a weaker medium-term scenario had consolidated, characterized by slower world growth, lower terms of trade for Chile, less favorable financial conditions and the maturing of the global cycle of mining investments.
    Although the U.S. Federal Reserve’s decision to postpone a tapering of asset purchases had led to lower long-term interest rates, the bank said the fiscal agreement reached in the United States was “temporary, so further financial tensions cannot be ruled out.”
     Chile’s Gross Domestic Product grew by 0.5 percent in the second quarter from the first for annual growth of 4.1 percent, down from 4.5 percent.
    The bank said economic activity was in line with its forecast and the growth in final demand had slowed, though not as sharply as forecast.
    “Various indicators anticipate that it will decelerate further,” the bank said.
    While Chile’s exports have been weakening in recent months, domestic demand had remained resilient. In June the central bank cut is 2013 growth forecast to 4-5 percent, down from 2012’s 5.6 percent, and its inflation forecast to 2.6 percent.

    www.CentralBankNews.info

  Chile’s central bank held its policy rate steady at 5.0 percent, as expected, and said that it may adjust policy rates in coming months if the recent trends continue as forecast, the same guidance the bank has given in recent months.

    “Any future changes in the monetary policy rate will depend on the implications of domestic and external macroeconomic conditions on the inflationary outlook,” the Central Bank of Chile said.


The consolidation of the trends outlined in the last Monetary Policy Report could call for adjustments to the monetary policy interest rate in the coming months. 


 “The consolidation of the trends outlines in the last Monetary Policy Report could call for adjustments to the monetary policy interest rate in the coming months,” the central bank said, repeating its statement from July.

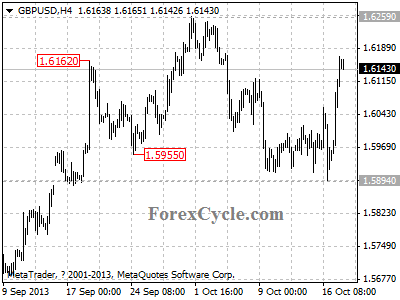
GBPUSD breaks above 1.6060 resistance

GBPUSD breaks above 1.6060 resistance, suggesting that the downtrend from 1.6259 has completed. Further rise to test 1.6259 resistance would likely be seen, a break above this level will signal resumption of the uptrend from 1.4813 (Jul 9 low), then the following upward movement could bring price to 1.6600 zone. Key support is now at 1.5894, only break below this level could indicate that the uptrend from 1.4813 had completed at 1.6259 already, then the following downward movement could bring price to 1.4500 area.

gbpusd

Provided by ForexCycle.com

Why a Higher Aussie Dollar is The Boost Aussie Stocks Are Waiting For

By MoneyMorning.com.au

It seems so long ago.

And yet it wasn’t.

It was only about two months ago that it was falling.

Most people said it would go even lower.

But since then things have turned. And now, maybe there’s a chance it will go higher again.

And if it does it could be the extra boost that Aussie stocks have waited for…

What is the ‘it’ we’re talking about?

It’s the Aussie dollar of course.

The Aussie dollar stayed above or near par with the US dollar from late 2010 through until the end of May this year.

It stayed high not because anyone expressed any particular confidence in the Aussie dollar, but because Australia had higher interest rates than the US.

This allowed investors to take advantage of the carry trade. That means borrowing in a low interest rate currency (US dollar) and then converting the borrowed dollars into a higher interest rate currency (Aussie dollar).

For the big institutional investors this can be almost a risk-free trade…providing economic conditions are stable and predictable. Although it may not have seemed like it at the time, the period from late 2010 to mid-2013 was relatively stable…in a way.

It was stable in that almost everyone knew that the US Federal Reserve would keep printing money. As long as investors kept thinking that, the carry trade would continue.

That all changed this past May…

Death of the Carry Trade

The following chart shows the vicious sell-off in the Australian dollar that started in May and continued through until the end of August:


Source: Google Finance

If you recall, May was around the time when the markets began to get the jitters about a possible end to the US Fed’s money printing.

The argument went that if the Fed stopped printing money it would cause US interest rates to rise, which would result in the US dollar rising against other currencies.

That was the last thing the carry traders wanted to hear. Even the potential for the money printing to end was enough. Carry traders dumped the Aussie dollar in droves in order to return to the perceived ‘safety’ of the US dollar.

The result was the chart you see above.

(Note: Because the carry trade involves borrowing US dollars and buying Aussie dollars, if the Aussie dollar falls traders have to use more Aussie dollars to pay back the US dollar loan.)

The Bull Market Keeps Going

The natural reaction by many was to assume that not only would this exodus from the Aussie dollar see the Aussie dollar fall, but that it would cause stocks to fall too.

This view was right…for a brief time anyway. But around that time we suggested you should take that conventional wisdom with a grain of salt. We argued that a falling Aussie dollar could just as likely be good news for Australian stocks.

It was part of why we said investors shouldn’t sell stocks even though most other folks had panicked and sold. As the following chart shows, we looked pretty dumb at first, until stocks started to turn back up again in June:

Source: Google Finance

The S&P/ASX 200 index is the red line. You can see that after the panic selling stopped in June, the Aussie market rallied around 10% even though the Aussie dollar stayed mostly flat.

But now things have changed again. The market has at last come around to our way of thinking, and it looks like being more good news for Aussie stocks…

Resurrection of the Carry Trade

It would be natural for you to think that if the Australian stock market went up as the Aussie dollar stayed low, then won’t it be bad news for Aussie stocks if the Aussie dollar goes back up again?

The answer is no. Now before you accuse us of being a perma-bull, where we only ever see good news for stocks whatever the prevailing news, let us explain our view.

Our view is that the market has finally gotten it. After months of being duped into thinking the US Fed was about to stop money printing, the market finally realises there is zero chance of that happening.

So that now the market realises there is only one outcome – more money printing, a continuation of low interest rates, and investors buying risky assets.

Whether you agree or disagree with this from a moral or macro-economic view, it doesn’t matter. What matters is what will happen to stock prices. The US Congress has delayed any action on the budget and debt ceiling until next year, and new Fed chairman Dr Janet L Yellen starts in her new job around the same time.

Seeing the instability that the Fed, the US president and the US Congress have created over the past five months, the protagonists will be keen to avoid repeating this mess. As we say, that means more of the same.

And from an Aussie perspective it should mean more good news for stocks as the carry traders regain their confidence and look to benefit from Australia’s relatively high interest rates compared to the US.

The next surge in stock prices may not happen overnight. But last night’s action in the US is a pretty good start. The US S&P 500 index stands at a new record high.

This means Christmas may come early for investors. Look out for the ‘traditional’ Christmas rally. If it kicks off as much as we expect, that should mean the Aussie index hitting our short-term target of 6,000 points by the end of the year.

Cheers,
Kris+

From the Port Phillip Publishing Library

Special Report: UNAVOIDABLE: Australia’s First Recession in 22 Years

Join Money Morning on Google+

Author information

Kris Sayce

Kris Sayce is Editor in Chief of Australia’s biggest circulation daily financial email — Money Morning. (You can subscribe to Money Morning for free here).

Kris is also editor of Australian Small-Cap Investigator, his small-cap stock research service, where he provides detailed analysis on some the brightest, smallest listed companies on the ASX.

If you’re already a subscriber to these publications, or want to follow his financial world view more closely, then we recommend you join Kris on Google+. It’s where he shares investment insight, commentary and ideas that he can’t always fit into his regular Money Morning essays.

The Big Money to be Made in the Aluminium Sector

By MoneyMorning.com.au

Miners and metal suppliers have had a tough year.

Share weakness reflects low commodity pricing, poor global prospects for basic materials and entire investment sectors that are simply out of favour just now. Many investors seem to prefer bonds and tech, if not plain old cash.

So what does the future hold for investors in basic materials? Can we identify any secrets to success? Can we get in ahead of the turning wheels of the business cycle?

In the past two years…aluminium pricing has been shaky on the best of days and weak on most others.

Today, let’s look at a ‘basic’ material supplier that has apparently found the bottom. Shares may be poised for a strong comeback – but beware on that last point, because you might have to wait a while.

The company I’m about to discuss is NOT a ‘buy’ just yet. But it definitely ought to be on your radar screen because of its importance to global industry and as a barometer for market sentiment.

A Very Useful, Versatile Metal

The other day, I listened in on a conference call by Klaus Kleinfeld, CEO of Alcoa (AA.) The aluminium company’s shares trade at $8 – a four-year low – which is far down from the high of $18 about two years back. I followed Alcoa in the portfolio for my newsletter a few years ago, but sold out before the shares drifted into the current doldrums.

I’ve always liked aluminium. It’s a very useful, versatile metal. It’s abundant in the Earth’s crust, but hard to obtain. Indeed, in the olden days, aluminium was so rare and valuable that Napoleon had a set of serving tableware made from it, which he only used when he wanted to impress visiting royalty.

Basically, you manufacture aluminium metal by passing large amounts of electric current through the mineral bauxite. So aluminium is energy intensive, such that it’s like ‘storing’ electricity for future application. Winners in the aluminium biz are usually players with the lowest-cost electricity.

Despite the energy cost factor, the global aluminium business is highly competitive. There are many players and plants scattered across the world, from the Middle East to Russia to Iceland (yes Iceland, based on cheap geothermal energy).

Aluminium prices crashed in the recession of 2008-09, and then rebounded. In the past two years, since about 2011, aluminium pricing has been shaky on the best of days and weak on most others.

Alcoa has survived all through the crummy metals market. In fact, Alcoa just announced surprisingly strong earnings to the upside. Alcoa booked third-quarter net income of $24 million, up from a loss last year of $143 million. A metal play that’s turning a profit? I’m all ears.

According to Alcoa’s Kleinfeld, two things helped improve profitability. Management has focused on restructuring the company away from primarily supplying commodity metal, while also adding value to every molecule of alloy that it ships.

In fact, Alcoa is making its best money downstream this year, with a 22% gain in after-tax operating income for the company’s engineered products and solutions. That is, you can smelt aluminium and cast it into ingots. But in the words of former Alcoa CEO Paul O’Neill (who left the company to become Secretary of the Treasury under President George W. Bush), ‘You can’t put beer in an ingot.

Alcoa is much more than a ‘beer can’ company, however – and don’t discount for a second the advanced tech that goes into making things like aluminium cans.

Part of Alcoa’s secret to success is the continuing stream of ideas that comes out of the company’s well-regarded technical centre, near Pittsburgh. This includes things ranging from super-high-strength alloy for military aircraft to lightweight drill pipe for the oil and gas industry. The technology is simply stunning, when you get into it.

Adding value helps make Alcoa ‘independent of commodity pricing,‘ Kleinfeld said. Thus, the company can ‘win in the market‘ through its organic technical capabilities.

According to Kleinfeld, Alcoa has generated ‘$825 million in productivity gains‘ in 2013, based on management initiatives and willingness to adopt suggestions from employees, vendors, customers and outside consultants. Looking ahead, Alcoa has over 14,000 more ‘productivity-enhancing ideas’ in the pipeline. So internal improvements have every possibility of continuing despite the external market and/or overall economic environment.

Kleinfeld stated, ‘I think all of our businesses have found a way to push back against headwinds‘ – meaning weak commodity pricing and slow global growth. The key idea is to grow productivity, which is ‘part of [the Alcoa] operating process.‘ Plus, this style of internal evolution is deeply ingrained and ‘only limited by the creativity of our employees.

Looking ahead, the aerospace industry is growing over 10% annually, with associated demand for more and higher-quality aluminium alloys. Boeing and Airbus both have a solid backlog of over eight years of commercial airliner production – and that’s if zero new future airline orders come in, which is unlikely.

On the defence side, military procurement is already cut back to the bone. Yes, things could get worse…but actually, not by much. If there’s a turnaround due to the need to rebuild military capacity in the face of new threats, Alcoa is poised to deliver all manner of high-end, high-value products to aircraft and ship builders.

Stunning News From This Sector

Meanwhile, on the ground, the automotive sector uses more and more aluminium. In 2012, for example, the average US car contained about 14 pounds of aluminium. But looking ahead, that number is destined to increase to over 55 pounds by 2015, based on industry designs that are already fixed and contracts that are already signed.

So this is demand that will happen, and the only limit is the end-market for automobiles at the showroom floor.

Looking out even further, the news from the auto sector is stunning. Kleinfeld foresees the average automobile holding 135 pounds of aluminium by 2025. That’s not quite a 10-fold increase in the next decade.

Alcoa has three major expansion projects in progress to meet growing automotive demand. These include a $300 million expansion in Davenport, Iowa; a $257 expansion at Alcoa, Tenn.; and a $380 million project in energy-rich Saudi Arabia, with output destined for the global auto industry.

Another upbeat business sector for aluminium is in commercial buildings and construction. According to Kleinfeld, ‘This is not the same market that it was before the recession.‘ Across the US, Europe and the rest of the world, Alcoa sees building energy requirements increasing. This opens up all manner of new ideas for engineered aluminium products in exterior surfaces, windows, elevators and more.

When you step back and take it all in, Alcoa is operating in the same price-challenged, investment-challenged marketplace as everybody else – gold and silver miners, copper miners, you name it. But Alcoa has focused on what the company can control and done well even during otherwise hard times.

The secret sauce is controlling costs internally and building that aspect of operations deep into company culture. Then there’s adding value to the output.

In the end, for management, it’s all about finding more and more value in the products that the company makes and sells.

That’s all for now. Much more to discuss in the weeks to come. And aren’t you glad that I didn’t digress into some discussion of the government shutdown? As if there’s not enough of that in the news!

Byron King
Contributing Editor, Money Morning

Publisher’s Note: Big Money in the Beer Can Sector originally appeared in The Daily Reckoning USA.

Author information

Byron King

Byron King

How to Find Trading Opportunities in ANY Market

Learn ways to spot trading opportunities using wave analysis and other technical analysis methods

By Elliott Wave International

Senior Analyst Jeffrey Kennedy is the editor of our Elliott Wave Junctures and one of our most popular instructors. Jeffrey’s primary analytical method is the Elliott Wave Principle, but he also uses several other technical tools to supplement his analysis.

In this trading lesson, Jeffrey demonstrates how to determine when an Elliott wave trade setup becomes a trade.

You can apply these methods across any market and timeframe.


Lesson 1: Ready, Aim … Fire: Knowing When to Place a Trade

A very important question you need to answer if you are going to use the Wave Principle to identify high-confidence trade setups is, “When does a wave count become a trade?”

To answer this question, let me draw upon the steps required to fire a firearm:

Step 1 (Ready) — Hold the rifle or pistol still…very still.
Step 2 (Aim) — Focus and align your sights.
Step 3 (Fire) — Pull the trigger without tensing your hand.

If you follow these steps, you should at least hit what you’re aiming at, and, with a little practice, you should hit the target’s bull’s-eye more often than not.

As an Elliottician and a trader, I employ a similar three-step approach to decide when to place a trade. Figure 1 shows a schematic diagram of a five-wave advance followed by a three-wave decline — let’s call it a Zigzag. The picture these waves illustrate is what I call the Ready stage.

In Figure 2, prices are moving upward as indicated by the arrow. At this stage, I begin to aim as I watch price action to see if it will confirm my wave count by moving in the direction determined by my labeling.

Once prices do indeed begin to confirm my wave count, I then determine the price level at which I will pull the trigger and Fire (that is, initiate a trade). And, as you can see in Figure 3, that level is the extreme of wave B.

Why do I wait for the extreme of wave B of a Zigzag to give way before initiating a position? Simple. By waiting, I allow the market time to either prove or disprove my wave count. Moreover, once the extreme of wave B is exceeded, it leaves behind a three-wave decline from the previous extreme.

As you probably know, three-wave moves are corrections, according to the Wave Principle, and as such, are destined to be more than fully retraced once complete. An additional bonus of this approach is that it allows me to easily and confidently determine an initial protective stop, the extreme of wave C.

Remember, all markets have a wave count; however, not all wave counts offer a trading opportunity. So the next time you think you have a wave count, rather than just blindly jumping in, first steady yourself, wait while you aim, and then — if price action does indeed confirm your wave count — pull the trigger.

Also, it is important to note that this is my way of applying the Wave Principle practically, but it’s by no means the only way.


If you are ready for more lessons on how to become a more successful technical trader, get Jeffrey Kennedy’s free report, 6 Lessons to Help You Spot Trading Opportunities in Any Market.

Jeffrey has taught thousands how to improve their trading through his online courses, his international speaking engagements, and in his trader education service Elliott Wave Junctures.

This free report includes 6 different lessons that you can apply to your charts immediately. Learn how to spot and act on trading opportunities in the markets you follow, starting now!

Access Your Free Report Now >>

This article was syndicated by Elliott Wave International and was originally published under the headline How to Find Trading Opportunities in ANY Market. EWI is the world’s largest market forecasting firm. Its staff of full-time analysts led by Chartered Market Technician Robert Prechter provides 24-hour-a-day market analysis to institutional and private investors around the world.